The Hot Stocks Outlook uses VantagePoint’s market forecasts that are up to 87.4% accurate, demonstrating how traders can improve their timing and direction. In this week’s video, VantagePoint Software reviews forecasts for Adobe($ADBE), Tyson Foods ($TSN), Baker Hughes ($BKR), Dril-Quip ($DRQ), and Energy Transfer ($ET)
Register for a Free Live Training
Hello again, traders and welcome back to the Hot Stocks Outlook for July 9th, 2021. Hope you’re all having a great week out there in the financial markets and always a lot to take a look at here in our Hot Stocks Outlook. So we’re going to go ahead and we’ll start out with shares of Adobe. We also have Tyson Foods and a bunch of energy stocks. And what I really encourage traders to do and I know I’ve mentioned this over the past several weeks, but it would really be helpful to go back and actually watch the videos from about this point forward from about May 15th through the 20th is when the S&P is bottomed out. We got a lot of markets moving higher, and that’s what we’ve highlighted is that pivot and getting involved in that trend reversal earlier.
So what we have is a really great example here in Adobe and it acts as a good example of what’s happened broadly across the marketplace. So what we have here is daily bars and candles, right? So each one of those candles represents a full and complete trading day and right up against all of that daily price action you’ll see that there is a black line and also a blue line there. Now that black line that you’re seeing there, that is what we call the actual simple moving average. And all that is is a simple moving average. It’s just in this case it’s going to look back over the past 10 close prices, add those together and divide by 10. And it acts as a good rolling measure of where market prices have already been. So it smooths out the price data.
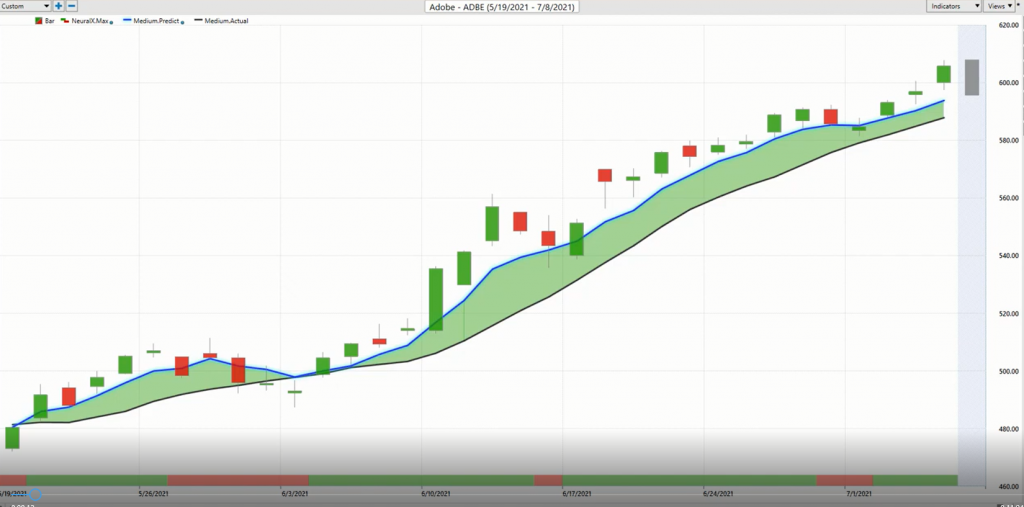
But obviously traders need to understand, well, where are prices going? Moving forward? I need to be ahead of this move of we know where they’ve been, but where are things likely to move going forward? And so what we’re able to do is compare the value of that black moving average. We can think of that as a lagging, moving the average to this blue value. And so for this value and this is our Vantagepoint proprietary predicted moving average, but for that number to get calculated, so that actual prediction of future average prices. Vantagepoint is utilizing its technology of artificial neural networks so a type of artificial intelligence to look for relationships between markets.
And this is very significant because we understand, a really great example here is what happened to the S&P 500 in about mid-May it bottomed out on a sell-off, and then the stocks all started reverse. That’s had implications for a lot of stocks and has really helped you be a good stock picker and finding areas where the market as far as the stocks are going to benefit the most as the S&P moves higher and some of those other markets bottom out, we’ve seen have done really well over the past couple of months, but this is the key is understanding that things like the S&P 500, things like the Dollar Index or interest rates, but also more subtle relationships like ETF groups, individual stocks. These can have very important relationships to the target markets that you’re trading and risking your money in.
And so this is very important to understand, okay, well, how are these market relationships affecting future prices? And so what happens here is that Vantagepoint is taking all of that information and actually generating a true price prediction. So it’s using that artificial intelligence to understand those leading lagging relationships, all that that’s happening and use these set of predictive indicators to really round out an overall forecast of where our price moving forward.
Now what’s helpful about this is understanding that all of these different indicators are using the same technology, but they’re tuned to different timeframes to help you with what you’re trying to do in the marketplace. So with that blue line, what that is is really simply it’s a predicted moving average, a prediction of average prices moving forward. And whenever that blue line crosses above the black line, well, as a trader you’d expect you’d want to get long, take long positions and act accordingly with your strategy.
Now at the bottom of the chart here, you’ll see you have this is what we’d call really a binary output. It is either going to be green or red. It gets updated each and every trading day, but it’s only looking ahead 48 hours at a time, right? So it’s not looking at average prices of over a longer period of time. It’s just strictly 48 hours. Does it get that right, yes or no? And it gets it right with upwards of 80, 85% accuracy in many cases and that’s a very good tool to help you manage position.
So if you know, “Hey, in Adobe, I want to be long, but I can use this tool to understand, hey, here comes some temporary weakness over the next, these subsequent 48-hour periods.” But as long as that blue line remains above the black line and that directional bias is still bullish, you’d still want to be a buyer and understand that, look, this is just temporary weakness, over a 48-hour period, but the strength very much in line with the overall forecast. Average price is moving higher, neural index very bullish over the majority of the time here.
And also we have intraday levels. So those neural networks are also utilizing those intermarket relationships to figure out where is the market likely to trade as far as an intraday high or low. So you can see how all of these timeframes are covered with these really helpful tools as far as intraday prices high or low. You’ve got a 48-hour indicator, short-term strength or weakness. You’ve got a very good measure of the average prices moving forward, so the overall trend direction of the market. And then these tools of course to help you manage those shorter term windows.
And so what we get here is the situation we’re in a Adobe, if you’re able to recognize that, “Hey, there’s been a big market shift here.” You get the benefit off of these predicted moving averages you get in early and that’s been the broader theme of stocks. If you want to buy stocks, well, May was really the point to do that and we’ve seen stocks like Adobe here, it’s a 25% rally in the past 32 trading days. This situation right here is the same thing that’s going on in First Solar and American Semiconductor. All those stocks that we looked at two months ago that was Vantagepoint saying, here comes the reversal. Here’s the time to get in as a trend trader.
But here’s the beauty of this. It’s not just about this 24% move, right? It’s understanding that. Well, now I have the benefit of these short-term predictive levels like predicted highs and lows, the neural index. And I can manage this position over this two months. Because I know I want to be long here. I know I want to add to the position if possible, if the trends continuing. But when you start the position back here and you’re, if anything, just adding to positions at these predicted lows, but you’re doing that with profits.
So you can start the position back here, get involved in the overall trend, but then use your profits to add to the position. And that’s where you can really accelerate the potential profit from an opportunity. But you’re doing that with profits you’ve accumulated over the course of the trade because you recognize what happened back here. And so this is really important. I’m spending so much time on this because this is really how Vantagepoint is extremely helpful to give you a broader view of where’s the strength in the market? Where is the weakness? Where should I be focusing capital?
And then on the short-term, how should I do intraday trade management? Where should I add to a position? Where should I potentially take profit? So we already talked about how it’s not all upside from the mid-May point.
We have this situation and Tyson Foods and this is our long-term predicted moving average here. And this is obviously on our radar over the past couple of months of if you want to get short, here’s an area where you can do that. And you see that when you then come in and say, “Okay, well, I’m going to use Vantagepoint’s predicted highs and lows. I know I want to be short here anyway.” Well, what does that going to have you doing? Well, it’s going to have you shorting at levels like this potentially in here. Expect some strength coming into the market over these periods of time.
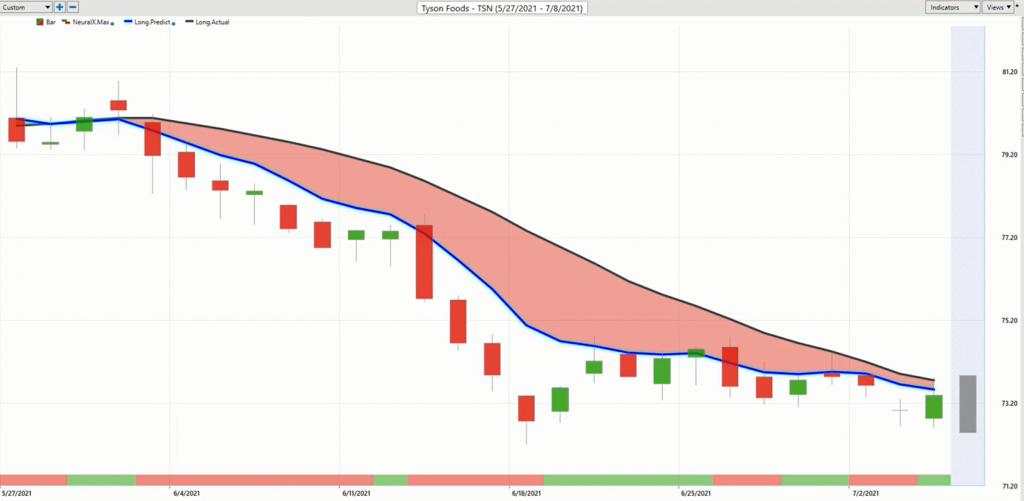
But the overall trend is still very much to the downside. And so I make these videos, this is now Thursday morning. We’re seeing a lot of volatility in the marketplace, but these are the types of things that you want to already have on your radar and already really have positions on that, yeah, you may have some long positions from mid-May that have done really well. You can trail your stops in those, but there’s been these areas where you can hedge that portfolio. And what’s happened here in my opinion and we saw this especially during these Fed announcements is this is when the dollar starts surging.
And again, this is these intermarket relationships and saying okay, you need to be aware of when you’re trading Tyson Foods, that the dollar has some serious effects on this market. And the forecasts are doing their jobs as far as saying, look, weakness, weakness, weakness. There’s clearly this has been for two months now even through all this strength in the market, a place where you only want to take profits on your shorts, if anything.
Now here’s the other issue. These are three energy stocks and a lot of the energy markets very broadly look exactly like you see here in Baker Hughes. We’re seeing some problems when you see the crude oil and commodity start to weaken, that often has some correlations with the S&P 500. So again, getting back to this. Stocks are seeing volatility. You want a tool to help you manage these relationships and how they’re affecting things. Well, if crude oil is coming down, that’s going to weigh on stocks broadly and especially weigh on energy stocks.
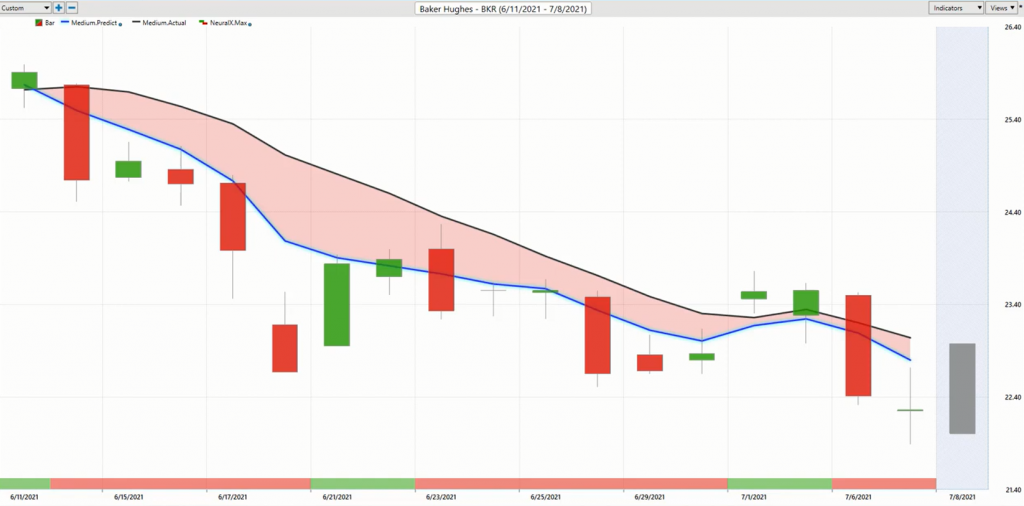
But crude oil just got weak recently, but we’ve seen weakness all across the board in these stocks and giving you an early warning sign, not just of where you potentially want to short, and that oils potentially got some problems, but understanding that stocks can be weakened in an environment like that. Dollar strong, crude oil weak. I mean, this is typical. You can see stocks move lower here. But here’s Baker Hughes and these are all going to look the same. And it’s the same thing that I’m talking about when we talk about the shift in mid-May.
If you want to get long, great, but that needed to happen in mid-May. If you want to get short in some of these energies or Tyson Foods, well, you’ve seen when the timing on that is appropriate. But here you got Baker Hughes, a really strong crossover to the downside. And this is now, I mean, this is almost a month. I mean, this is going back to mid-June as far as seeing some pretty aggressive weakness throughout the energy space. So you know very clearly that, look, it’s no longer the time to be getting long energy stocks.
If anything, you’d be shorting them. If you’re trading crude oil the commodity, you know that, hey, you really want to look for where you can tighten up, stop, get [inaudible 00:09:25] don’t be adding to your position. There’s warning signs very clearly that there’s some dangerous here.
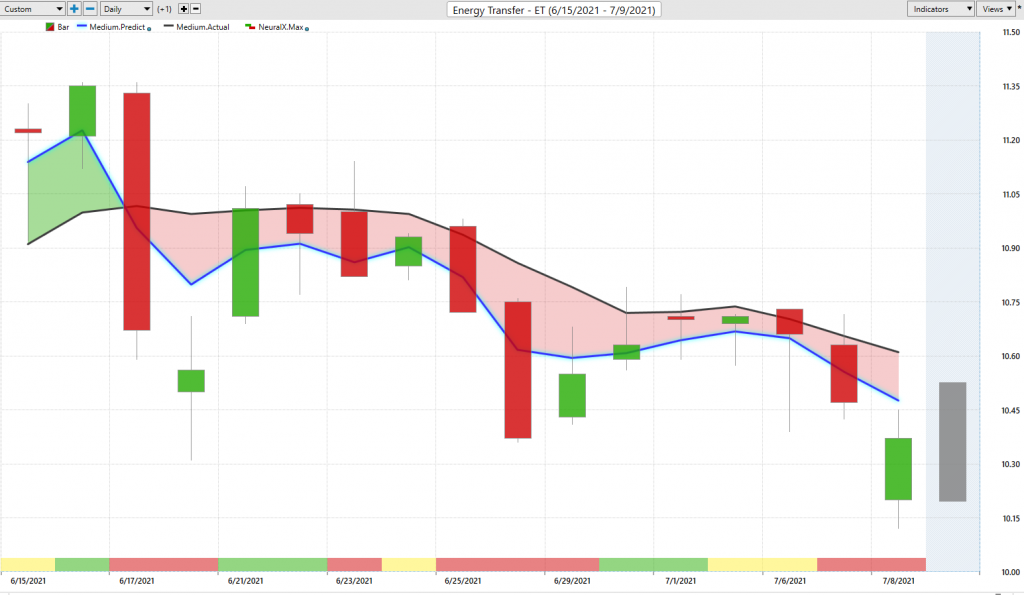
Here’s Dril-Quip, same situation. And this is why you see all these correlations playing out, but getting you those early warning signs so that as crude oil starts to trade lower and we see volatility, these things can tremendously benefit off volatility accelerating to the downside here.
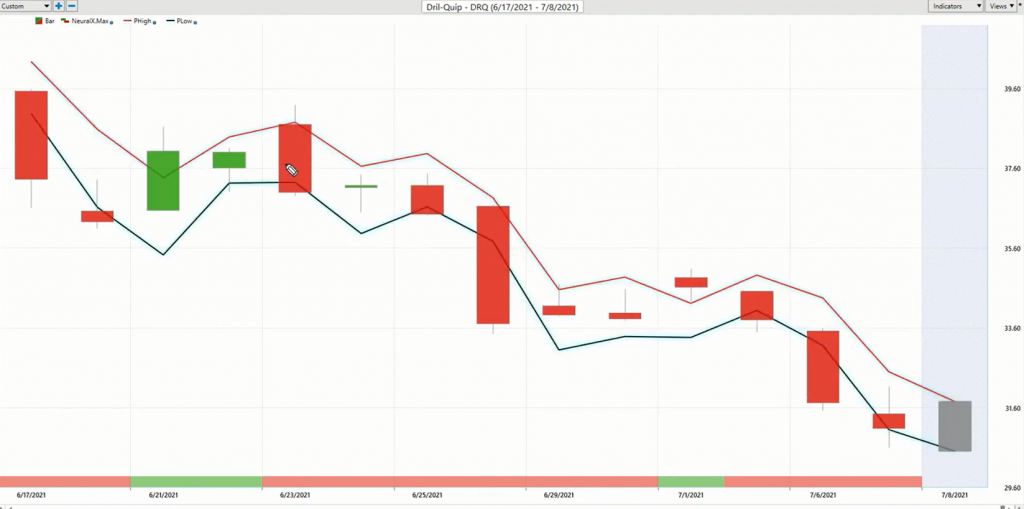
But you got to just take the trade management for what it is. If this blue line crosses to the upside and says hey, now the market’s moving higher. Well, then you got to go ahead and get longer cover your shorts, but clearly it’s given you some pretty good levels here. You see here, you get a gap up where you’re just coming to the previous predicted low or predicted high, and markets very aggressively moving lower here. And so in my mind, I’m just walking through the past couple months is these are the broader themes in the market. We had this situation in mid-May. We went over those stocks, how they’ve moved higher buy at predicted lows. Whatever your strategy is, your timeframe, use the tools to help you manage in those areas. And find those areas where you can either hedge the portfolio or have them on a list of areas where you can short and take a short position and make money that way.
And so the software’s just been doing a tremendous job here at really getting you ahead of the big moves in the market. And so what you want to do and what I really try to explain to people here is what you want is to understand that when the S&P 500 pivots from that point in May, you want to be able to find where the best stocks that are going to have the strongest percentage move. And this is where these tools come in and let you know where should you focus that attention, where is there a lot of separation between that prediction in the actual moving average. And where can you explore that strength and add some things into the overall portfolio that are going to help you?
So, once again, this has been our Hot Stocks Outlook for July 9th, 2021. Thank you all for watching. Best of luck to the traders out there in the markets, and thanks again and bye for now.