


Welcome to the Artificial Intelligence Outlook for Forex trading.
VIDEO TRANSCRIPT
Hello, everyone. Welcome back. My name is Greg Firman, and this is the Vantage Point AI Market Outlook for the week of June the 6th, 2022. Now, to get started this week, we’re going to begin where we always do with that very important U.S. dollar index. Now, once again, I do want to point out this is a weekly outlook, not a daily outlook, so what we look for is weekly strategies here.
U.S. Dollar Index ($IDX)
Again, we bring in the dollar index. The dollar index affects stocks, commodities, a number of different markets, futures markets, so when we look at the dollar index, we discussed this last week, the MA diff has crossed to the upside, but once again, to identify the key level here, which is the VantagePoint T cross long, the theory here is while the market is below this level, the market is still short, but we’re correcting higher based around this particular signal, so when we look at it starting for next week, we can see that that T cross long number is 102.35. The dollar itself is primarily bearish while below that. Now, the primary trend for the dollar and the year is clearly up, there’s no question about that, but the dollar is clearly losing strength also over the last several weeks. We’ve had a crossover take place back here on 523, but what we want to watch on a week-to-week basis is how the market is reacting to the two levels mentioned here, the T cross long and the long predicted.
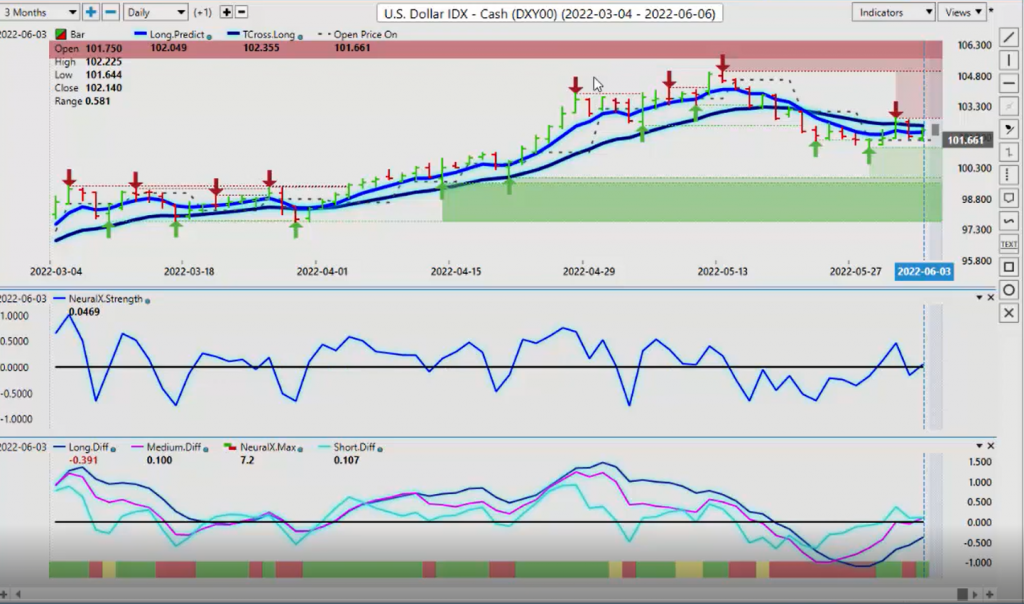
Now, what I’ve discussed in the Tampa seminars, what I’ve discussed in the Vantage Point live training room is moving away from using the predicted highs and predicted lows only for your daily trading and making sure you’re putting stop losses where they should be above or below that T cross long because again, I’m going to show several examples of this throughout the presentation, but the easiest one to show is the dollar index itself. On Wednesday, we went higher, Thursday, we’re still up there, and then on Friday, we got a solid jobs number out of the U.S., and that didn’t propel the dollar higher either, so to begin the week, 102.35 remains the target area that we must close above at least two days in a row here for the dollar to turn around and start making further gains, but as I also discussed throughout the month of May, that that seasonality in the dollar is likely going to end towards somewhere between the 15th and the 28th of the month. That’s usually when that cycle ends. Now, we do have dollar buying at the beginning of the month. That may be exhausted, but either way, we will continue to monitor these levels.
Now, the VP predicted high, 102.37, these are trades that I would look for, where you’ve got your T cross long, your long predicted, and you’ve got your predicted high all in the same place. Now, again, that would tell me this is a short as long as we stay below that particular level.
Gold
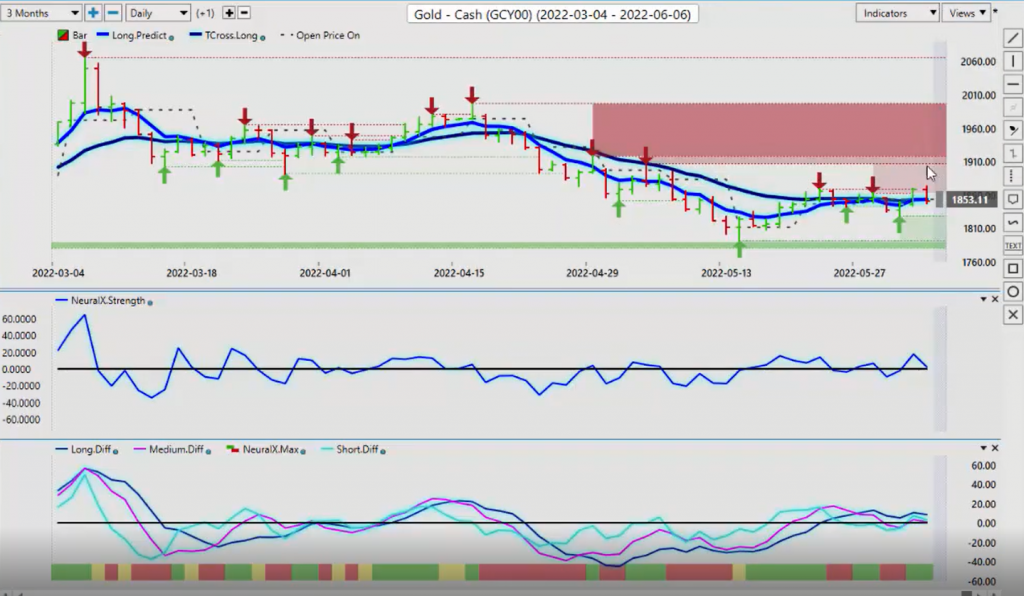
Now, if we apply the exact same concept with a market like gold, we can see that gold is getting all tangled up in these verified support and resistance zones. This high, coming in at 1869, definitely a bearish undertone here to gold, but once again, gold could easily break higher on something happening with the Russia-Ukraine. There’s a number of things that could send gold higher or lower, but we’re still got that bump in dollar weakness here, which would say that gold should probably hold onto its levels here, but again, when we look at that low of 1828, we need to hold above this next week, but for now, once again, you can see, we got to close one day above the Vantage Point T cross long at 1853 only to turn around on Friday and move lower and close below it again, so that’s why I always have that two-day rule where I’ll wait to make sure that this isn’t a false break higher, because again, the neural index strength is not overly bullish here.
We’ve got a green neural index, but when you look internally inside that neural index strength, it’s not overly strong here, so again, biased for the weak for gold still at this time is slightly to the downside.
Bitcoin
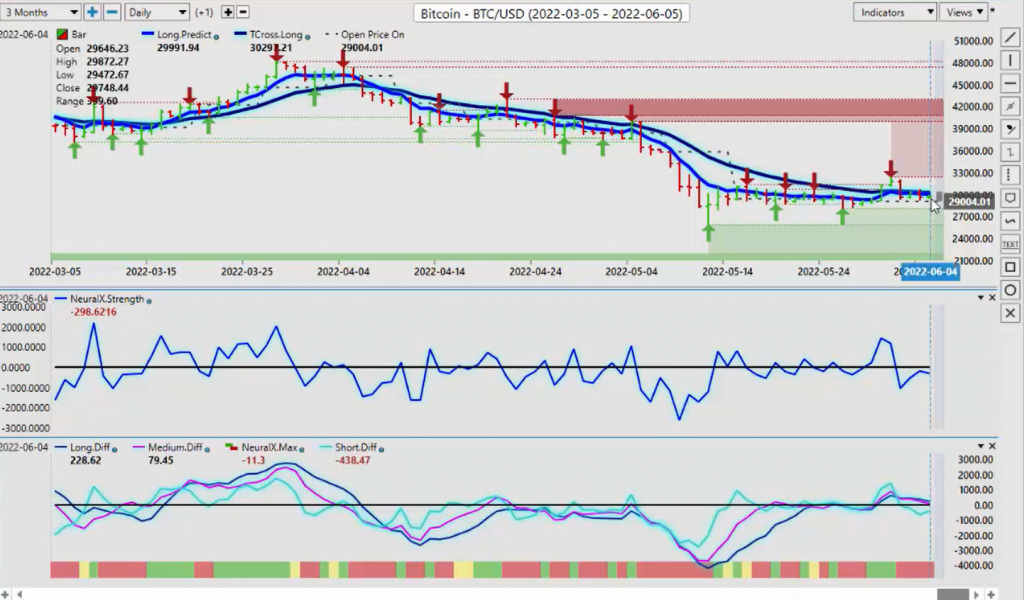
Now, when we look at Bitcoin, once again, people getting, again, a little too caught up in this short-term trading here. Bitcoin is down, but again, each week I will show this because again, Bitcoin was down last year at the same time also. It was around mid-July when it started to turn around. That’s a known seasonality. One of my other favorites is mid-September to early November is another strong seasonality in Bitcoin.
When we take that longer term view and say, “Okay, well, when stocks move lower, people buy them, right?,” so one could make the same argument here for Bitcoin that it’s down and we’re about a month away from a potential rally here. Once again, we’ve got heavy resistance with the Vantage Point T cross long 30,297.
S&P 500 Index
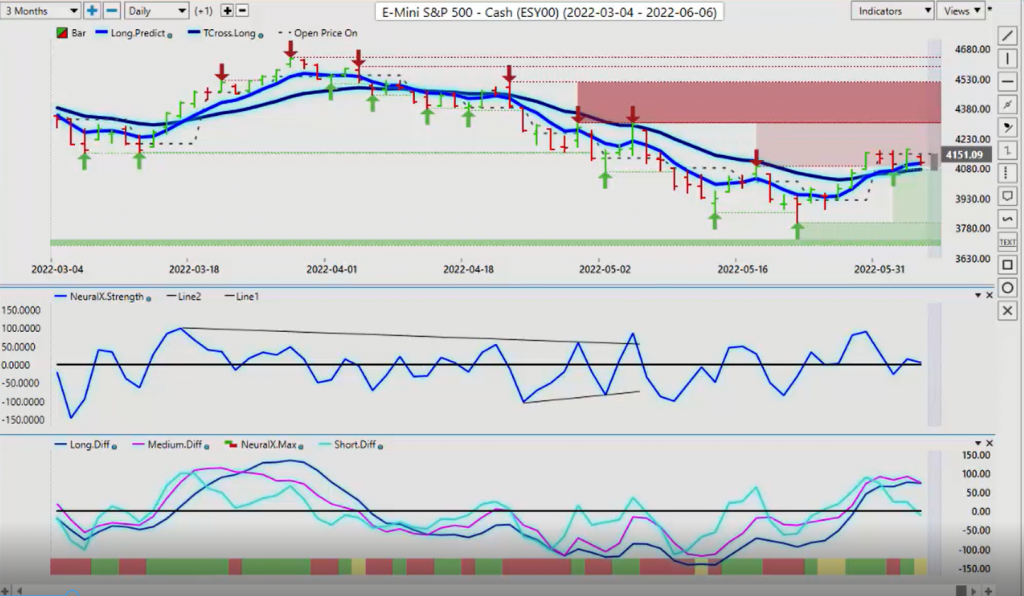
We’ve got to break free and clear of that, but I think it’s unlikely that that’s going to happen unless we can get the S&P 500 moving higher. Now, once again, the S&P 500 is just one way of gauging the global stock markets, more specifically the U.S. markets, but the other markets tend to follow. When we look at the S&P 500 here, we can see that it was almost this very second on CNBC when they called and said, “We’ve officially entered into a bear market.”
I think we were down here somewhere. Literally, the very next day, this thing turned around. It’s somewhat comical, right? Again, always make sure you take anything you hear on TV with a grain of salt. We need confirmation of that.
Once again, the S&P has turned around and I believe that’s why Bitcoin is stalling, and it’s not going any lower because the S&P 500 is not doing that. The equity markets have turned around to some degree. Now, unfortunately, when we look at this right now, we do have an MA diff cross that is trying to cross to the downside, warning of pending equity weakness coming yet again, but once again, we must break through our T cross long, so when we look at this, again, because this is an outlook, not a recap of something happened that’s already happened here, this is a good example of how to use the Vantage Point predicted low and combine it with our T cross long, right? Basically, we’ve got 4074.69 is that level. We agree, right?
Then, we look at the Vantage Point predicted low, and that’s at about the same level, guys, so if we were going to go long and stay with the long signal, then that would tell me that that’s where the place we would do that, so again, this is being done. As you can see on Sunday afternoon at 2:13 PM, the markets are closed, so once again, this is something we would monitor very closely, but longs are very, very risky. There’s no question about it, but if you are so inclined to take it, that’s what the level you would watch to begin the week.
Crude Oil
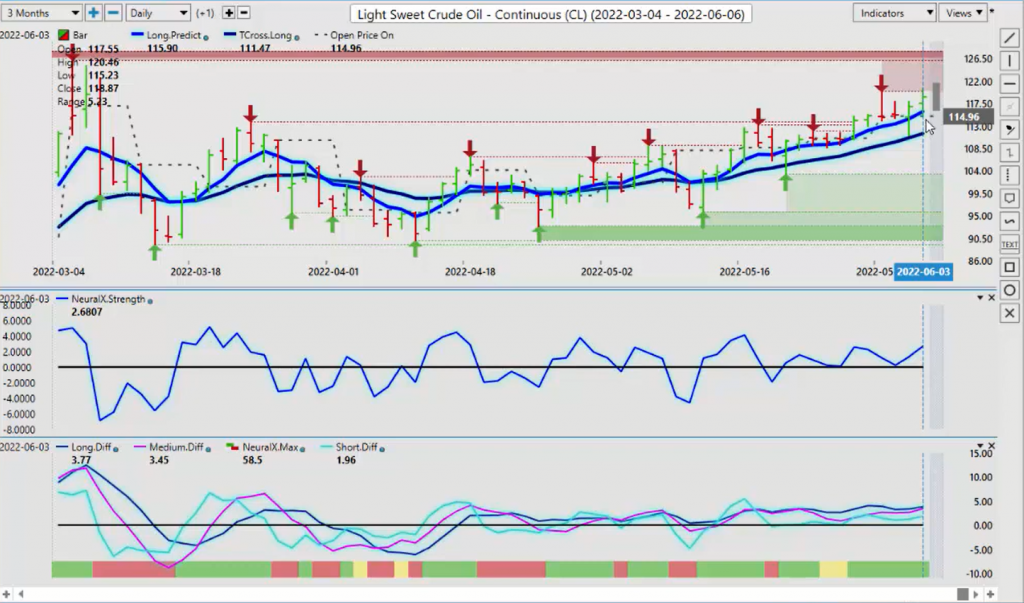
Now, when we look at oil prices, guys, I don’t even know what to say about this. All I can say is be prepared to get hit at the pump yet again.
When I looked at it, I’ve talked about this over the last couple of weeks, it’s crazy. Now, I think you have a hurricane coming in, so that’s probably going to put oil prices up yet again, but what we want to look at, again, when we’re using the methodology that I’ve discussed in these videos, usually while the markets are closed, I might add, then once again, when we look at that T cross long, you can see that the market came all the way down to this level, hit the Vantage Point T cross long, and this was on Thursday that that actually took place. Most traders, in my respectful opinion, this is where they’re getting stopped out, is again, maybe near the Vantage Point predicted low because they’re doing it on a day trading basis, so when we take a slightly longer term view of this and we implement the T cross long, then we can see this level, 110.55. All stops should be below that level, guys. Anywhere in between there is basically a sucker’s bet.
There is no Fibonacci here, there’s no Wave’s, there’s no voodoo of any kind around this level, just a predicted moving average, so it’s come down, kissed it to the number, and then rallied off that low of 111.20, all the way up to 122 on Friday, so this is how you would look. Again, the purpose of these videos is to provide alternative strategies to use with your Vantage Point software. A lot of people just look at the predicted high and predicted low, and nothing else. They may look at a medium-term crossover, and nothing else. It’s good to look at a combination of quality, not quantity of indicators.
Very, very important, guys, okay? Once again, we can see that oil is still strong, and I suspect it will remain strong going into for at least the next couple of weeks.
Euro versus U.S. Dollar
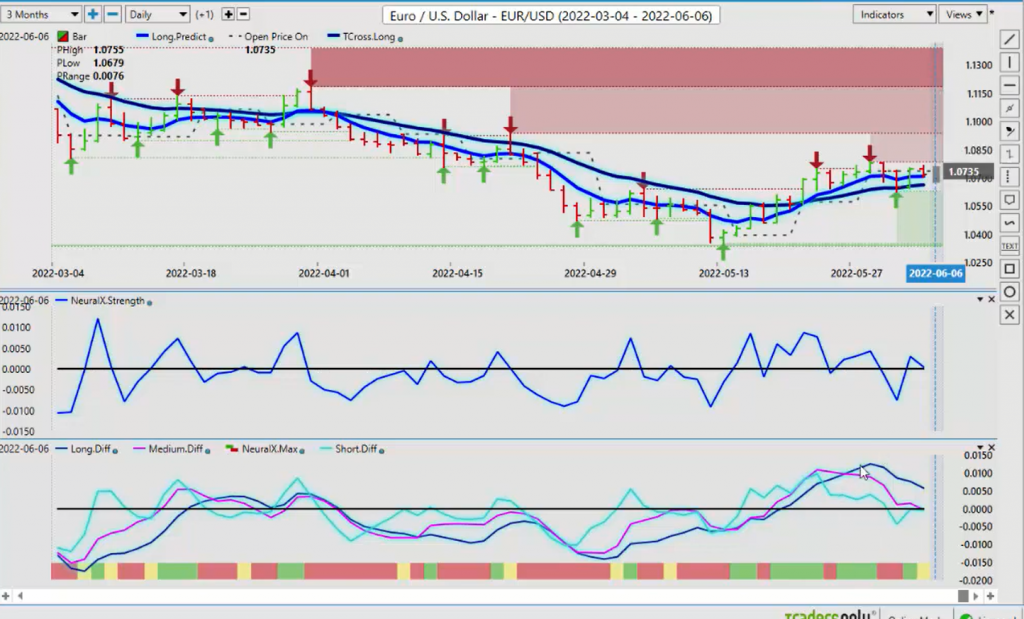
Now, when we look at the Euro-U.S. currency pair, once again, this is the way we would look at this. Going into next week, we’ve got our T cross long at 1.0661. 1.0661, yes, that’s correct, so we would look to be buyers down around that particular level. If we look at the Vantage Point predicted low, it’s at 106.79, so that’s not too bad, but we do have an MA diff cross and we did have a significant pullback on Wednesday down here, but until these predicted differences move below the zero line, then there’s still hope that the Euro could move higher here on further dollar weakness.
This past week, we did this in the VantagePoint live training room, and I’ll show it again here. Two days in a row, guys. Again, all I’m trying to do is get your attention off of the predicted high and predicted low for one single day and properly identify what the actual current trend is. Clearly, it’s up, right? So while it’s up, it’s up as long as it’s above that T cross long, 1.0655. It’s we need to close below that for two days in a row for that to change, so when it comes down to this particular level, in most cases, I’m not even looking at the VP predicted high and predicted low.
I’m watching the T cross long, and that’s the level, or the long predicted where I’m looking to enter into these particular trade because it maximizes profit and it minimizes the amount of stop that I actually need. I would usually use about at least 50 to 80 pips below the T cross long. Despite what the media’s saying and everything else, the Euro is holding its ground. Most pundits had said the Euro is supposed to be below parody right now. Once again, the second they said that, the Euro in a blink of an eye was all the way up to 108 almost, so the main thing is study the charts.
Implement a strategy that’s easy to replicate. I believe this to be relatively easy to replicate, what I’m saying, and again, it’s a free website and it’s only here to provide additional strategies for the average traders, so for next week, it’s easy-peasy, 1.0661, as long as we … If you disagree with everything I’m saying here, that’s fine. Then, you could say, “Okay, well, if he’s saying that this level is so important, why don’t I put a limit order just below there?” Now, somebody could say, “I don’t want to go long Euro-U.S..”
Okay, I respect that. Then, you can put your limit order down below the verified support zone. That low is coming in in about 1.0627. The savvy trader could now put a sell limit order, say 1.0595, so again, just an alternative way to look at the software. Now, the U.S.-Swiss Franc for next week, it’s back and forth, but once again, we are starting to build some support down here, but even though we’ve got this crossover, the one thing we always have to remember here is the carry trades back on, guys, right?
U.S. Dollar versus Swiss Franc
The interest rate differential between the U.S. dollar and the Swiss Franc clearly favors the U.S. dollar going forward. I’m also of the opinion that this fed’s got it wrong, and by September, October, they very well may have to pivot on their interest rate stance, but for now, these interest rates do favor the dollar, so shorts are risky, even though a number of indicators point to that, but we’ve got our MA diff cross and it’s the same deal here, guys. We must clear the T cross long. That level for next week is 0.9673. The market could completely ignore the carry trade, the interest rate differentials that I’ve mentioned and still look to buy Swiss Franc.
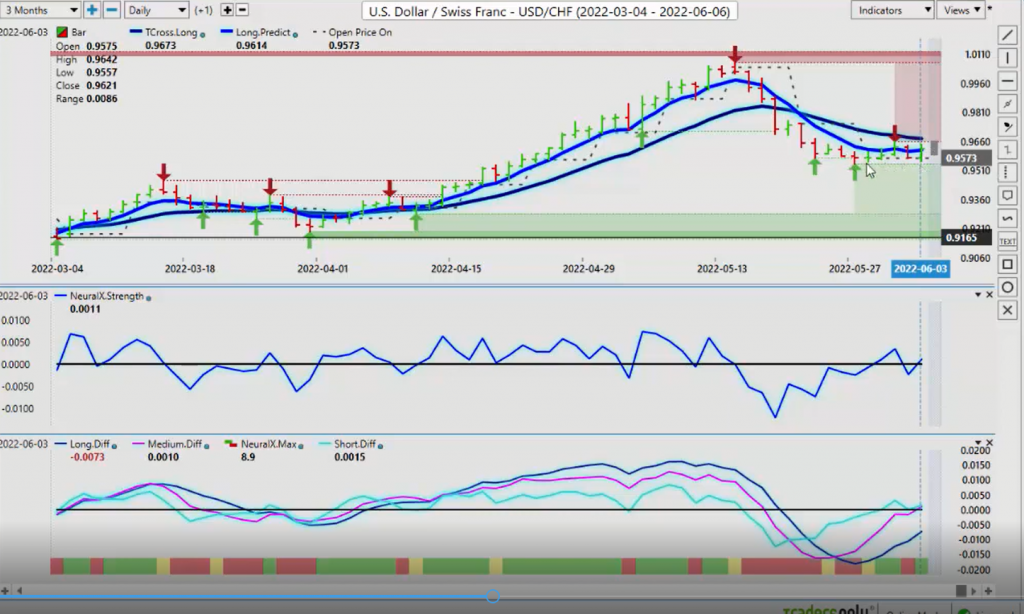
It’s a safe haven currency, right? For now, it is still down, but again, watch this level of 0.9673 very closely.
British Pound versus U.S. Dollar
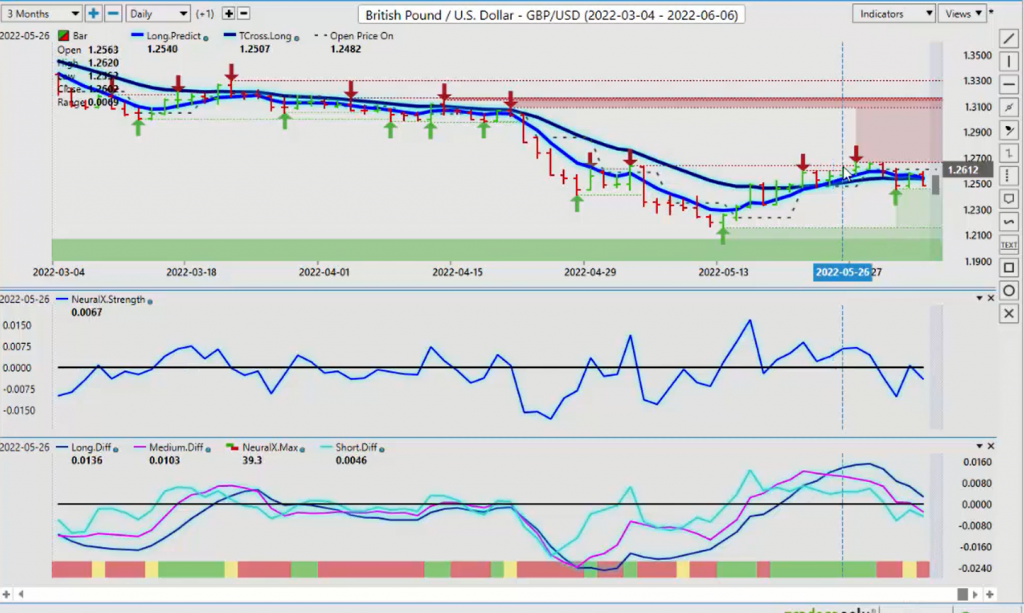
The British Pound for next week, this pair, we’ve got a lot of people that want to buy this thing, including me, but we’re just cannot seem to get any traction on longs here and it looks like it’s rolling over yet again. In this particular scenario, we’ve got our MA diff cross that has taken place well back over here, and then you can see how the market just gradually rolls over, so we’ve only closed …. Again, I’m looking for two consecutive days.
We closed below the T cross long here only to turn around the very next day, then we’re closing down again, but this is being influenced by that non-farm payroll number, so once again, I think the non-farm payroll number was pretty decent out of the U.S.. It wasn’t really great and it wasn’t really bad. It was a pretty well-rounded report, but I’ve seen much, much better reports and the dollar still sold off after real dollar demand was no longer needed. Again, we will watch it very closely, but again, our T cross long, 1.2536. Then, the theory here is, again, we would then and only then would we look at the Vantage Point predicted high and predicted low and match it to the number on the T cross long.
We’ve got 1.2536. The Vantage Point high predicted high is 1.2557, so we know the exact level, the pinpoint for a potential short here. Our neural index is down, our neural index strength is down, and we’ve closed below that T cross long, so there does appear to be a short, but if we break above this verified high of 1.2666, then you want to get those shorts off the table very quickly.
U.S. Dollar versus Japanese Yen
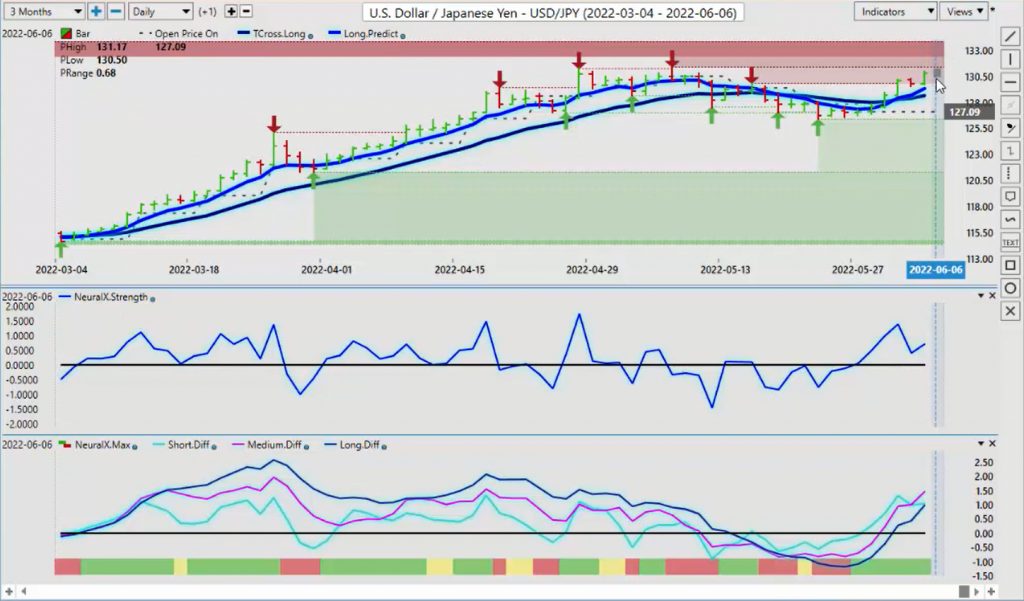
Now, with the Dollar-Yen, one of the few areas last week, where the dollar actually made some gains was against the Dollar-Yen, but at these lofty levels, once again, be very, very cautious here. We do have a brand new buy signal yet again at the 130 level, so when we look at this right now, long predicted is a support level, 129.32, T cross long, 128.64 is a support level, but our predicted high … This is very important, what I’m going to say here.
The predicted high is 130.50. I would respectfully submit that I personally, in my trading, would not even look at a long trade until I get down to either 129.32 at the very minimum or the 128.64. This is, again, just a way of demonstrating to everybody, that if you’re using the predicted high and predicted low as your main tool in your trading, you need to match it to these levels that I’m giving you that you have in your software because if you don’t, then there could be a significant gap that needs to be filled, and again, only in my respectful opinion, this is where people get stopped out on these gaps, so your main focus will be down at the very minimum. 129.32 is the very minimum you would look to enter this particular trade on the long side, and shorts are absolutely supported on a break below the verified low at 126.36.
U.S. Dollar versus Canadian Dollar
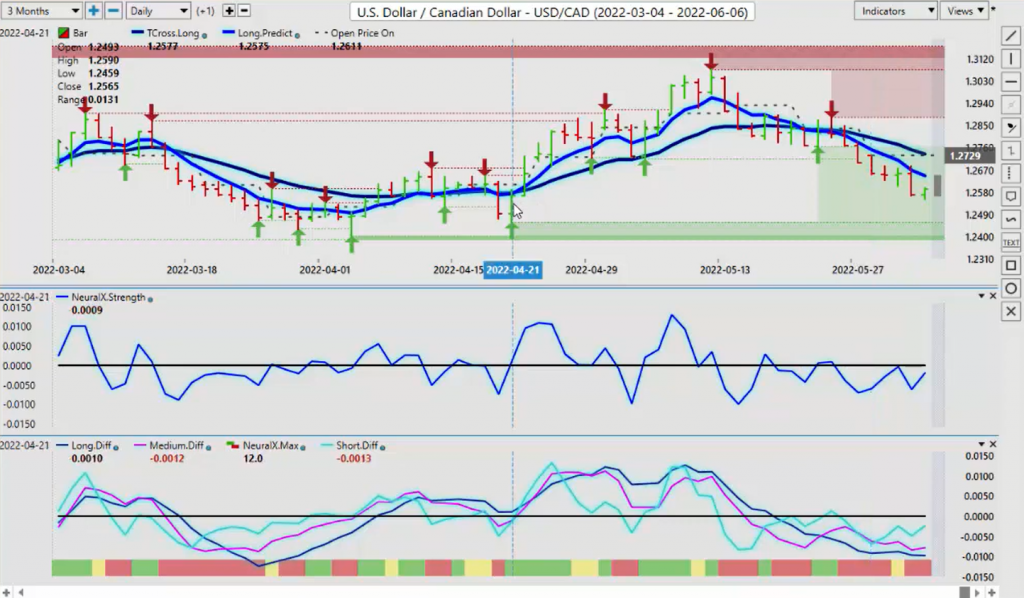
U.S.-Canada, once again, this has been a real mover, I’ll tell you. The U.S.-Canadian pair has a pretty strong seasonality to the downside in June and July for summer driving season, the fact that I’m shocked that U.S.-Canada is even this high with oil prices the way they are, and now you have a hurricane coming in, so I would anticipate that U.S.Canada is going to see some more downside this week.
I believe that our lower end target of the verified low of 1.2459 is absolutely within reach if these oil prices continue to scream higher. Once again, when we look at this for next week, our long predicted is 1.2648. Our T cross long however, is 1.2734, so you’ve got a significant gap. You’ve got your Vantage Point predicted high at 1.2646. I’m okay with 1.2646 as long as you’re comfortable with getting your stop above the T cross long at 1.2734 because once again, this is where I’m seeing most people getting hit, is in this zone.
Australian Dollar versus U.S. Dollar
When this gap is being filled, they’re actually getting stopped out in here. That’s not what you want, guys, okay? You want to combine the two strongest predicted moving averages in the software, in my respectful opinion only, okay, so when you match them right now, that predicted high and the Vantage Point long predicted, they match, so that is your first potential entry point in this area around 1.2648. Moving on to the Kiwi and the Aussie, they’re very, very similar trade, as I’ve mentioned many, many times here. They’re looking better here for longs.
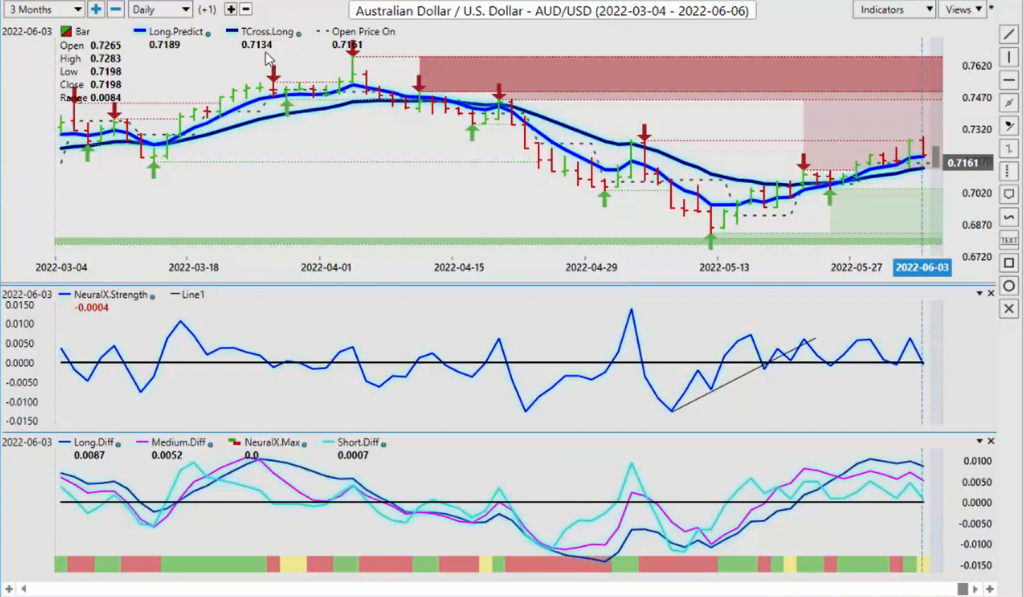
I would like to see gold prices moving up a little bit to help the Aussie and the New Zealand out here, but again, setting up a trading plan to begin the week for a weekly strategy, okay? Remember, the predicted high and predicted low, that’s a daily strategy. I’m talking weekly, and then we bring the daily strategy inside the weekly setup, right? That’s why I don’t do a Vantage Point daily weekly outlook, I do a weekly outlook, to try and move away from this heavy short-term trading. High frequency, high leveraging trade doesn’t work in my respectable opinion.
Doing it a little bit does, but not frequently. Be very careful with that. Right now, our T cross long, 0.7134, so longs are still favored down to that area. Once again, this is an excellent way of showcasing the predicted low, combining it with the T cross long, so once again, to highlight this, there’s your T cross long. It’s this blue line right here that’s clearly identified, and we’ve got our predicted low coming in at exactly the same area, so if I go over here, go like this, well, that’s easy-peasy, right?
Within seconds, we know exactly what our strategy is. We’re looking to buy down at the 71. Down around that predicted low is acceptable to me. It’s 0.7143, and our T cross long is 0.7134, so that pinpoints an exact area. If it doesn’t come down there, then so be it, but I know that it’s the safer area.
Let them fill the gap to the downside and be waiting there to take that trade. I would further submit the same thing applies to the Kiwi.
New Zealand Dollar versus U.S. Dollar
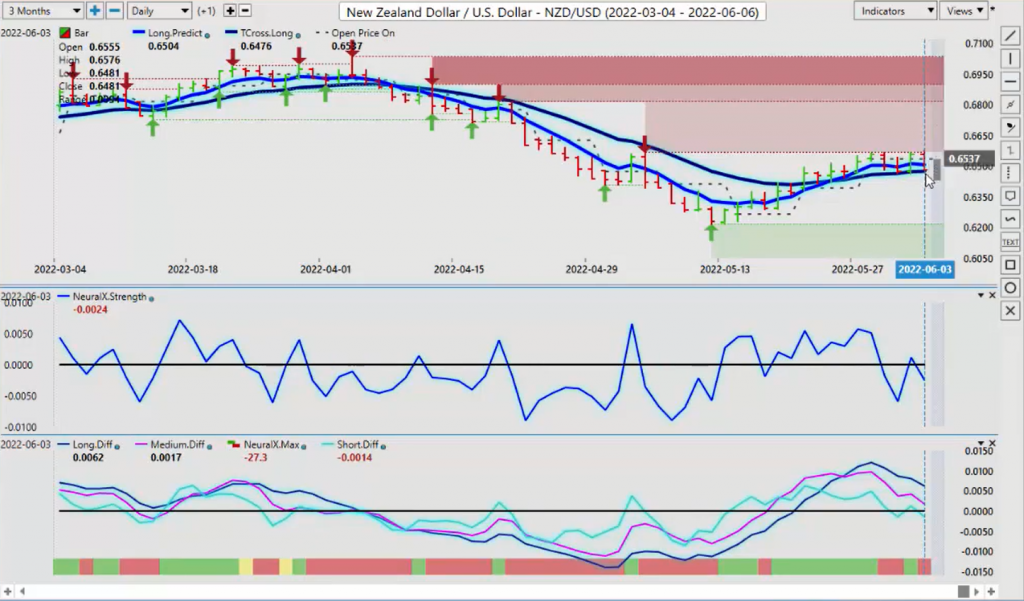
Maybe even better. Maybe the Kiwi doesn’t move lower at all, because right now, we’re sitting on that VP T cross long at 0.6476, so if the equity markets get a little bit of a bounce, we should see something, but here’s the way you would look at this, guys. This is last week.
This isn’t a one single trade. There’s a long trade there, a long trade there, and potentially a long one there, so the Vantage Point predicted high is a secondary tool, not the initial one, right? We need to identify, is it trending up or is it trending down? Are we above or below the Vantage Point T cross long? What do the additional core indicators say?
Well, it’s still pointing down, so it looks like between the Aussie-U.S. and New Zealand-U.S., I think that this would tell me that the Aussie would be the better trade because there’s a gap that needs to be filled in the Aussie, but not in the Kiwi. These are the kind of strategies that we look for so it’s less stressful in our trading. With that said, this is the Vantage Point AI Market Outlook for the week of June the 6th, 2022.


