


Welcome to the Artificial Intelligence Outlook for Forex trading.
VIDEO TRANSCRIPT
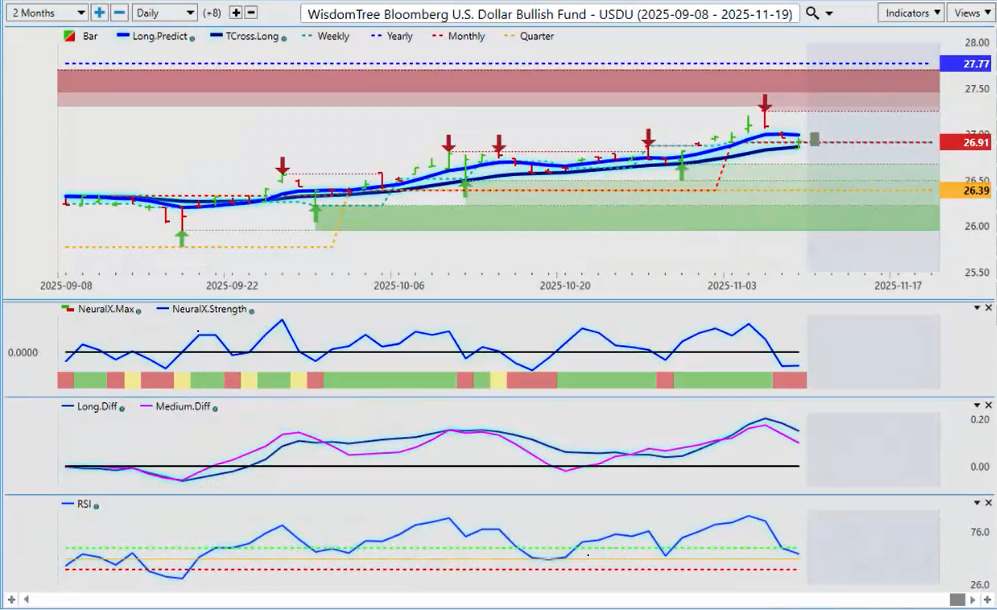
U.S. Dollar Index ($UUP / USDU)
Okay, hello everyone and welcome back.
My name is Greg Firman and this is the Vantage Point AI market outlook for the week of November the 10th, 2025. Now, to get started this week, we’ll begin where we always do, with that very, very important US dollar ETF fund. The USDU is the one I’m going to be using this week. Now, the dollar is under pressure here to end the week. We started failing up here on Wednesday. We’ve come back, a full retracement, to the Vantage Point T-Cross Long, that area coming in at 26.86. That’s the level that needs to hold.
Now, the predicted neural index is starting to flatten out here, but it’s still very much negative. Our MA Diff Cross and our long-term cross both still pointing down. Predicted RSI is showing that we don’t have downward momentum, however, just yet. So again, if that RSI can break below the 40 level, we could see a bigger break to the downside.
But the key levels we want to watch for next week are the monthly opening at 26.89. We’ve got our quarterly opening down at 26.39. So 26.91, 26.31, and of course, we’ve got to keep a close eye on whether we’re holding below the current calendar yearly opening price at 27.07.
So again, not a trend reversal just yet on the dollar, but if we do break down below that T-Cross Long, very likely the dollar will come under additional pressure.
GOLD
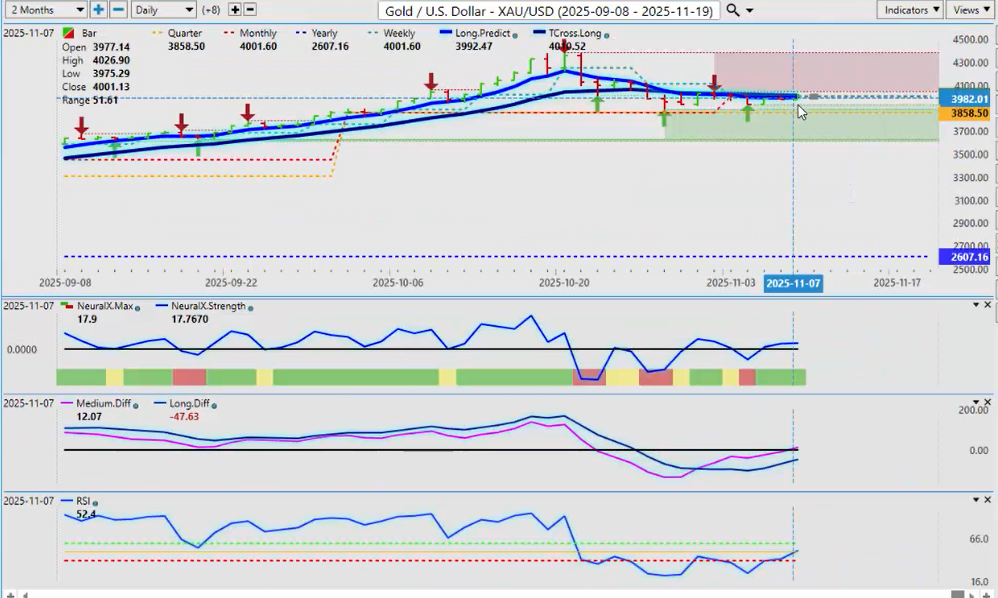
Now with that said, gold is rising. The difference here: the dollar has predominantly been negative on the calendar year, where gold has been positive the entire calendar year. That opening price 3607 holding above that critical area. But we’ve got to get above this T-Cross Long here guys. That is the key level that I will point out here.
Now, if we can get and break above that level, and again, I will highlight that so everybody can see it, 4010.52. That’s the level we need to break above. The indicators in VP are definitely pointing gold higher next week.
But in my respectful opinion, either way gold goes higher in December. But for now, the indicators are turning positive. We just need to break through and stay above 4010. If we can do that, gold will likely return very quickly in the weeks ahead back up to its most recent high at 4381.
SPY
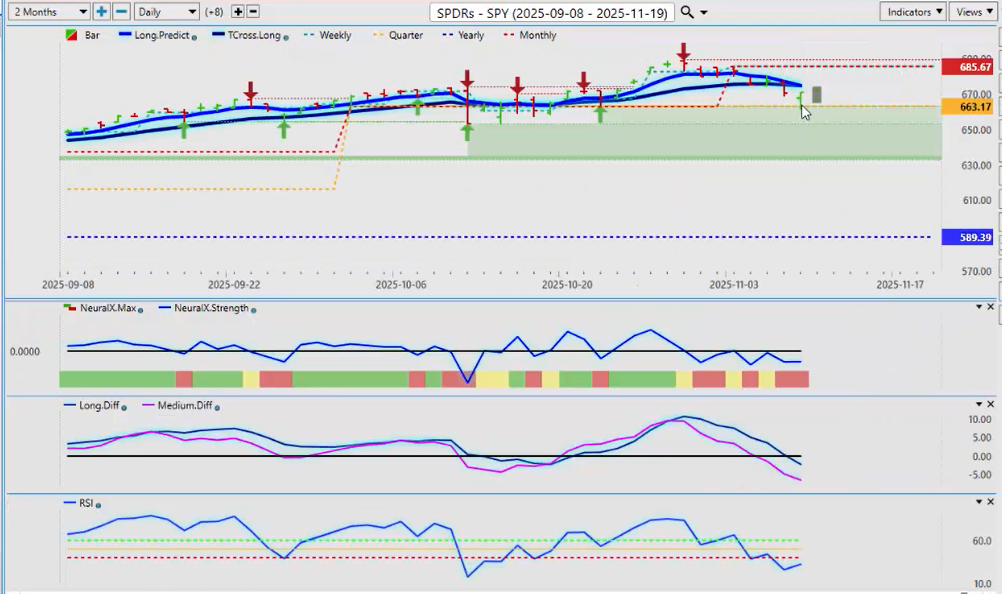
Now, for the equity markets for next week, well, they’re in a little bit of trouble. But the good news is the quarterly opening price on the spies 663.17. That’s the key level that we need to watch. Can we hold above that? Because right now, that is the only support, real database support, that is holding the equities up.
We have a medium-term crossover, a long-term crossover, but our neural index strength is flat. And the predicted RSI has that classic reverse check mark here suggesting that no, maybe this is still corrective in nature.
But that’s the level I would keep an eye on. Can we get back up above 663 and stay above that area? And can we get that RSI moving back up above that 50 level confirming this? So again, by midweek, I’ll be watching to see if I can get an MA Diff Cross, the pink line crossing back over the blue line to the upside.
Volatility Index ($VIX)
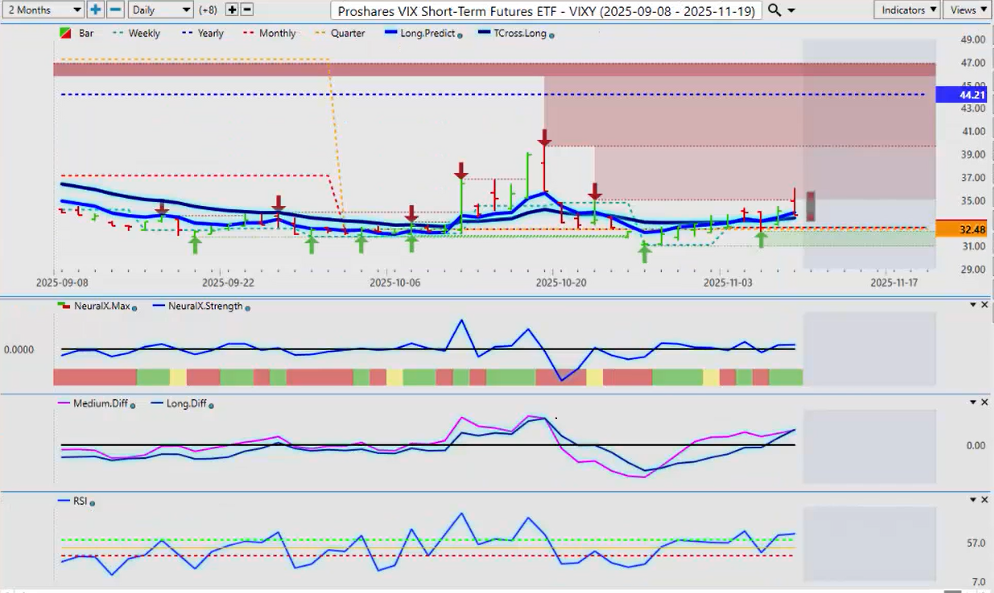
But again, to really check it properly, we would want to look at the VIX. Now, the VIX is primarily negative on the year, 44.21, but we have been positive this entire week. Now, that quarterly opening price here is critical, in my respectful opinion. 32.48. We’ve got 33.44 on the T-Cross Long. So very, very strong support down here for now.
But if that VIX does hold above this level, then that would tell me the equity markets could be running in a little bit of trouble this week.
DAX
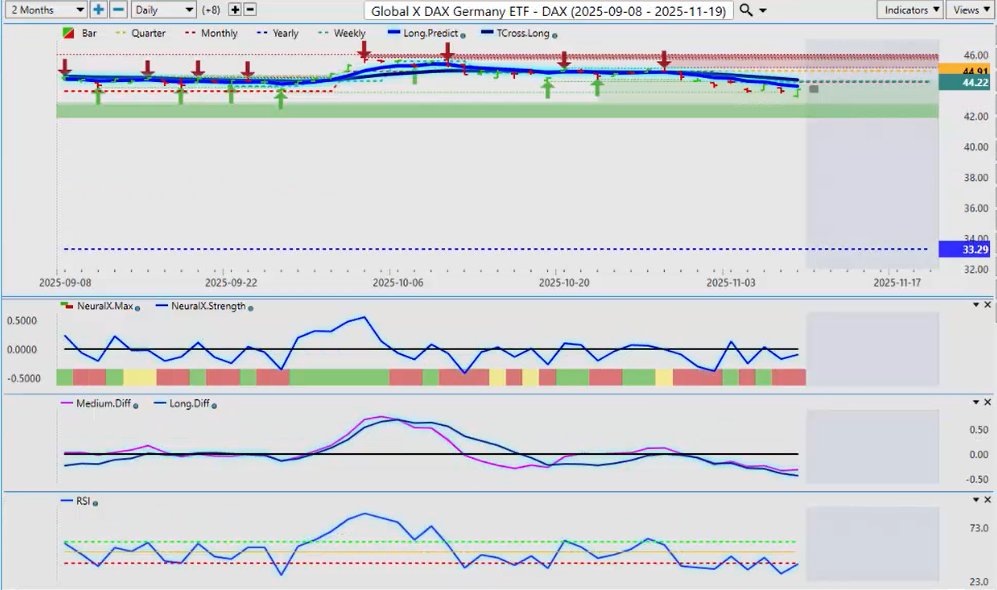
Looking at the German equity markets, again, the VIX confirming the DAX pushing lower, but again guys, this is a corrective move. The DAX ETF grossly positive on the year, 33.29. And remember, the DAX has about a 90% correlation, positive correlation, to the S&P, the NASDAQ, the Russell, the Dow, etc.
So, if those turn around, so will the DAX. So, keep an eye on your major indices to see what they’re doing. But for now, the picture is actually starting to look somewhat bullish, which could be a leading indicator, right? The MA Diff Cross, the pink line over the blue line.
So, if nothing else, I anticipate we will retrace back to 44.35 this coming week.
Bitcoin
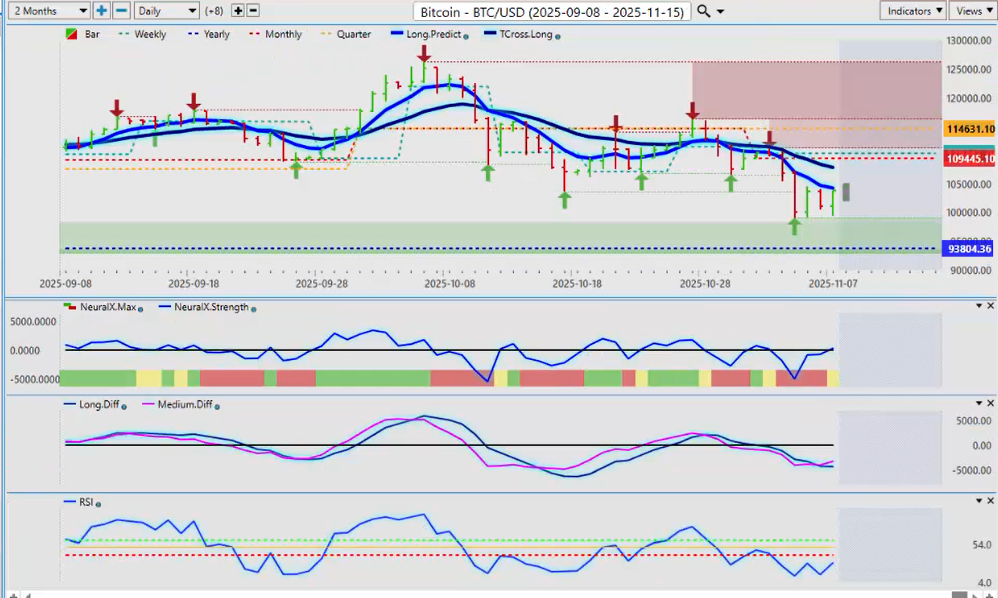
Now, with Bitcoin, Bitcoin continues to stabilize here. We did briefly, I think, get just below the 100,000 mark, that psychological level. But the key level you guys want to keep your eye on is 93,804. That’s the yearly opening price.
And again, I think sometimes we forget how to measure a real trend. Are we positive or are we negative on the year? So, even with the selloff on Bitcoin, it is always good to come back and look and say, well wait a minute, the equities are still—or excuse me, the Bitcoin is still up 10% on the year. So, not exactly bearish here, guys.
In my respectful opinion only, if I turn negative on the year, then it would be time to call Bitcoin into a bear market, but I don’t think we’re there just yet. The indicators are turning positive. I’ve got an MA Diff Cross, the pink line over the blue line. That suggests, if nothing else here, we’re going to retrace back up to that very important T-Cross Long at 107,810.
So again, the indicators in VP are actually turning bullish yet again on Bitcoin.
Light Sweet Crude Oil ($USO)
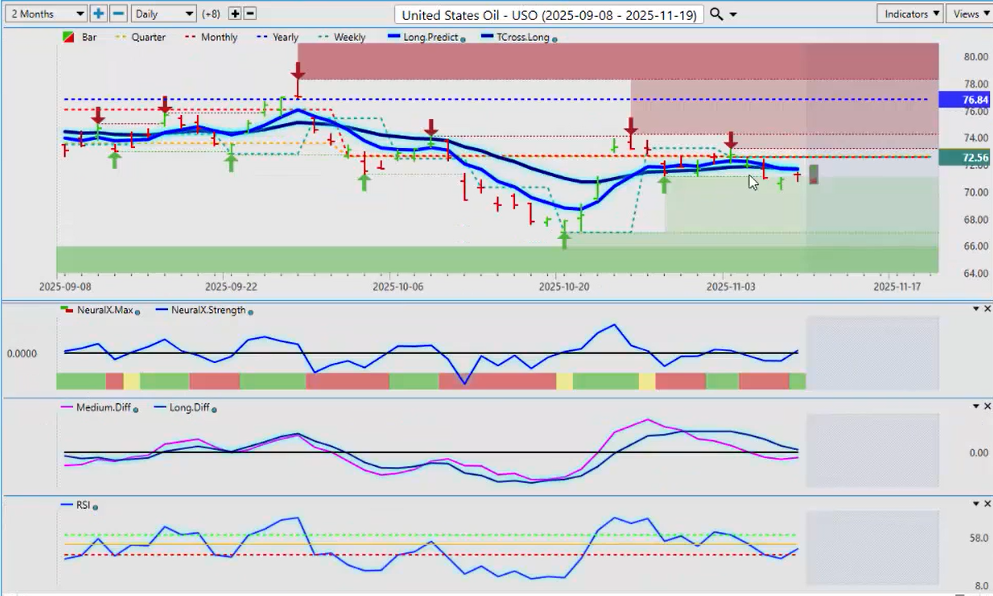
Now looking at light sweet crude oil, the final commodity we’ll look at before we get into some forex pairs. Once again, there is a little bit of life in oil here. But again, I think little is the key word. I don’t anticipate any big rallies in the oil markets until we get closer to the, you know, into the past February, March. I think oil will basically trade sideways right now between the quarterly opening price and the yearly opening price, but that quarterly opening has proven to be a very tough nut to crack.
We tried to break above it back up here in the third week of October only to move lower again. We come back up, retrace to that area in the first part of November, and then we’re down again. So keep an eye again on the quarterly opening 72.65 and of course our T-Cross Long 71.69. We would need a clean break of these levels in order to be more hawkish or bullish on this particular commodity. But for now, I think we have a little bit of upside coming next week but probably not a lot.”
Euro versus U.S. Dollar ($EUR/USD)
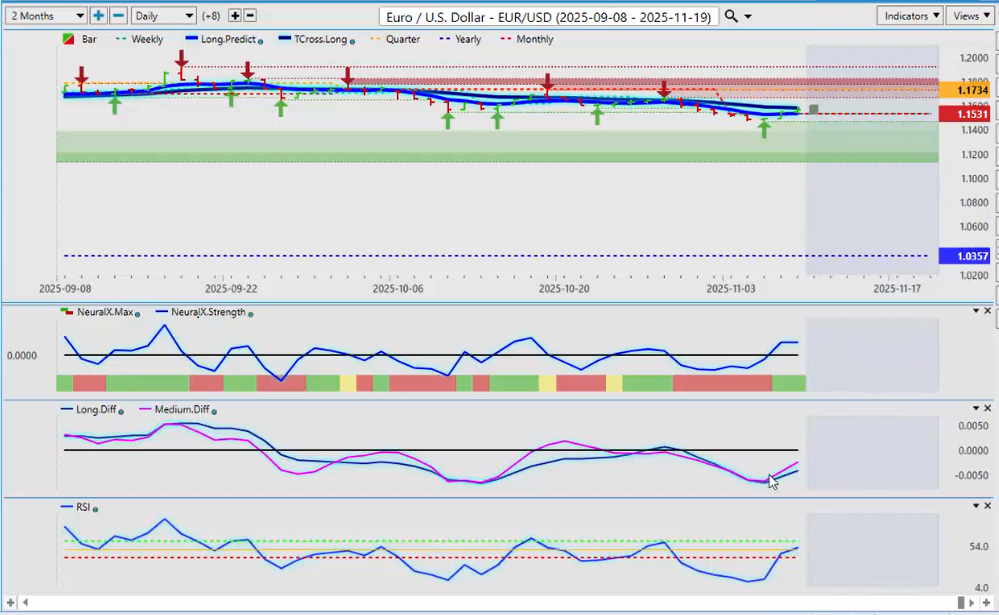
Now when we look at the euro, once again the euro started to turn here at basically near the end of the week. We had an MA Diff Cross. What I would like to see with the predicted RSI is a sustained break of the 60 level. I do have an MA Diff Cross that looks quite good here. But again, that’s corrective in nature until such time that I can break through 1.1579.
I think the bulk of your activity next week is going to be around this area. The bulls and the bears are going to fight it out right at 1.1579. So, if we can close above it two days in a row and stay above it, then the euro has some upside potential. And I believe that that is possible going into December. We just have to get through November first.
But for now, it’s mildly bullish is the way I would put it. But I will again point out how to identify a real trend here, guys. Not a media trend, but an actual trend. What is the euro’s performance in 2025 currently? Well, as you can see, it’s up 11.26%, which is very comparable at the current time to Bitcoin. So there’s a little bit of a positive correlation between the EUR/USD and Bitcoin, and I believe that’s where the U.S. dollar is in play with the intermarket correlations.
So again, we need proper anchor points in our trading. We can’t guess at what the performance is. We can’t randomly move performance points at the in the middle of the month. We need to know exactly what the euro has done this year, and that’s what it’s done. It’s actually having its best year in a long time. So, if you’re buying the euro, you are staying with the primary trend, I would argue. And going into the year end, I do anticipate the euro can rally further, but that will be dependent on the Fed and whether he is going to cut or whether he’s going to hold. And more specifically, what is he doing with the dot chart plan? Is he going to be cutting more in 2026?
I think we’re going to have to wait till the latter part of November and December to get those answers. But for now, the euro is slightly bullish.
U.S. Dollar versus Swiss Franc ($USD/CHF)
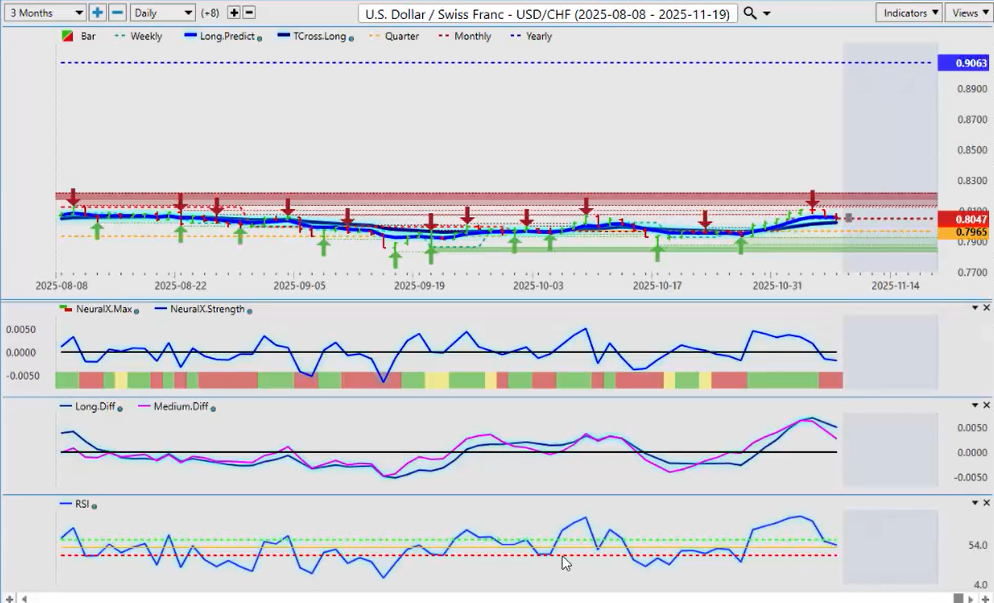
Now, the US Swiss Franc, once again very highly correlated to the dollar index. And as you can see, yet another warning sign of pending dollar weakness. The MA Diff Cross. We’re sitting on our T-Cross Long here. That level coming in at 0.8021. If we break down below that, we’ll come down to the quarterly opening price very quickly. But if we break down below the 40 on the predicted RSI, that tells me momentum’s building.
Now, another way we could interpret this is that stocks are in trouble. And because again, if they’re buying stocks, they’re not buying the Swiss Franc or the Japanese Yen. That’s what weakens those two currencies. So, this is saying the USD/CHF potentially could be getting ready to move lower.
But again, if we measure that performance of where we’re currently at, this currency pair, the Swiss Franc, has done very well against the dollar all year. And you can see that on a percentage basis, it actually mirrors inversely to the EUR/USD pair. So right now for next week, definitely a bearish bias on this particular pair.
British Pound versus U.S. Dollar ($GBP/USD)
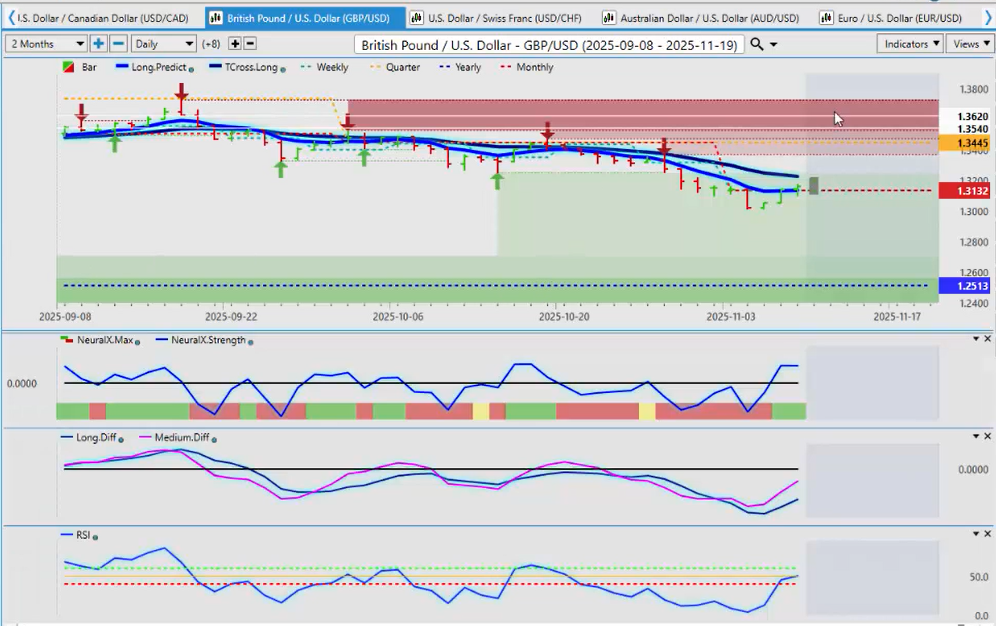
The British Pound / US Dollar. Not a lot of love for this currency is all I can tell you. But we are starting to base out a bit here. So for educational purposes only, I can put this on here and identify a low point and say, okay, 1.310. I’ve got some support rounding out here. I do have a bullish signal from VantagePoint with the MA Diff. The predicted RSI is rising. I am slightly, ever so slightly, above the 50 level.
Well, not exactly super bullish here, but it is warning that again we could be getting ready to move higher on broader U.S. dollar weakness. So I’m looking for that dollar weakness by Wednesday, Tuesday, Wednesday of next week. And again, this is an outlook, not a recap of something that’s already taken place. We’re looking forward in anticipation of what’s going to happen, not looking backwards at what’s already taken place.
So, this is warning that the GBP/USD has further room to correct back to the T-Cross Long at 1.3226.
U.S. Dollar versus Japanese Yen ($USD/JPY)
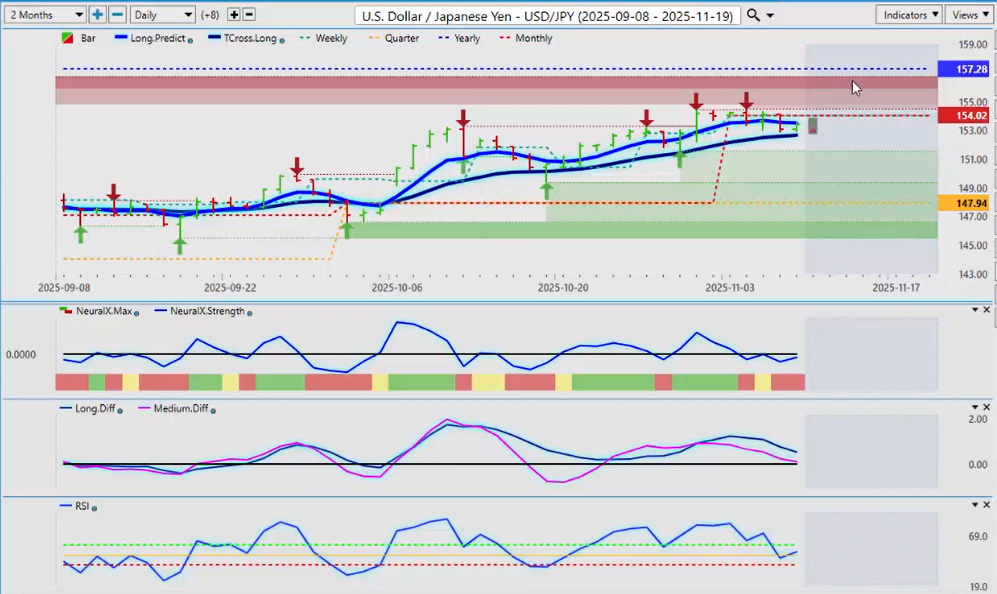
Now with the Dollar Yen, I don’t usually advise trading this pair heavily because it literally is all over the map with the carry trade and what is the Fed doing, what is the Bank of Japan doing. So for now, that T-Cross Long, 152.68, that is the key level for next week.
Can we hold above that particular level?
If we can, then we break back up above the monthly opening price. But as you can see, there’s very little buyers around this 154 area. Now, there is a slight bias to the downside, but interest rates reign supreme. The equity markets reign supreme.
So, what that means is: if the stock market turns around and goes higher, USD/JPY goes higher. If the S&P 500, the DAX, all of these global indices sell off, then the USD/JPY is likely going lower on Swiss Franc and Japanese Yen strength.
So keep that in the back of your mind if you’re trading this pair.
U.S. Dollar versus Canadian Dollar ($USD/CAD)
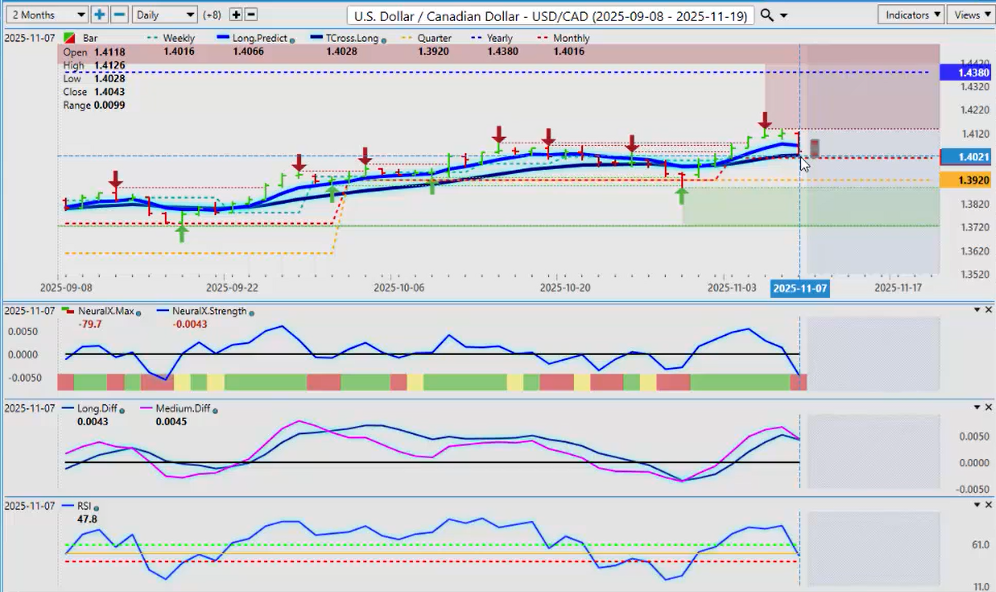
Now it appears the Canadian Dollar is benefiting somewhat from the budget that was released by the new party in Canada or the old new party, whatever you want to call them. Not really much of a budget there to be perfectly honest. I’m not sure how the market is going to continue to react to it, but currently they viewed it as possible because there is a budget—even though it’s not a great budget, it’s a budget.
So the Canadian Dollar may settle down, possibly even strengthen a little bit, but that budget that’s come out and is likely going to pass in November is not going to fix any of the structural issues that have been going on for 10 years under this current Liberal government.
So, I’m not sure where we go from here. First of all, we’ve got to get that budget passed. We’ve got to get some positive stuff around the Canadian economy. We do have a little bit better jobs number, but unfortunately, they’re all part-time jobs, guys. The 60,000 new jobs in a month, but they’re part-time.
So we need more full-time jobs. We need a trade deal with the U.S. So, it’s still a negative against the Canadian Dollar for now. So again, the quarterly opening is 1.3920. The only way the Canadian Dollar can strengthen is if the U.S. dollar weakens across the board.
But again, we have to see if this budget is going to pass for sure and how private businesses are going to react to this.
Right now, the indicators are saying the USD/CAD can move lower, but we’ve got to break through the T-Cross Long and stay below it at 1.4028.
Australian Dollar versus U.S. Dollar ($AUD/USD)
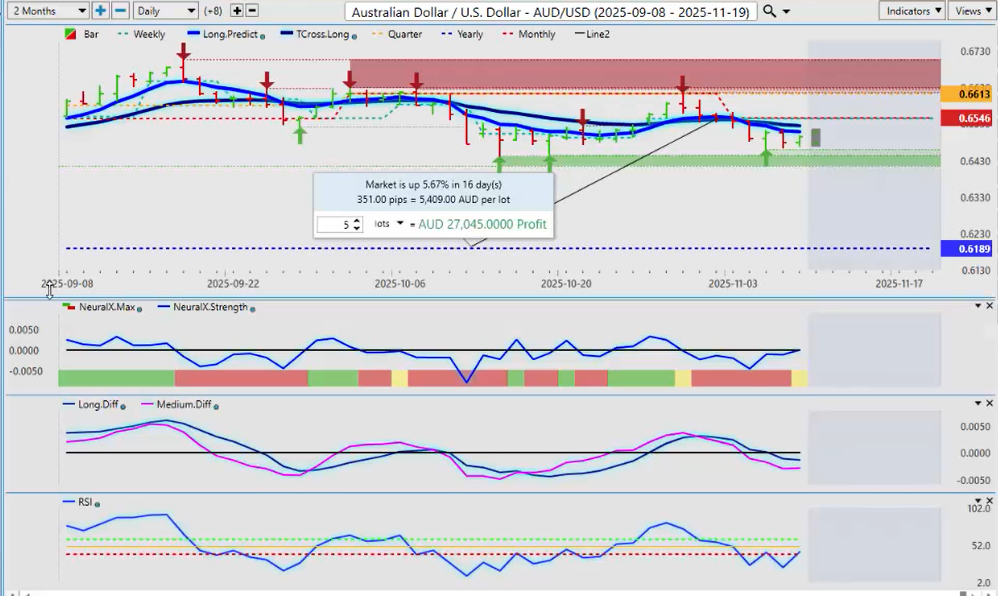
Now as again, the Canadian Dollar not having much of a year—the yearly opening price at 1.4380—and here we are near the end of the year. You can see this thing over a 9-month period and it really isn’t pretty. It’s a nasty fall going all the way back into February of this year.
So, we’re slowly climbing right back up to where we were. Want to be careful with this pair. A lot of headlines are going to be released next week.
But for now, there is a little bit of strength in the Canadian Dollar. And if there is strength in the Canadian Dollar, in most cases, there’s strength in the Aussie and the Kiwi. The three currencies very highly correlated.
So we have a new verified support low 0.6459, but the Aussie is very susceptible to the equity market. So if the equity markets are doing good—the S&P, the Dow, the Russell, the DAX, the Nikkei—then the AUD/USD is usually doing very well also.
So once again, we need the stock market. It plays a big role in all the other markets we’re trading this coming week and every week for that matter.
So for now, that is our low. We’re correcting higher. The VP Neural Index strength is pointing higher. Reverse check mark on the predicted RSI. We may have a long trade coming here next week, but I would like to see us get above the quarterly opening price at 0.6613, but the very minimum I will accept is to get above the monthly opening price at 0.6546.
New Zealand Dollar versus U.S. Dollar ($NZD/USD)
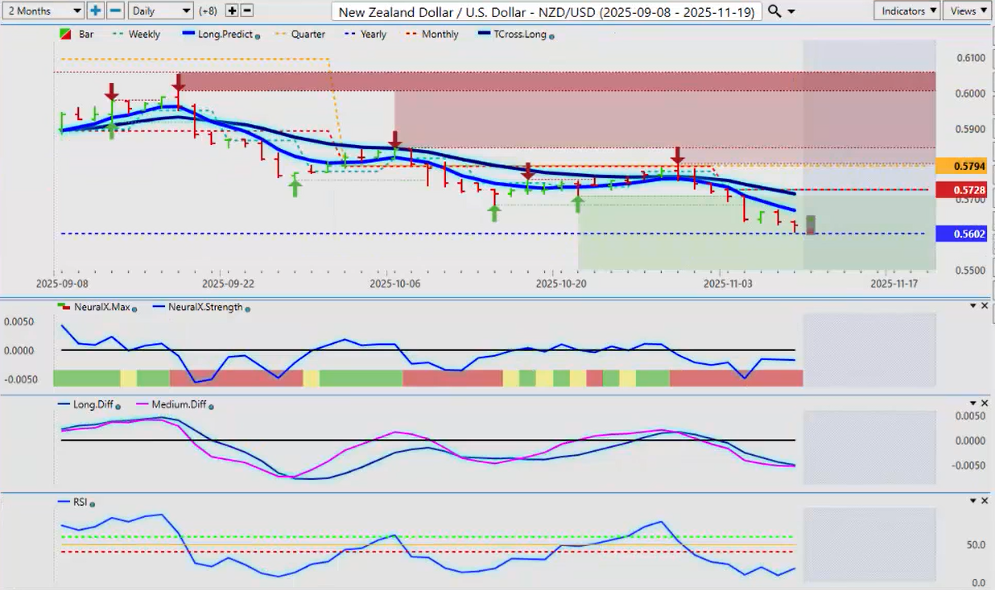
Same deal here for next week, guys, for the Kiwi. Virtually the same trade. The Kiwi in a very interesting location here. Either it’s going to reverse or there’s going to be a complete breakdown on the New Zealand currency. I believe it’s going to break higher.
So the yearly opening price, that level is coming in at 0.5602. That is the level we must close above. It’s okay if we go below it. We just don’t want to close below 0.5602 for two or more days in a row.
If it does, the Kiwi has far bigger problems coming. And that would indirectly tell us the equity markets are moving lower, AUD/USD is moving lower, USD/CAD is moving higher. It could set off a wave of trades here, guys.
So, there’s a lot to look at next week. But with that, there will always be opportunity using the VantagePoint software.
So with that said, this is the Vantage Point AI market outlook for the week of November the 10th, 2025.


