Welcome to the Artificial Intelligence Outlook for Forex trading.
VIDEO TRANSCRIPT
Okay, hello everyone, and welcome back.
My name is Greg Firman, and this is the Vantage Point AI market outlook for the week of November 17th, 2025.
U.S. Dollar Bullish Fund ($USDU)
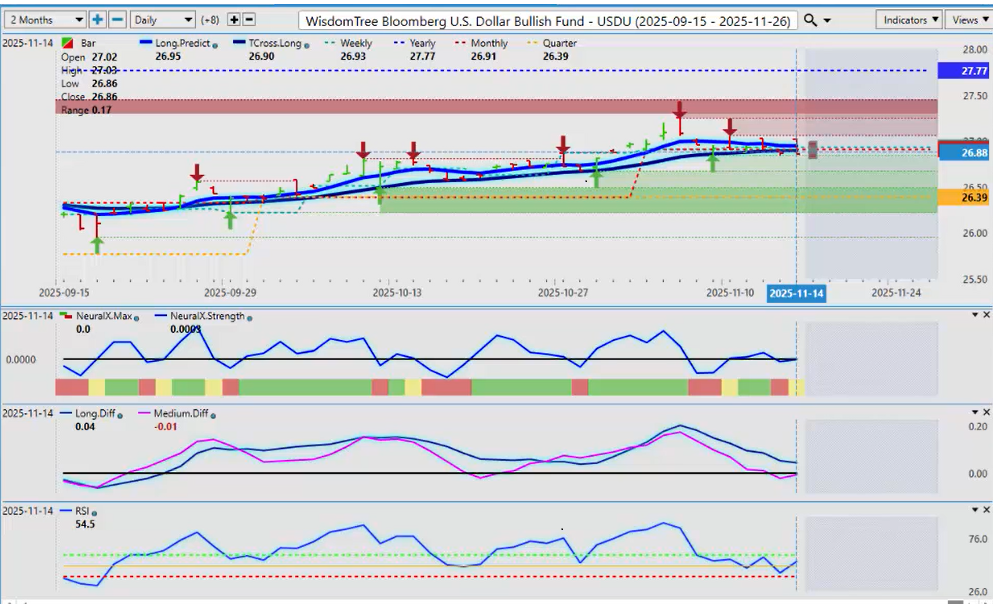
Now, to get started this week, we’ll begin where we always do with that very important US dollar. Now, a slightly different signal between my personal favorite, the USDU and the UUP ETF. Now, what I can assess here: we remain negative on the calendar year 27.77, but a more ominous signal appears to be forming. We’re closing two days in a row below the T-Cross Long. Now again, we have a medium-term crossover; we’re just lacking momentum. But when we look at UUP, you can see that UUP had a slightly positive day on Friday. So again, a very different signal here, which I believe is warning of further pending US dollar weakness.
Now, it will be data-dependent. The government is now open. We will be starting to get some data. We’re going to have to get caught up on this, so it’s going to be choppy and volatile. But for now, the signal on the USDU is suggesting the dollar is weakening.
Gold/U.S. Dollar ($XAU/USD)
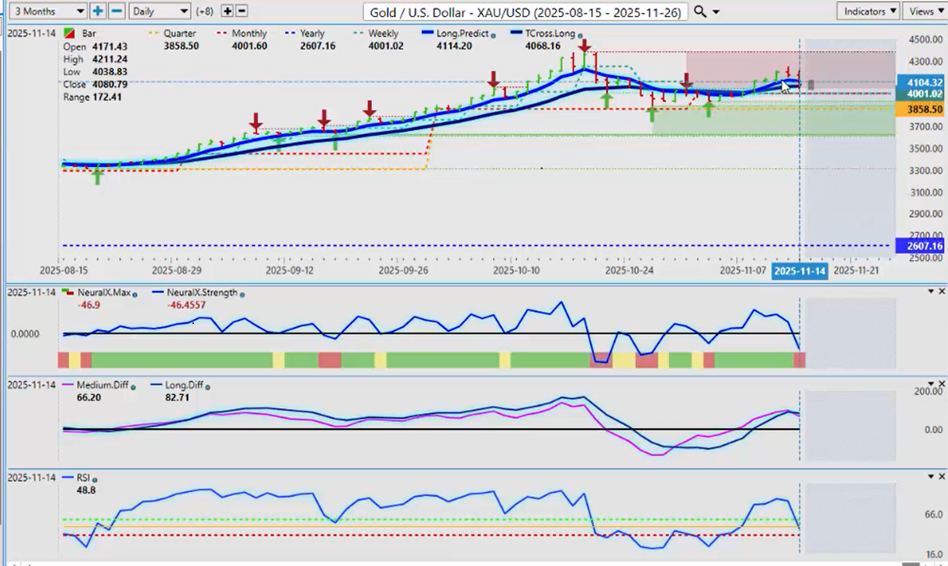
Now, when I do a comparative, a comparative analysis with the dollar and gold, we can see that gold has had a full retracement back to our T-Cross Long 4068.
We remain net positive on the month; we’re positive on the quarter, and we’re positive on the year.
Gold still remains bullish here, guys, especially as we go into December. In most cases, the December contracts do very well in gold, and the dollar actually does very poorly. Now again, my slight concern here is, again, the market believes that the Fed will not cut, and that’s letting the steam out of gold and out of silver. But with all due respect, I do believe that the Fed will be cutting whether he wants to or not.
But that MA Diff Cross right here — our pink line over the blue line — is warning that there is still a little bit more downside on gold. So what I would do is watch very closely the 4,000 level, the monthly opening price. But either way, if we’re lucky enough to correct down to the quarterly opening price at 3,858, that would be a premium long at that particular level.
SPDR ETF SPY ($SPY)
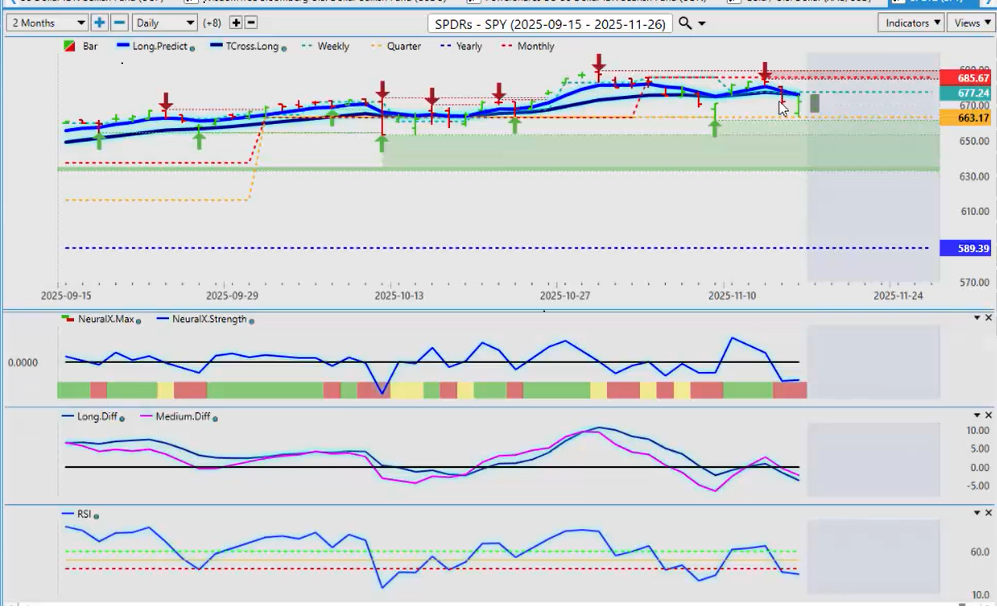
Now, looking at the equity markets for next week. Very interesting trading day on the Q’s, the Spies, the Dow, the major indices on Friday. A classic bear trap. You can see that the market sold right off — the media again fueling the sell-off on Friday morning — only to see it turn around and reverse directly from that very, very important quarterly opening price at 663.17.
So, for next week, that is the key level that you want to watch. But you’ll notice that we’ve had — this is the third failure — that we’ve had at the quarterly opening price. The first failure was back here in October. Then we’ve had another failure again on November 7th. Now, that is October over here, but it still is an area that I’m watching very closely.
But as we came down to this level on Friday, we actually were doing this in the Vantage Point live training room. And I said, “Look, if the media is this adamant that the stocks are going lower, it’s probably going to go higher.” But either way, that is the critical level. And understanding that the structural bias of the equity market still remains very firm. Remember, over the last 9, 10, 11 years — 5 years — we’ve had the Fed hiking, we’ve had the Fed cutting, we’ve had a very confused Fed in general.
But for now, that is the level to watch. As long as we’re holding above that, then I anticipate we will start moving back up to 685, the current monthly opening price.
Bitcoin
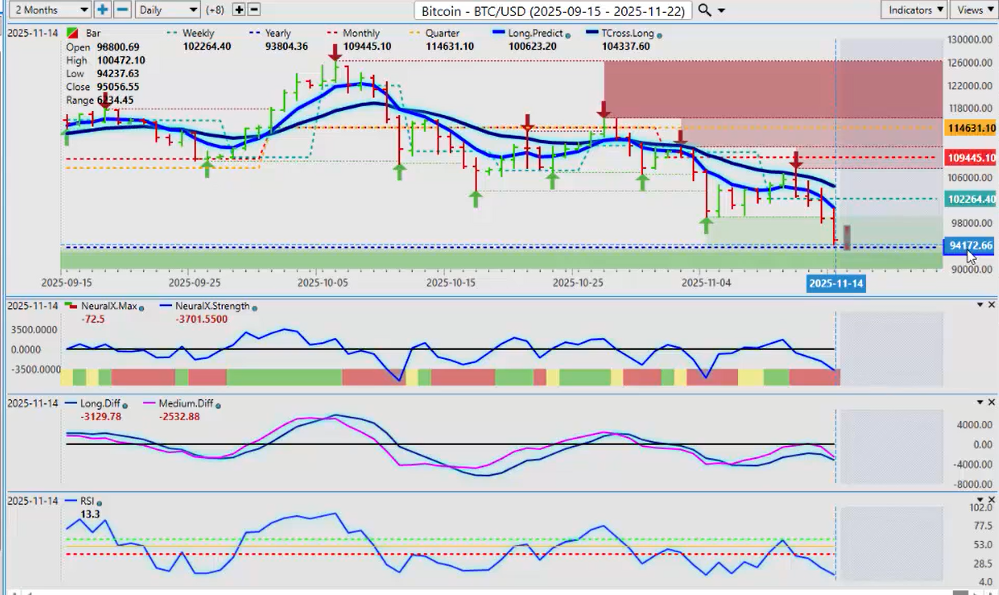
Now, with Bitcoin, Bitcoin falling hard also on Thursday and Friday, but you can see where it’s failing: 94,172. That is the critical level — the calendar yearly opening price. If we can hold above this level, Bitcoin remains bullish. But again, as I’ve mentioned many times in this outlook, Bitcoin follows a very regimented three-year cycle. Three years up, one year down. Three years up, one year down.
This is the third year of a three-year rally, suggesting Bitcoin will be down next year. But again, we want to finish out 2025. So that is the critical level. The indicators in VP do remain bearish. And you can see we’ve had two failures precisely at the T-Cross Long — only to see the market drop when it couldn’t get above it.
But again, right, I believe we’re going to stay between the calendar yearly opening price at 93,804 and the monthly opening price at 109,45. But we need to hold above that yearly opening price if Bitcoin is going to remain bullish.
Volatility Index
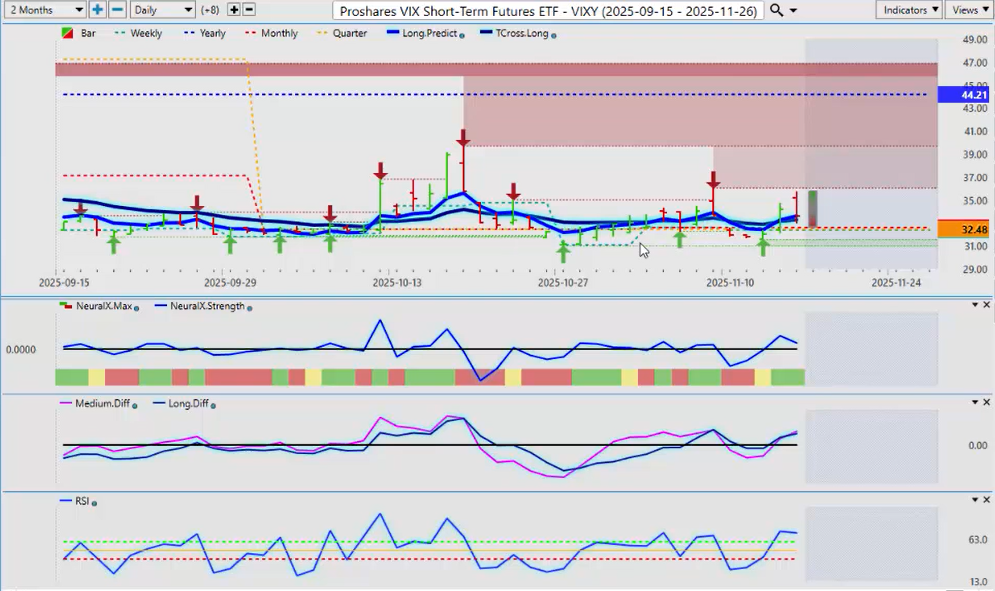
Now, tying all this together using the VIX, you can see that the VIX structurally is weak, but it is gaining a little bit of traction with the volatility around the Fed — the interest rate cuts. But again, for now, it’s starting to cross back up. But again, watch this very carefully on Monday, because there is a Monday–Tuesday reversal that occurs 80% of the time.
So right now, what I’m seeing is that if we’re holding above the T-Cross Long at 33.27, we could still see additional pressure on the stock market. But whether the Fed is hiking or cutting or doing nothing, most of your companies are doing quite well — actually even with the tariffs.
So again, I think the VIX will come under some selling pressure if this was a fake move on the S&P, the Nasdaq, and the Q’s.
United States Oil ($USO)
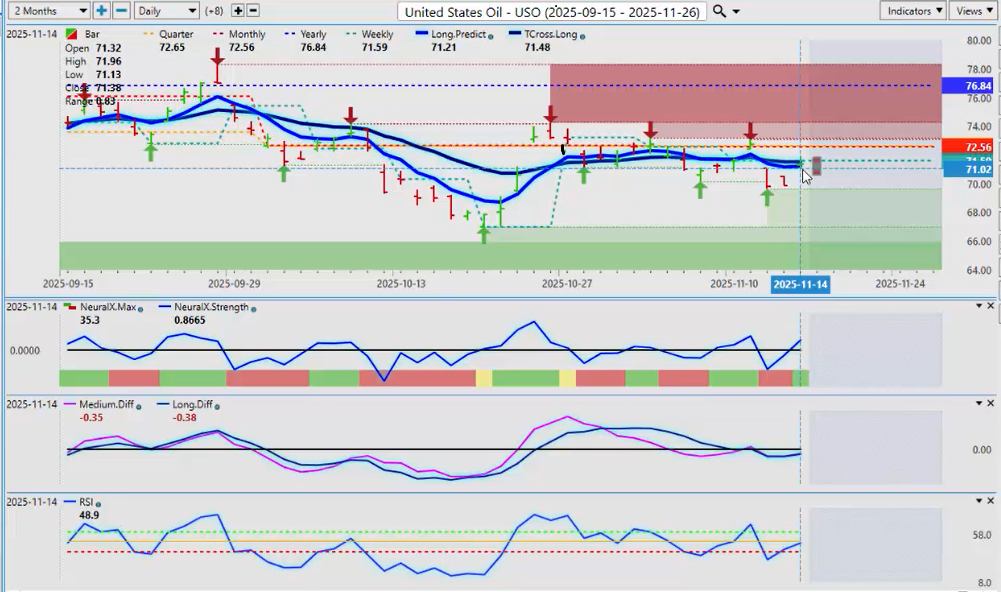
Now again, looking at light sweet crude oil, one of our main commodities. The commodity here on oil is trying to push back up, but this would be corrective in nature. The structural bias of oil is very weak. The yearly opening price 76.84. Then we have the monthly opening price at 72.56.
Now, it is suggesting we’re going to break a little bit higher to begin the week. But, in my respectful opinion only, any rally higher would be a selling opportunity. Because again, natural gas still carries a slight edge for about another few weeks, maybe a month, and then nat gas will likely come under selling pressure — and that could trigger some oil buying.
But for now, again, structurally it remains weak, but the short-term indicators in VP are saying we are going to continue to correct higher.
DAX
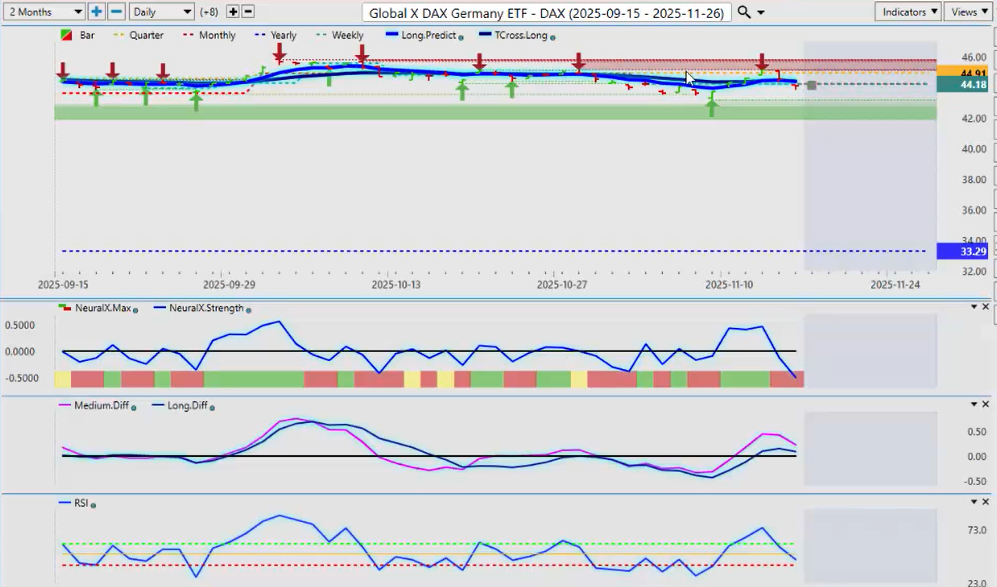
Now, definitely want to make sure I’m looking at the Global XDAX ETF. I believe the DAX is falling prey to the same thing that the S&P 500 and the Nasdaq did. But again, if the US stock markets turn higher, I believe that will benefit the DAX.
Another thing that’s very surprising is that, with that euro strength, the DAX was still unable to push higher. So we do have some resistance up here — that is for sure. But if we look at the ETF on the year, this is the one thing we always want to make sure we’re measuring — accurate performance, not picking and choosing tops and bottoms and moving our anchor points.
We want to look at exactly where this particular ETF is on the calendar year. It’s up 32.25%. That’s a fantastic move for the DAX.
So, the primary trend remains up. But again, I would prefer — I would like — to see us hold above this particular low in this $43 per share mark. If we lose that particular level right here — excuse me, right there, 43.10 I believe that is — and that’s the November low.
If we can hold above that, then I believe the DAX can turn higher. But again, the US equity markets are still a global driver of the overall global equity markets.
Euro versus U.S. Dollar ($EUR/USD)
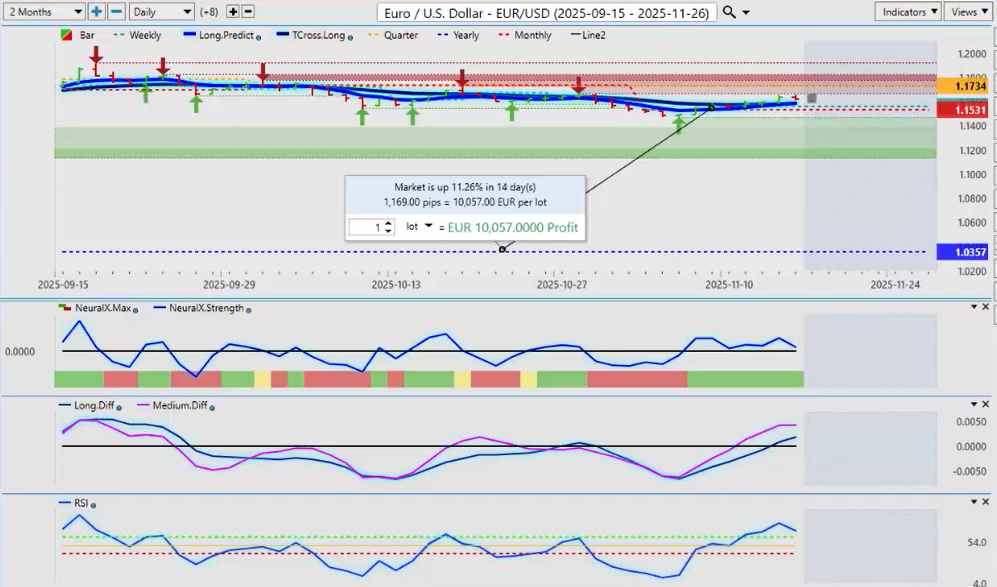
Now, as we look at some of our main forex pairs, all eyes have been on Euro/US this past week, and I believe they will continue to be. Now, the euro remains up over 11% on the year, guys. It’s a very, very good year for the euro — best year in a while, actually.
But again, we don’t want to pick and choose where we’re measuring random performance areas. That rolling performance model is often very, very misleading. So, at this particular time of the year, the euro usually does fairly well regardless of what the yearly trend has been, with the dollar weakening in December.
So for now, we’re holding above the T-Cross Long for next week because, again, this is an outlook, guys — not a recap of something else. We’re forward-thinking into next week.
That T-Cross Long 1.1587, the monthly opening price again 1.1531. As long as we’re holding above that particular area, the euro remains bullish on the year and the month.
Swiss Franc ($USD/CHF)
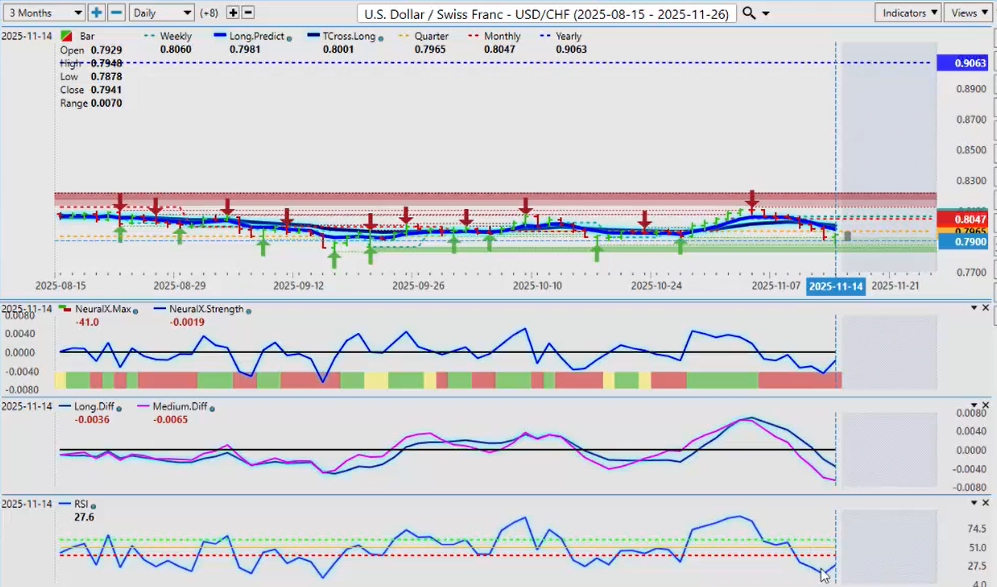
Now, from a comparative analysis with the Swiss Franc, it’s taken a pretty big hit this past week. And that’s usually because, usually, when the Swiss Franc strengthens, it’s because the equity markets are weakening — that flight to safety, that risk-off.
So, for now, I believe this lower end of this level can potentially hold — down around 0.7873. That’s the key level to watch for next week. The indicators from VP are slightly starting to roll back up to the upside.
And just on a side note on that euro, keep a very close eye on that pink line on the MA Diff Cross, because it too is flattening out. Now again, we can’t rule out dollar strength if the Fed starts talking about, again, staying flat — not cutting rates. That should have already boosted the dollar, but it didn’t.
So again, the intermarket correlation — very concerning. But a corrective move back up to the T-Cross Long for next week is going to be at the 0.80 cent mark. The monthly opening is 0.8047. We remain bearish while below that level.
And always remember, guys, the primary trend is easy to identify if you know what to look for. The calendar year — the US/Swiss Franc — has not been positive on the year. When we look at it going back some nine months here, you can see that this is a big move down.
And often people will say, “Okay, well, it’s oversold — it’s an easy long.” But be very cautious using overbought/oversold-type indicators, because they have a very, very high failure rate.
British Pound versus U.S. Dollar
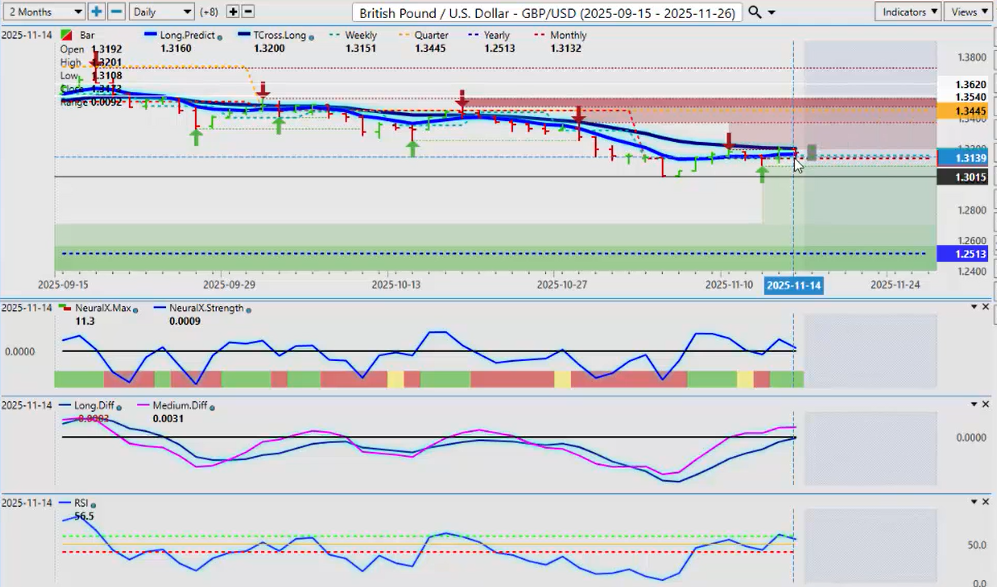
Now, despite that, some of the broad dollar strength the last week or two — it really hasn’t helped the British Pound very much at all. Now, the pound remains positive on the year, but we need to break through that T-Cross Long at 1.32.
Now, another way you can play this again is using buy stops — putting a buy stop above, say, 1.3220. So, if we break free and clear of the VantagePoint T-Cross Long, the probability that we go higher is about 80%. It’s very, very strong.
So again, if we can — we need to break through that. But if we can’t, then it will continue to slide lower. But I believe the pound can start to turn around as we move into the year-end.
U.S. Dollar versus Japanese Yen ($USD/JPY)
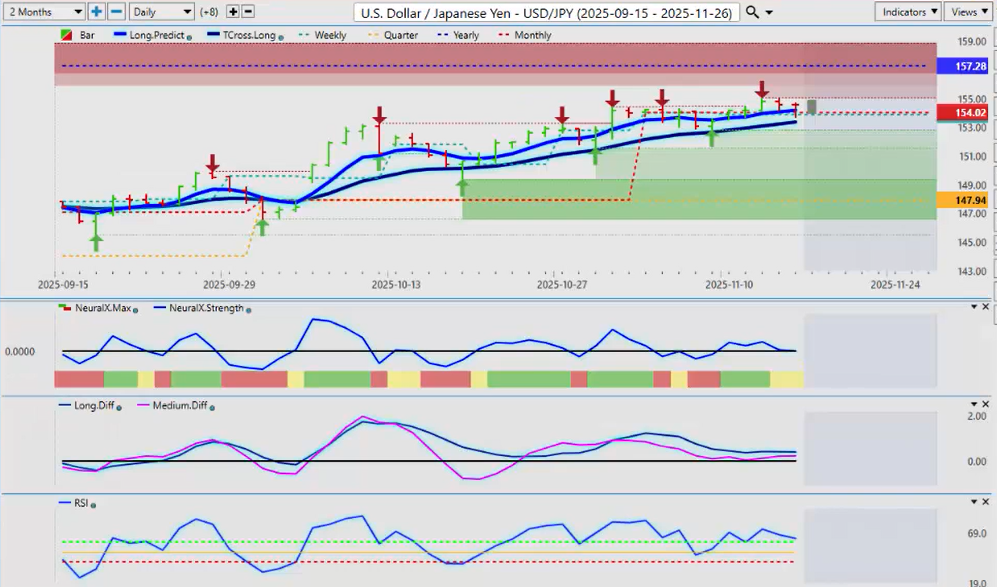
Now, with the dollar/yen, again, these are all G7 forex pairs. They’re all based around the US dollar. But for now, the dollar/yen is holding the line here. We’re above the monthly opening price and within striking distance of that yearly opening price at 157.28.
I personally cannot believe we’re still at this level with this pair. It was such a debacle back in 2020 with the Bank of Japan trying to verbally intervene, and then the Fed started hiking — it just blew up on the Bank of Japan and has taken the dollar/yen to this level.
So again, this is going to come down to interest rates. If the Fed does cut and he insinuates that he’s going to cut more, then that carry trade would start to come apart at the seams. But I don’t think we’re there yet.
Right now, the indicators are relatively neutral with this particular pair, with a slight — very slight — upward bias.
U.S. Dollar versus Canadian Dollar ($USD/CAD)
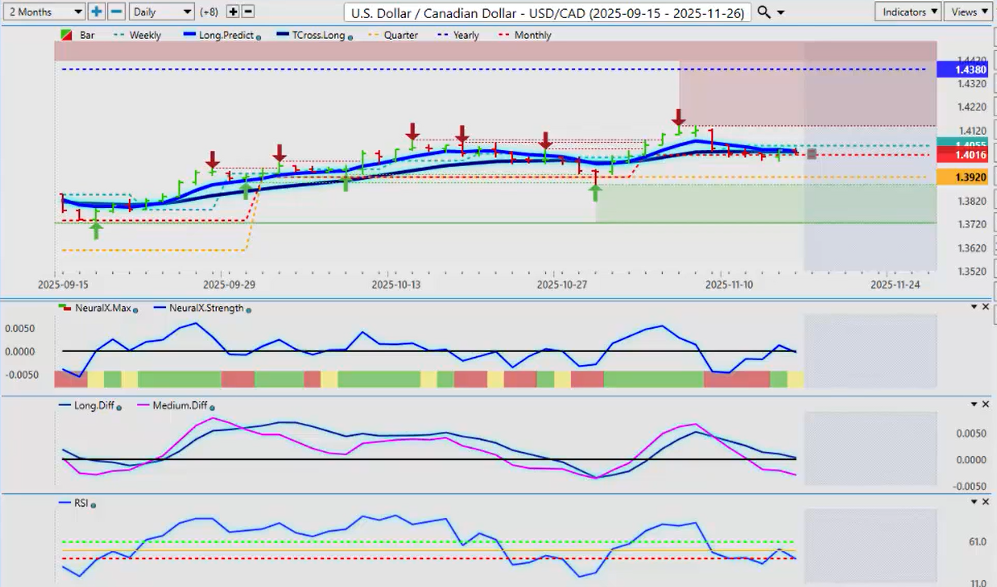
Now, the US/Canadian pair — likely to see more volatility as the old/new government tries to sell everybody their new budget plan, which the opposition parties are not really buying into.
Now, if that budget — the first budget of the new government — passes, that could be positive for the Canadian dollar. But we’re going to need equities higher, commodities higher to help the Canadian dollar, and it needs a lot of help.
So, for now, we’re hovering right around the current monthly opening price at 1.416. So, if we can hold above that, then the primary trend to the upside will likely continue. But if there’s broad dollar weakness, then this pair — some will even use this as a place to sell the US dollar.
So the indicators in VP are still negative, but we’re looking for momentum from that predicted RSI — a breakdown below that 40 level. But be very careful with this pair on Monday and Tuesday — it very often does the exact opposite on Tuesday that it does on Monday.
Okay. So, for now, we’ve got a lot of support lines building here. So, in my respectful opinion only, the real price is going to show itself this coming week.
So, watch that critical T-Cross Long. Again, this is another one you could straddle: you could put a buy stop at about 1.4050 and a sell stop at about 1.3970, and wait for it to break on one side or the other.
But the key point is: make sure that you know your levels and where to straddle these positions, because again, usually it’s a fundamental that will cause a spike one way or the other.
Australian Dollar versus U.S. Dollar ($AUD/USD)
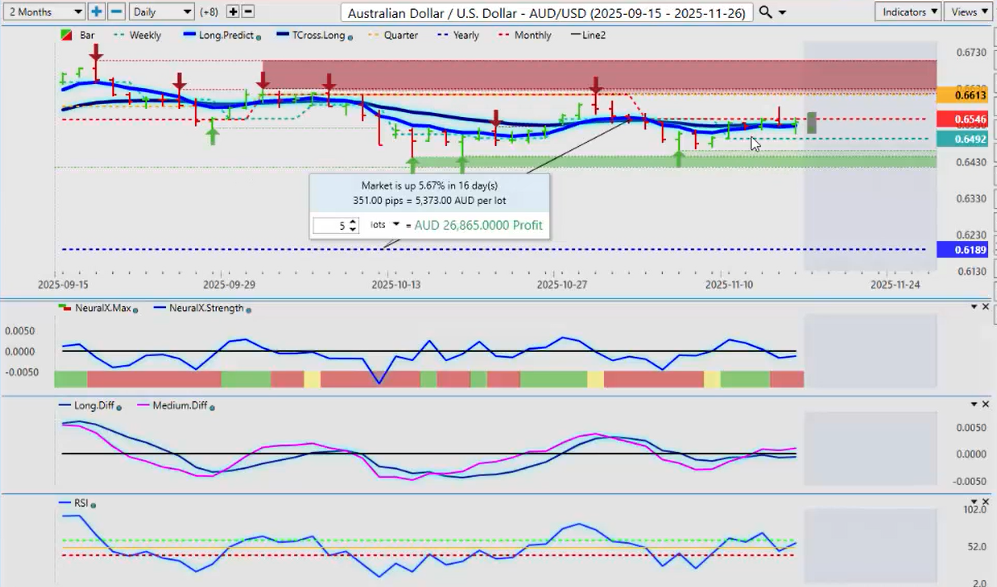
Now, the Aussie currency — again, this one’s a very interesting pair. And this is what actually told me on Friday, in live trading conditions, that the equity markets — the breakdown in the stock market — was false.
Because as we were watching it in the VantagePoint Live Trading Room, the interesting thing is the Aussie currency was moving up. The Aussie currency and the Kiwi have about a 98% positive correlation to the S&P 500, the Nasdaq, and the Dow.
So, if the Aussie is moving up and the equity markets are moving down, then that tells me something is seriously off.
And this is the power of direct intermarket correlations, guys. And again, that’s what — in my respectful opinion — alerted me that there was going to be a reversal in the stock market and that the breakdown was false.
So, the Aussie — if the stock market can extend its gains next week — the Aussie looks very, very good for longs. And I would — again — watch that T-Cross Long 0.6529.
If we’re holding above that level, we get above the monthly level at 0.6546, we’ve got a long trade here.
But again, always remember: if the stock market is healthy, we want to buy the Aussie, the Kiwi, right? Those are two currencies that we want to look at.
New Zealand Dollar versus U.S. Dollar
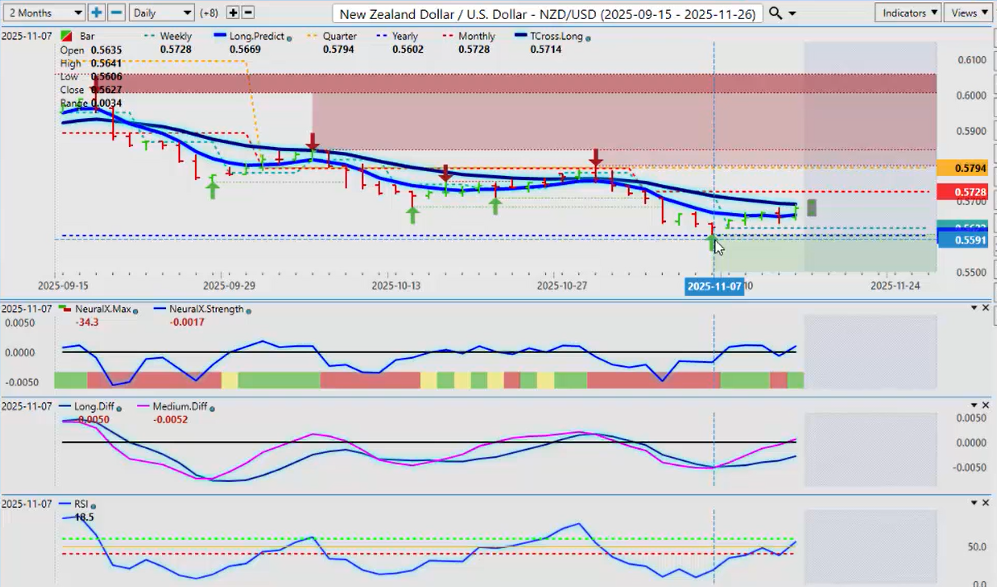
I am still of the opinion that the Kiwi is grossly undervalued here. Remember, just five, six years ago this was trading above — close to par.
So for now, we have come down — and this is an excellent example of what I’ve discussed on here week after week — using proper anchor points in our trading.
The yearly opening price — again, that’s a critical level. It’s a non-indicator. But the yearly opening price 0.562 — this is the key level for the Kiwi, excuse me.
If we can hold above this level, then we’re probably going to have a long trade for the next several weeks — potentially several months.
So again, watch that level very closely.
Right now, all I’m doing is waiting to clear the T-Cross Long at 0.5691. Then I can target the monthly opening price at 0.5728 and the quarterly opening price at 0.5794.
And that will take the pressure off the downside. And guys, the upside is wide open here. We just need some positive data — and maybe the Fed cutting.
So next week will be very, very choppy again as the US government reopens. But with that, there will always be opportunity with intermarket correlations.
So, with that said, this is the Vantage Point AI Market Outlook for the week of November 15th — or excuse me — November 17th, 2025.