


Welcome to the Artificial Intelligence Outlook for Forex trading.
VIDEO TRANSCRIPT
US Dollar Index / USDU
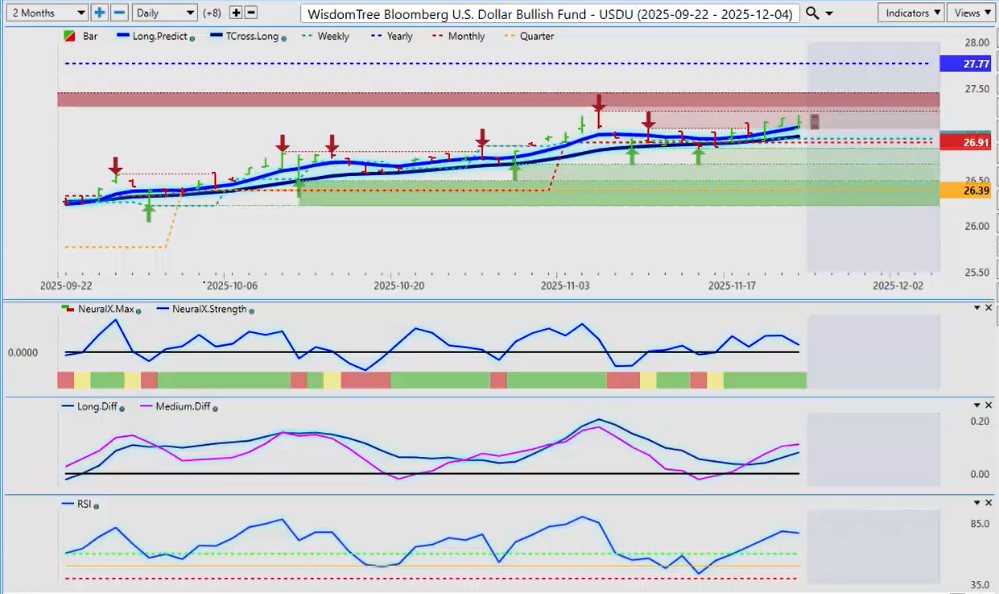
Okay, hello everyone, and welcome back. My name is Greg Ferman, and this is the VantagePoint A.I. Market Outlook for the week of November 24th, 2025. Now, to get started this week, we’ll begin where we always do with that very important Dollar Index, or in this particular case, we’re looking at the USDU (Bloomberg U.S. Dollar Bull Fund) to measure this dollar strength. We’ve been running along the T-Cross Long for basically about two weeks now, and we’re starting to rise higher. Bets are mixed on whether the Fed’s going to cut or whether he’s not going to cut, but quite frankly, guys, at this point, it’s really just a lot of noise in the market and a lot of confusion, and that’s coming from the Fed members.
For now, the Dollar Index is moving up, but as we can see, the VantagePoint indicators show the Neural Index is green, but Neural Index Strength is actually pointing down, indicating it’s losing momentum. Our MA Diff Cross has told us that we were going to rise, but we still remain negative on the calendar year. When we measure it from a hard anchor point to where we closed approximately on Friday, we can see that the dollar is still down 2.17%. This is probably something you’re not hearing very often because I’m not hearing it at all in the media or on CNBC, Bloomberg—these types of things. They’re simply talking about dollar strength when, in actual fact, it’s still negative on the year. Historically, the U.S. Dollar does very poorly around U.S. Thanksgiving and, more specifically, in the month of December. We could be nearing a corrective move on the dollar, but the key levels you want to watch going into next week are the Monthly Opening Price at 26.91 and, of course, that very important T-Cross Long at 26.98.
S&P 500 / SPY
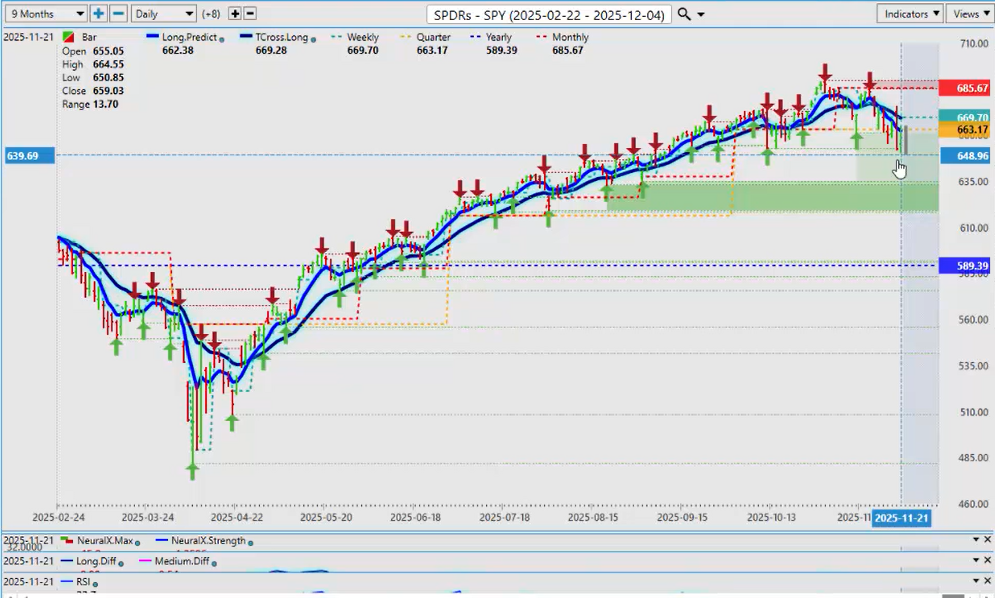
Now, taking a further look at the equity markets—because again, the media is really spinning things both ways here—let’s look at some true performance on the SPY, which mirrors the S&P 500. From the low point back in April, we’ve rallied a massive 43.15%. That’s from the lows they continue to cherry-pick. Now we’re going to delete that and instead say, “Okay, when we moved above the yearly opening price, how much did we rally from there?” We rallied another 16.88% from the yearly opening price back in May, which took us all the way up to the October 29th high at about 689.
When we look at true performance here, from the most recent low point in the market on Thursday, the market still fails to mention—and the media fails to mention—that we’re still up a whopping 10.4% on the SPY this calendar year. We had a massive rally on Friday on this particular ETF and on the S&P 500 futures. In my respectful opinion, historically speaking over the last five years, around the 6510 mark on the S&P 500—on a couple different indexes—there is very strong support down there. I misspoke earlier; what I meant was around 6510 being the historical lows on the S&P. We took a very strong bounce out of there on Friday based on seasonal patterns. In most cases, the S&P 500 has closed above its open price in the month of November. We’ve had a powerful rally on Friday.
A lot of confusion exists around the Fed. The Nvidia (NVDA) earnings were very good. The CEO of Nvidia said, “I don’t believe that there’s a tech bubble here or an A.I. bubble.” The market still pushed it lower, but anything around U.S. Thanksgiving often sees this kind of volatility, which I would’ve expected next week. The market is very jittery. Based on this, I’d be looking for some type of continuation into next week, provided the Fed stays in check. Looking closely at the chart, we see a big move down—a big bar down—and then a reversal. The Neural Index in my respectful opinion, and the Neural Index Strength, were already giving a warning sign that this market was not as structurally weak as it looked. What we want to see now is a move back above the quarterly opening price and ultimately above the T-Cross Long at 66.928.
DAX Futures
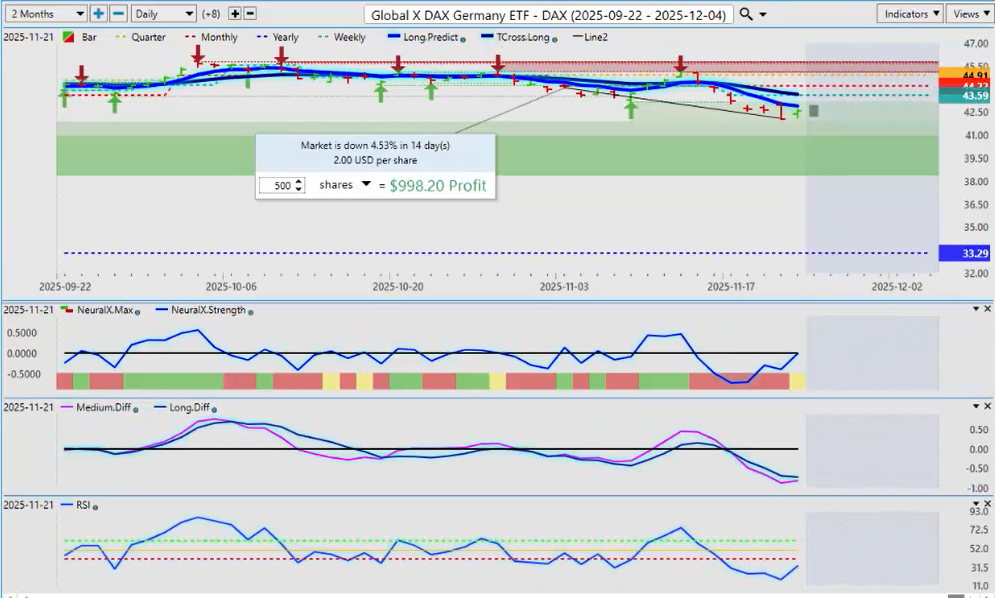
When we do a comparative analysis to the DAX, in the month of November we’ve dropped 4.53%. Automatically people think that the bears are in control, but the average drop in DAX futures in November over the last five years has been just over 2%. I double-checked the 13-year lows on the DAX on a percentage basis, and that came in at about 4.5% on the DAX futures. It’s very interesting that this is exactly where we bounced from. I warned everyone this week. I got a comment from my good friend from Germany: “Here come the bears.” My comment was, “Watch out for a bear trap,” and sure enough, that’s exactly what was sitting there.
Knowing these historical levels—what the DAX has done over a longer period of time in November—is very important. What often happens is we comingle weeks and months together and it causes distortion. If I look at the primary trend in 2025, I believe this is one of the best years the DAX has had, and it’s been a very good year for the Euro too, with the DAX currently up 27.3%, grossly outperforming the S&P 500. Yes, we could have more room to the downside, but that 4.53% drop is a very unique number. Over the last 13 years, using the same anchor point—the monthly opening price—the biggest November drop has been about 4.3% in the DAX futures. Very interesting stuff. Doesn’t mean it won’t crash next week, but the direction will be dictated by the U.S. equity markets.
Gold
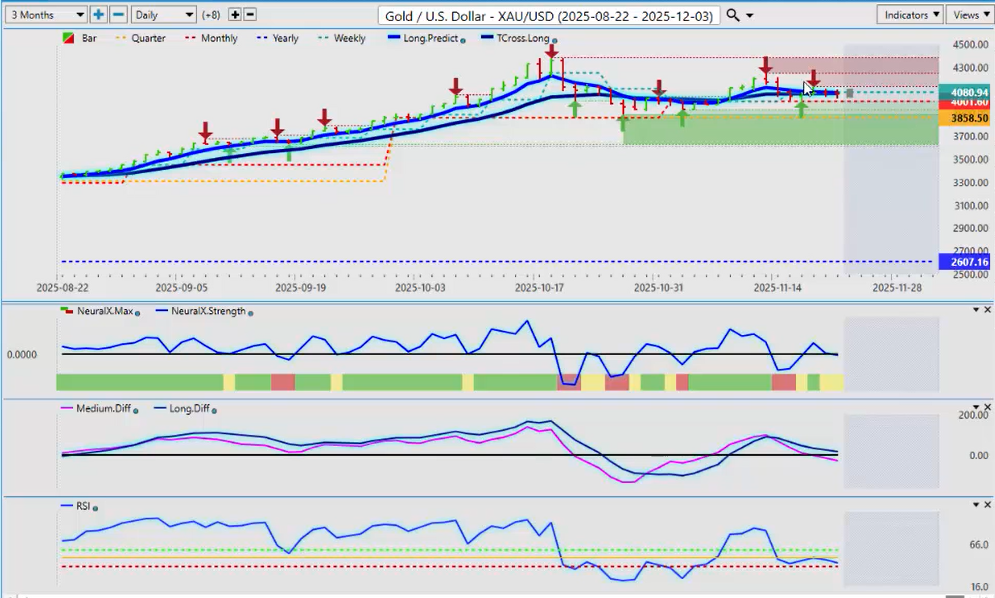
Looking at gold, we can see that gold is basically running flat this week. In most cases—not all, but most—gold and silver usually do quite well in December. We are holding above the very important Monthly Opening Price at 40160. I would argue that with gold, we should watch the VIX very closely, because if the VIX starts failing, that could potentially drag gold down with it.
Volatility Index ($VIX)
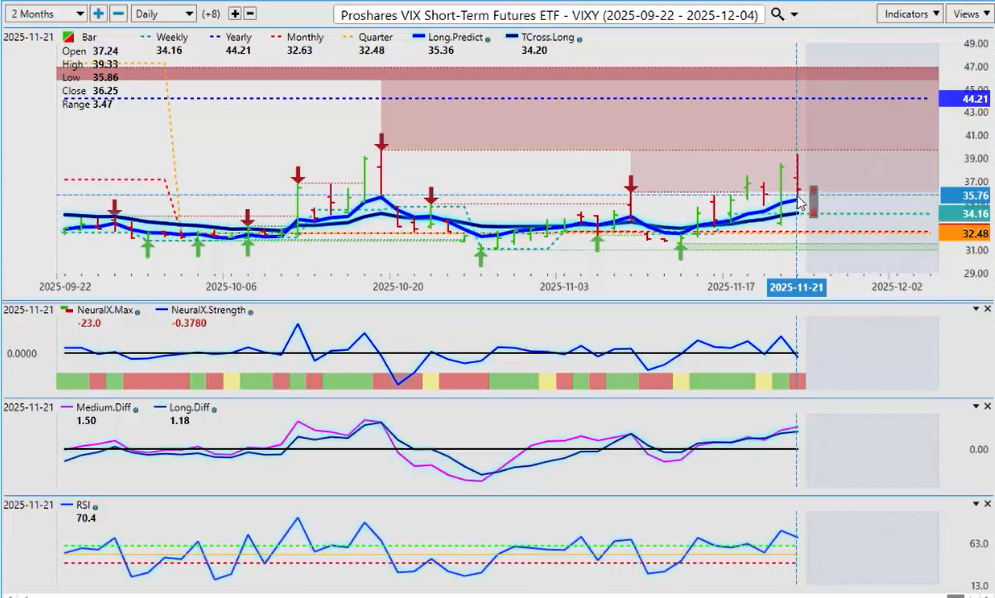
The VIX is holding above the quarterly opening price but is still negative on the year. This is being missed in the media because they are consumed by short-term trading. If we look at how the VIX finished Friday from the yearly opening price, it’s down 17.85%. I would need the VIX, at the very least, to stay above the Long Predicted and the T-Cross Long, but there are already cracks in the dam. Much will come down to what the Fed does. Over the last 5, 10, 15 years, whether the Fed hiked or cut, whether he was hawkish or dovish, equities have ultimately gone higher. The VIX is still grossly negative on the calendar year on this ETF, but it is something we need to keep an eye on. I believe the Fed is going to discuss rate cuts in 2026 and will likely cut, but the U.S. economy is moving along pretty well by the numbers despite tariffs and everything else.
Bitcoin
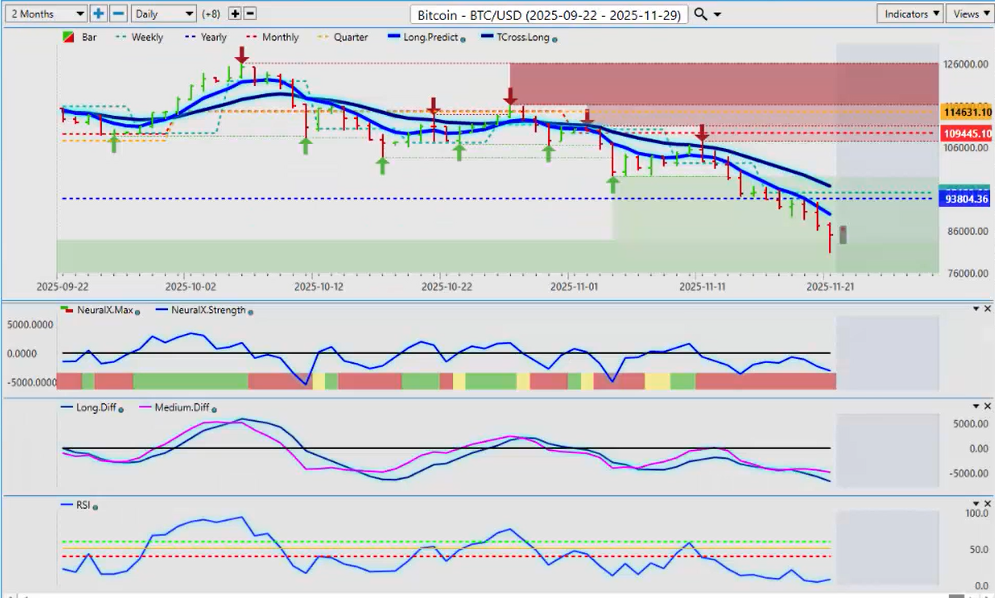
When we look at Bitcoin, Bitcoin is going to be fueled if equities turn higher—more specifically the QQQ, the NASDAQ. That will help Bitcoin turn around. My concern, as I’ve discussed for months, is that Bitcoin has a three-year cycle: three years up, one year down; three years up, one year down. We are in the third year of the three-year rally, which points to a pullback next year. That pullback remains to be seen because we have to first assess how we finish the calendar year of 2025. We’ll use the new yearly opening price to gauge whether Bitcoin will continue to follow this three-year cycle. Right now, it appears likely. But if equities turn around and we get a risk-on environment, then Bitcoin should climb higher. The indicators are still negative for now.
The key level to watch is 93,8004. Another way of playing this move is placing a buy stop just above that level. If Bitcoin turns around and gets back above the yearly opening price, we are going to rally higher. If we cannot, then it will confirm that we are going lower into year-end and likely lower into next year.
Crude Oil and Natural Gas
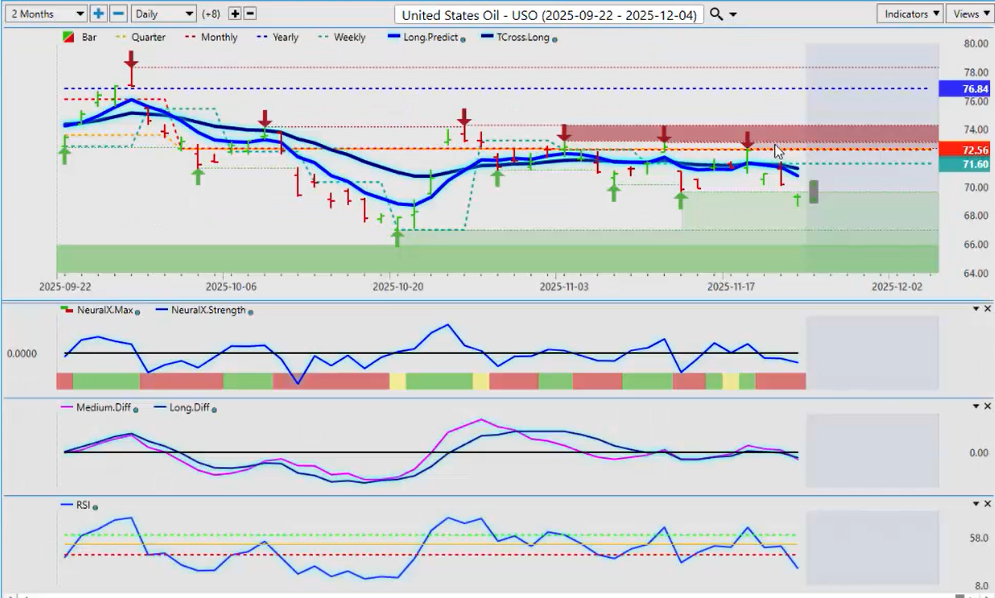
Looking at oil on the commodity side, I would’ve expected a little more of a bounce, but this is not really the time of year to be buying light sweet crude. Natural gas should remain firm for a few more weeks, but January nat gas starts to fall off, and then we start looking at oil again. For now, oil remains structurally weak below its yearly, quarterly, and monthly opening prices. Nothing at the moment is overly bullish for oil, though equities turning around could pull oil up a bit. I would be looking more toward January, February, and March for long oil trades.
Euro versus U.S. Dollar ($EUR/USD)
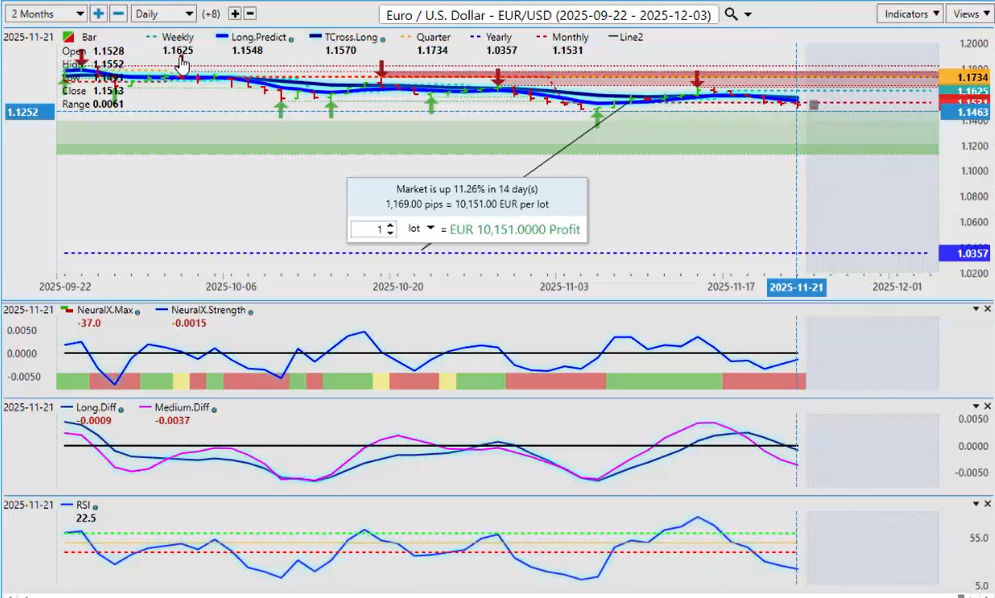
As we get into some of our main Forex pairs, we’re in for another very interesting week. All eyes will be on the Euro/U.S. Dollar (EUR/USD) pair. We’ve been running sideways in a channel for a couple of months—some upside, some downside. There is verified support down around 1.1465. Historically and seasonally speaking, the Euro doesn’t do too badly in December, but that’s due to U.S. Dollar weakness, not Euro strength. The Euro has had a very high intermarket positive correlation to gold, so if gold rebounds, that should help pull the Euro back up.
I am seeing a warning sign with Neural Index Strength starting to turn. The Neural Index is red, but inside that index it looks like it’s trying to turn around. Watch this area very closely around the Monthly Opening Price at 1.1531. If we can hold above that next week, then I believe you have a long trade here, and we’ll be watching this into December.
U.S. Dollar versus Swiss Franc ($USD/CHF)
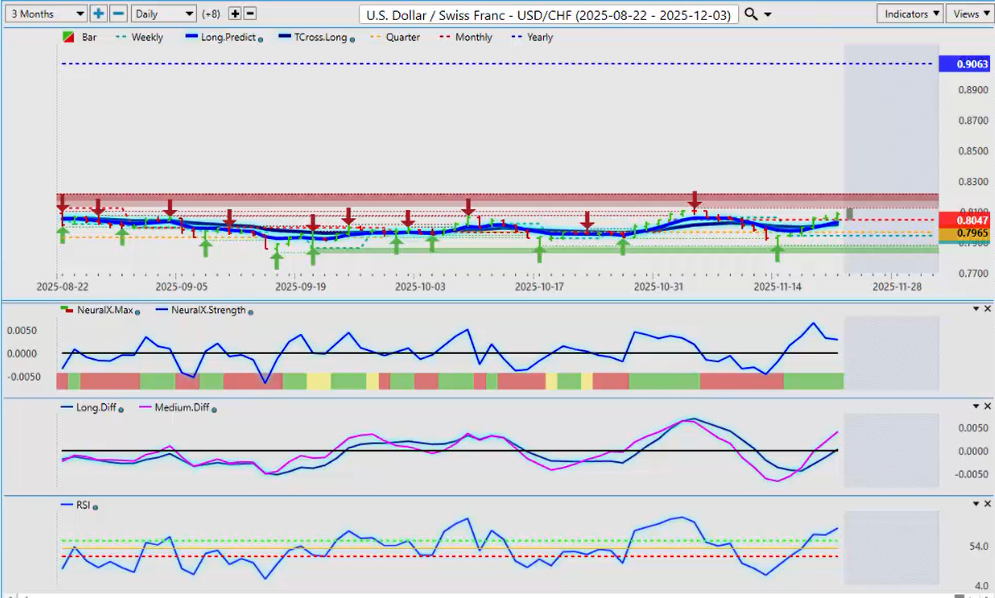
Now, the U.S. Dollar/Swiss Franc (USD/CHF) pair. The Swiss National Bank is talking again about promoting negative rates to weaken their currency. Historically, every time they’ve done this, it’s been a mess. The only one worse at this is the Bank of Japan. Both have created problems, but the Swiss are nowhere near as bad as Japan.
This is a make-or-break area for this pair. The Dollar Index, the USDU, they all have to move up if this pair is going to move higher. We are very negative on the calendar year. Even though the dollar has done well in the last two quarters, this pair remains heavily down. Having a solid anchor point helps us assess the real trend: this pair is down 11%. Currencies rarely go down this much in a calendar year. This is likely what’s making the Swiss National Bank nervous. When they start talking intervention, their track record speaks for itself. The Euro/Swiss Franc is a perfect example of how central bank intervention makes things worse.
If we can get above the Monthly Opening Price and hold above it, we may have a trade. Momentum to the upside is building, but I believe it would be short-term.
British Pound versus U.S. Dollar ($GBP/USD)
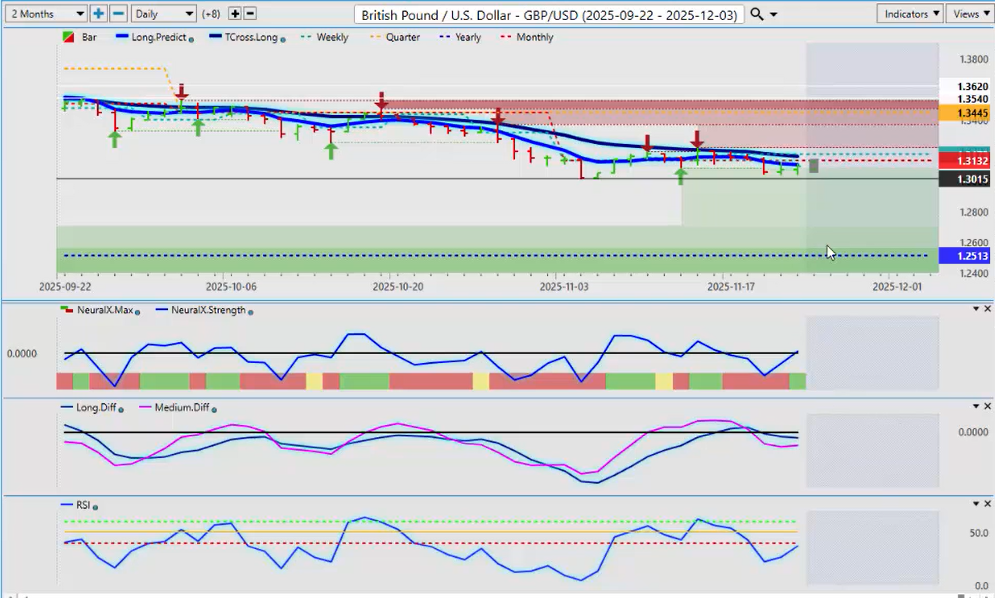
Now the British Pound/U.S. Dollar (GBP/USD). A lot of us want to get long on this pair—maybe December is our month—but we just cannot get through the very powerful VantagePoint Predicted Moving Average, the T-Cross Long, at 1.3190. The current T-Cross Long is 1.3160. If we can get above the Monthly Opening Price and break above the T-Cross Long, we’ve got a long trade. Another way to play this is placing a buy stop above 1.3160. If it breaks this level, we’ll be ready. If it can’t get through, pressure remains to the downside.
Neural Index Strength is pointing upward. We could see a long coming as early as next week. If the Fed chatter becomes more dovish, we could get the long trade—but it wouldn’t be on GBP strength; it would be on USD weakness. Always remember that.
U.S. Dollar versus Japanese Yen ($USD/JPY)
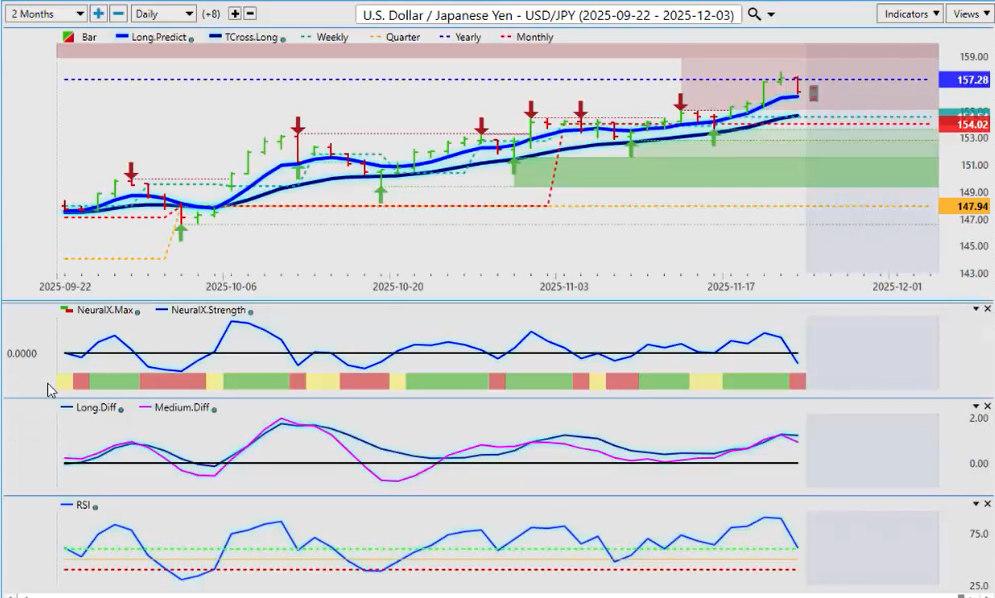
Now to the pair everyone loves to hate: the U.S. Dollar/Japanese Yen (USD/JPY). Full disclosure: I am dumbfounded that this has made it back up to the yearly opening price. But it’s a perfect opportunity to explain why this level is so important. We’ve been stalled here for three days in a row. The Bank of Japan is on the hunt. Be careful around the opening on Sunday night. This is an outlook, not a recap, and I suspect they’re going to try to make a move very soon to strengthen the yen. If we break through the yearly opening price of 157.28, they’re going to go into full panic mode. But remember, they caused this—not the Fed. The Fed hiked rates, yes, but the BOJ was verbally intervening in 2020 and has been crushed since.
Japan’s exports are doing well, but imports are costing a fortune with a yen this weak. VantagePoint is picking up on what I’m thinking: the MA Diff has crossed to the downside; the Neural Index is pointing down; the Predicted RSI is pointing down; and we are failing at the yearly opening price. If there is going to be intervention to strengthen the yen, we could be days away. If you’re not sure, stay away. It’s going to be volatile into the end of the calendar year. I’m getting the feeling that Japan is getting ready to make a move very soon. Be very careful.
U.S. Dollar versus Canadian Dollar ($USD/CAD)
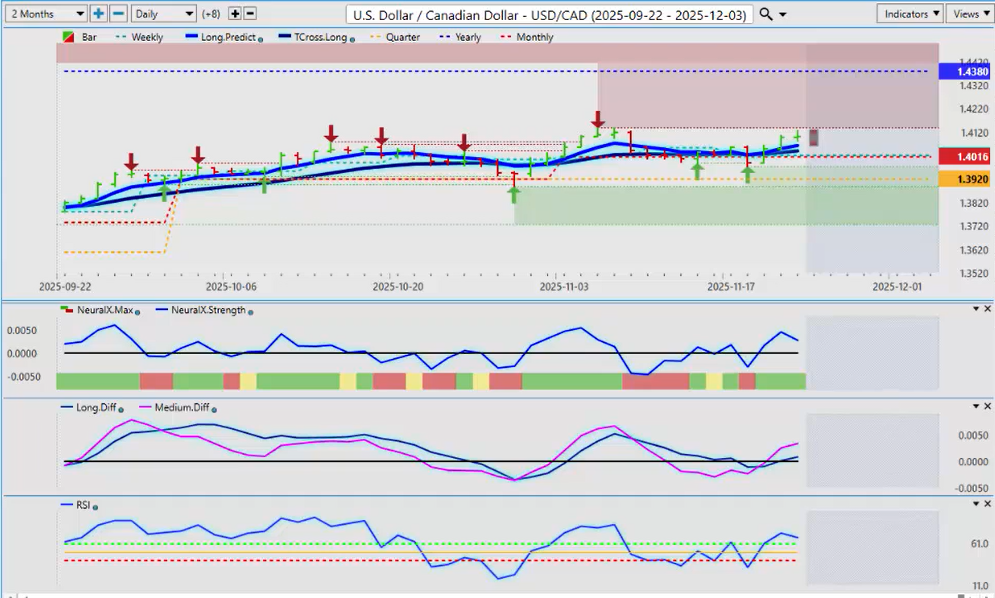
Now the U.S. Dollar/Canadian Dollar (USD/CAD) pair. It’s not about Canadian strength; it’s about U.S. Dollar strength or weakness. Canada has come through its first budget—probably one of the most disastrous budgets I’ve seen. The fiscal anchor has been removed. Not even Justin Trudeau removed that debt-to-GDP anchor. Carney’s budget removed it, and that basically means he’s going to spend, spend, spend, and fire up the printing presses. The very definition of a weakening currency is expanding the money supply.
This is not an elbows-up issue. This is dangerous. For now, the pressure is mounting to the upside on this pair. Even if the U.S. Dollar weakens, I don’t think that strengthens the Canadian Dollar much. I’ll give the new prime minister time, but we’re not off to a good start. They barely got the budget passed. The Parliamentary Budget Officer questioned why the media is not talking about the removal of the fiscal anchor. Central bankers love to gamble, and that’s what he’s doing with the Canadian economy.
Longs on the Canadian Dollar are not recommended until we see what happens with tariffs and this bizarre budget. Bias remains to the upside while above the T-Cross Long at 1.4041. Monthly and yearly opening prices show we’re still negative on the year but positive on the quarter and month. Critical support is at 1.3920. I would only short below that level.
Australian Dollar versus U.S. Dollar ($AUD/USD)
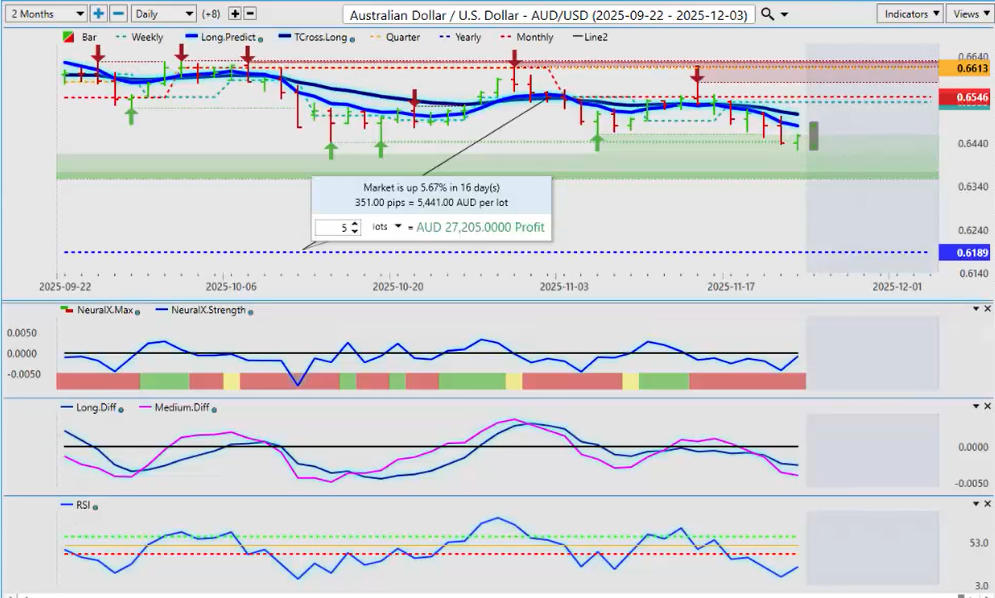
If equities move up next week, you definitely have long trades on the Aussie/U.S. Dollar (AUD/USD) and New Zealand/U.S. Dollar (NZD/USD) pairs, but heavily tipped toward the Aussie. We must look at the real trend: 0.6198 is the yearly opening price. The Aussie had a real good rally on Friday because the stock market did. When you trade the Aussie or the Kiwi, you are indirectly trading the S&P 500, in my respectful opinion, based on the highly correlated markets. The correlation between the Aussie and the S&P is about 90%. If equities go up next week, the Aussie will climb with them.
We are still below the T-Cross Long. I think a retracement, if nothing else, back to the T-Cross Long at 0.6506 is likely. There is very strong seasonal support around 0.6419. As long as you’re holding above 0.6419, longs are in play.
New Zealand Dollar versus U.S. Dollar ($NZD/USD)
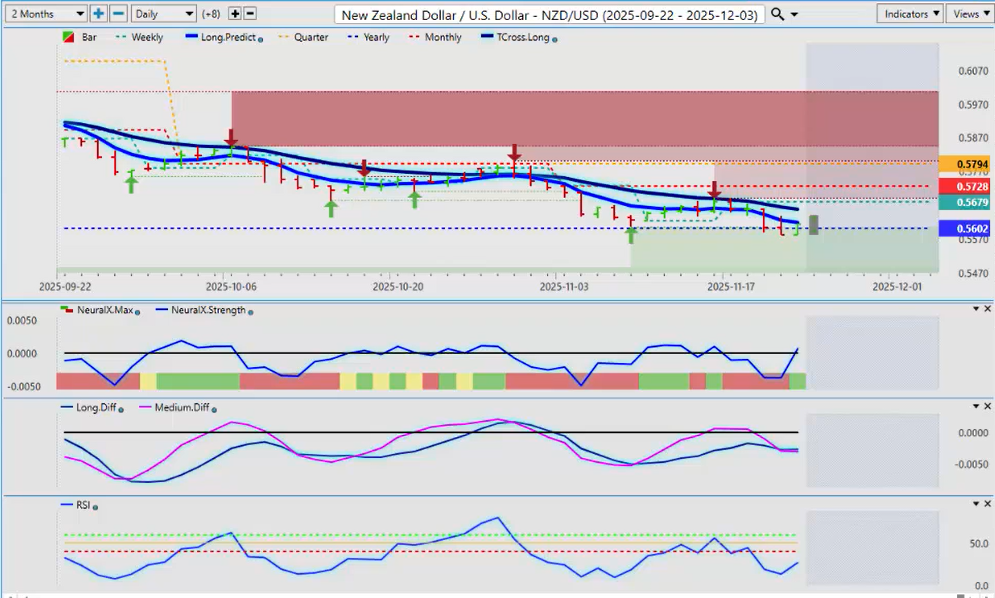
The same applies to the New Zealand Dollar. The market is obsessed with interest rates in New Zealand, and yes, we’re pressuring the yearly opening price. But given the correlation with the Aussie, the Kiwi may be better value. The Aussie could have room to fall; the Kiwi has more room to rise.
If we can hold above the yearly opening price at 0.5605, we have a long trade and potentially a very good one into 2026. My only concern is we already had one failure at this yearly opening price. Ninety to ninety-five percent of traders will never see how powerful that level is. It’s one of the strongest price-based tools you will ever have. If we can get above that and stay above it, then we will have a good long. I think a retracement back to the T-Cross Long at 0.5659 is likely next week. But what can undo several positions is a stock market that continues to crash. Another volatile week is coming.
Personally, I believe most of the volatility is out of it. I would have expected it Tuesday or Wednesday next week near U.S. Thanksgiving. But I think the media scared everyone with an A.I. bubble story. If you know your levels, trading is always easier than listening to the media.
This is the VantagePoint A.I. Market Outlook for the week of November 24th, 2025.