


Welcome to the Artificial Intelligence Outlook for Forex trading.
VIDEO TRANSCRIPT
WisdomTree Bloomberg U.S. Dollar Bullish Fund ($USDU)
Okay. Hello. Hello everyone, and welcome back. My name is Greg Firman, and this is a VantagePoint A.I. Market Outlook for the week of October the 13th, 2025.
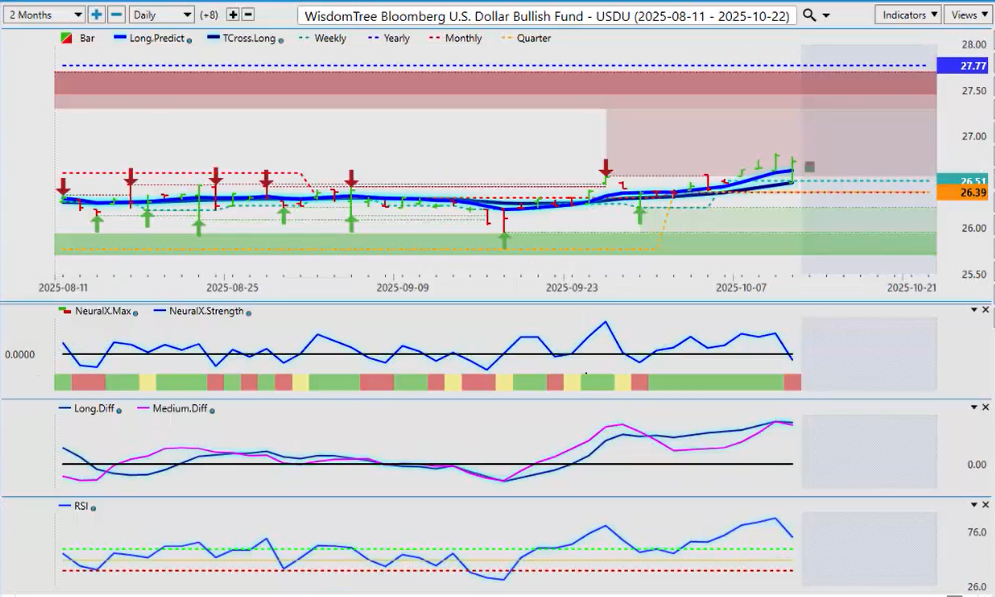
Now, to get started this week, we’ll begin where we always do — with that very important U.S. Dollar Index or the USDU WisdomTree Bloomberg U.S. Dollar Bull Fund. Now, I believe that this particular ETF is a very good way of gauging U.S. dollar strength and weakness because it’s not all just based around the euro, like the UUP or the DXY is. It takes dollar transactions globally and measures the strength.
So, right now, the ETF is holding above the current quarterly and monthly opening price, but a lot of this is based around risk-off sentiment. So, next week, it will all depend on what Trump does with the tariffs on China that caused a big sell-off in the equity markets on Friday. But I believe that’ll sort itself out next week. So, for now, we’re on the particular ETF at 26.39. Our T-cross long is at 26.49.
We can basically continue buying dollars as long as we’re holding above these two critical areas. The VP indicators are warning that potentially we could be seeing a corrective move, if nothing else, coming — so be very, very cautious there.
Now again, when we look at the UUP in comparison, it’s basically showing the same thing, but you can see that the UUP took a bit of a sell-off on Friday. And again, I’ll just show that again so you can see it — one had a strong move up and the other one actually sold off. So again, this will be very interesting to see which one of the two ETFs have this right. But historically, at least over the last year or so, the WisdomTree Bloomberg U.S. Dollar Bull Fund has been more accurate, in my respectful opinion only.
Gold ($XAU/USD)
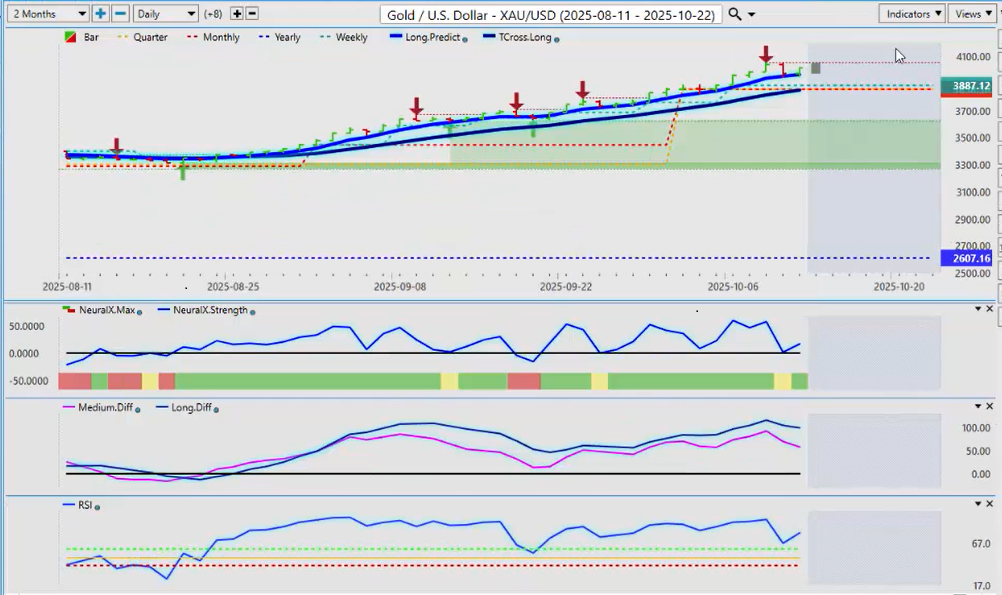
Now, when we look at Gold, Gold has had a big move up again to all-time new highs, but now we have a newly formed verified resistance high — 4059. That should contain Gold longs, particularly if Trump backs off the tariffs with China — that would settle things down. I think that Gold ultimately goes higher toward November and December regardless, but it could have a little bit of a corrective move.
But where we’re looking at key support — key support can only be used with the T-cross long and the monthly, quarterly, and yearly opening prices. Gold clearly very bullish on the year — 2607. But now you can see the critical support level is coming in at the T-cross long — 3852. The monthly and quarterly opening price also sitting right there.
So, I personally would not be shorting Gold unless I can get a sustained break of this particular level near 13850. The indicators in VP remain moderately bullish — not excessively bullish, just moderately. Again, the neural index has come down — reverse check mark off the zero line. Predicted RSI holding above the 60 line. So everything still looks pretty good for longs. But again, we need to hold that key level of 3858.
SPDR SPY ETF ($SPY)
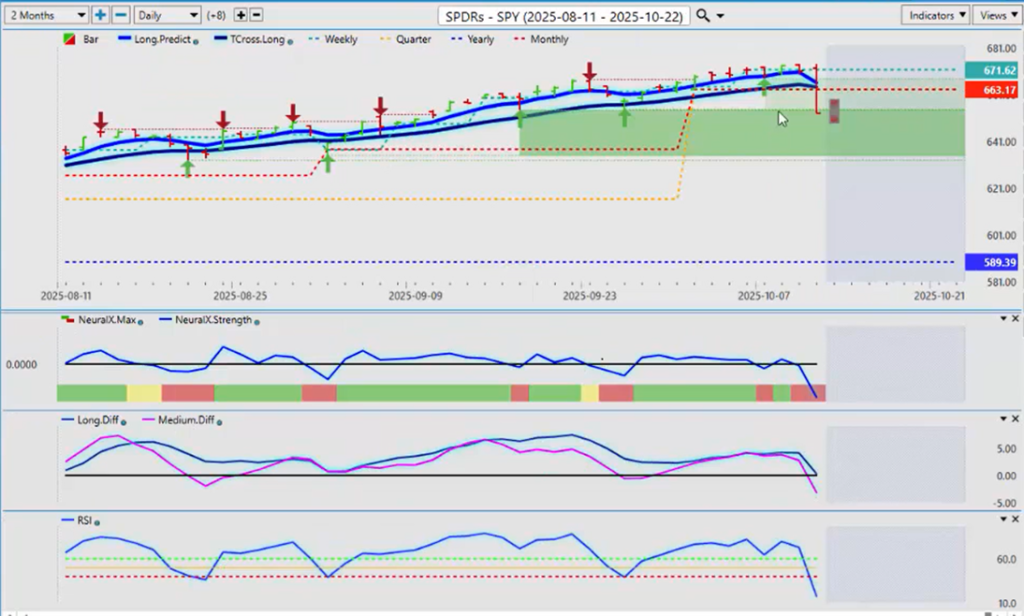
Now again, the SPY is having a big sell-off on Friday, and this is fundamentals, guys, that you can’t do anything about. I believe Trump will flip-flop next week and will back away from those tariffs, and then we turn around and go right back up again. But it’s certainly good to see these equity markets finally moving a bit lower when all they’ve really done is go higher in most calendar years.
So, the indicators in VP are bearish. But I believe if we can get back up above 66317, then the primary uptrend will remain intact. But again, I don’t want to stay below the monthly opening and the T-cross long at 66418. I don’t want to stay below this for any more than a few days here, guys. If we do, then we could see a bigger corrective move lower.
Bitcoin ($BTC/USD)
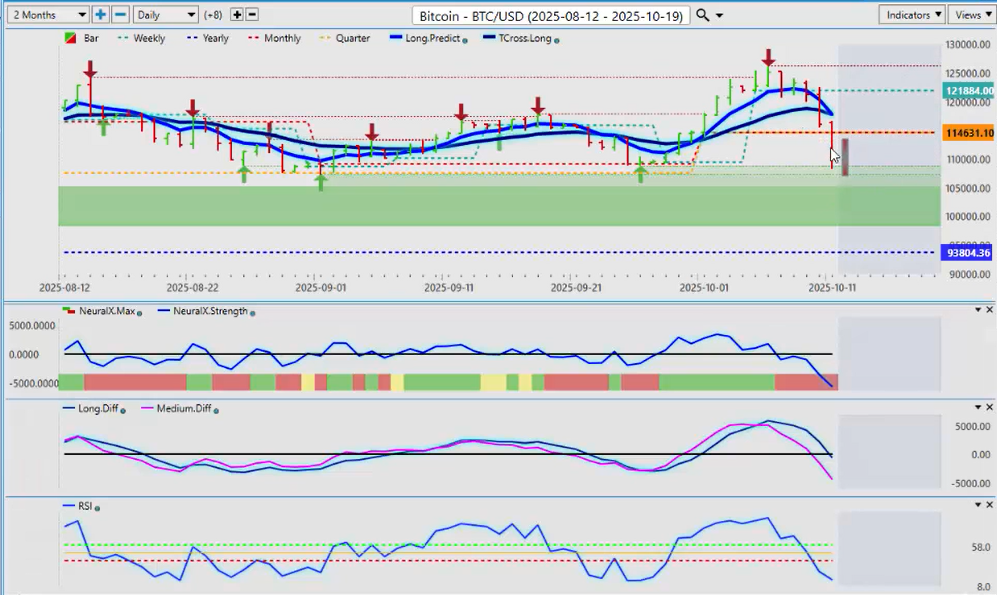
Now, when we look at Bitcoin, Bitcoin again taking a pullback with the equity markets. But again, Bitcoin has had a very strong October, as predicted months before this actually happened. I believe we’re still fine. And again, it’s perfectly normal for it to pull back.
The question here is: Is Bitcoin buying done for 2025? I don’t think so. I don’t think that 2026 will be the best year for Bitcoin, if we follow the three-year seasonal patterns — meaning three years up, one year down. That pattern has been in play now for probably 10–13 years.
So again, if Bitcoin is going to have a down year, it would be next year. So again, we just need to see if this is going to turn around, but this will have a lot to do with the tariffs. But even with the tariffs, Bitcoin has done very, very well in the calendar year.
So, if we look at Bitcoin over the last nine months, using that all-important calendar yearly opening price, Bitcoin has never been negative on the year despite the media comments, etc. So, we stay long when we can. But right now, it is somewhat at the mercy of the tariffs, etc. But I believe the market will get past that next week and likely start looking for longs on this again.
Oil/ Natural Gas ($USO)
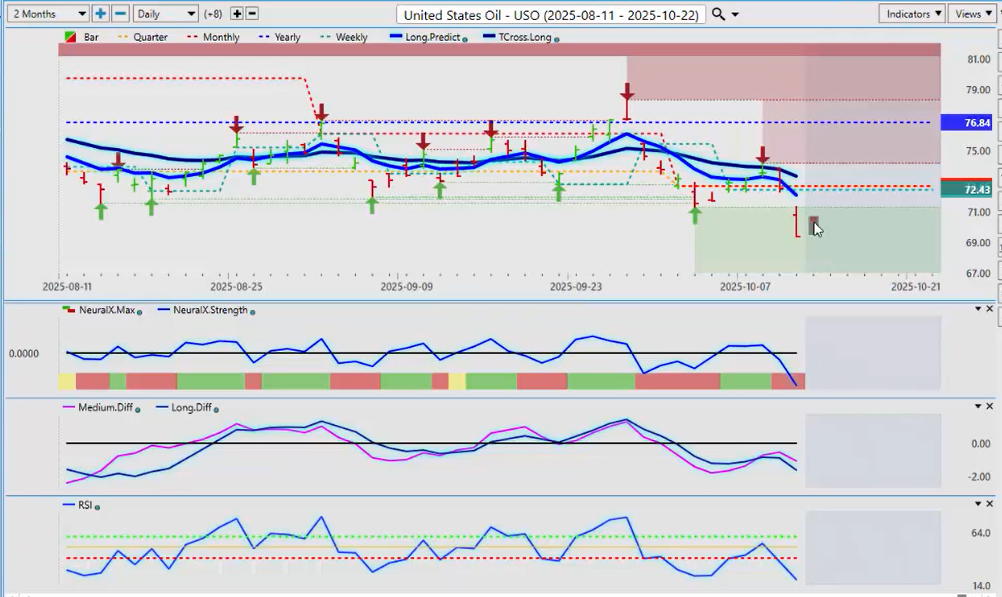
Now, Oil again — Oil reacting also to Trump’s announcement of potentially massive tariffs on China. Oil immediately tanked. So again, Oil — not really the time of year to be buying Oil anyway. We would buy Nat Gas at this time of year into the year-end.
But I do think that Oil will recover if the equity markets do. But right now, it’s still pointing lower. A very weak close here on the USO at — again, closing out at 69.39. And I believe the light sweet Crude Oil futures contracts are much lower than that — around 56 or 58. But either way, Oil has been bearish for months now, guys.
We’ve had a failure at the calendar yearly opening price in September. We had a brief move above the yearly opening price at the end of September, and the primary trend remained down. So again, we look to buy Oil usually March through July — not at this time of year either way.
DAX
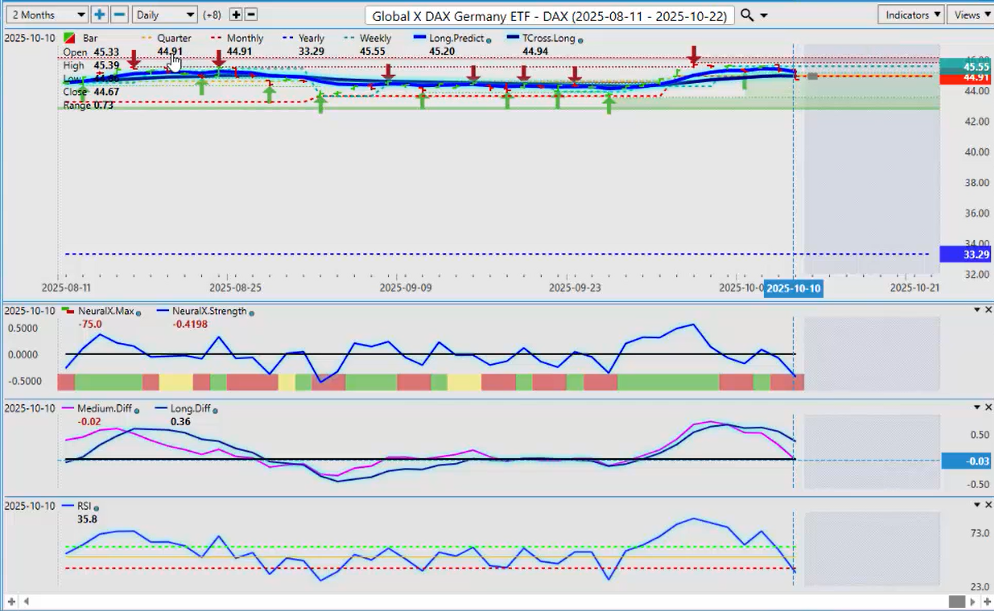
Now again, when we look at the global equity markets — also looking at the DAX — the DAX has held up, in my respectful opinion only, very well considering the pressure the euro has been under this past week. So again, any rebound there and we would see the DAX moving up, but the indicators are a little bit mixed here.
Predicted RSI showing some momentum. We have a medium-term crossover about to form right now. But the key level that you want to watch is that quarterly opening price — 44.91 — and the T-cross long at 44.94.
So, one of the ways that I would respectfully play this is to put a buy stop at about the 45 area, maybe 45.20 — just slightly above the long predicted. So, if it rebounds, you’ve got a buy stop sitting there waiting to go long. However, on the downside, I always like to give something to the bulls and the bears.
If this continues and we stay below the T-cross long at 44.94 for a couple of days, then it’s not likely a correction — it’s getting ready to move potentially, substantially lower. So, right now, we’ll monitor it, but I believe that the lower end of the verified zones that comes in around 43.50 is likely going to hold either way, barring some catastrophic event between the current administration in the U.S. and China.
Now again, what we also want to make sure of is that we’re looking at as many of these commodities as we possibly can in the weekly outlook because they’re all, in one way or another, tied to that Dollar Index.
iShares 7-10 Year Treasury Bond $IEF
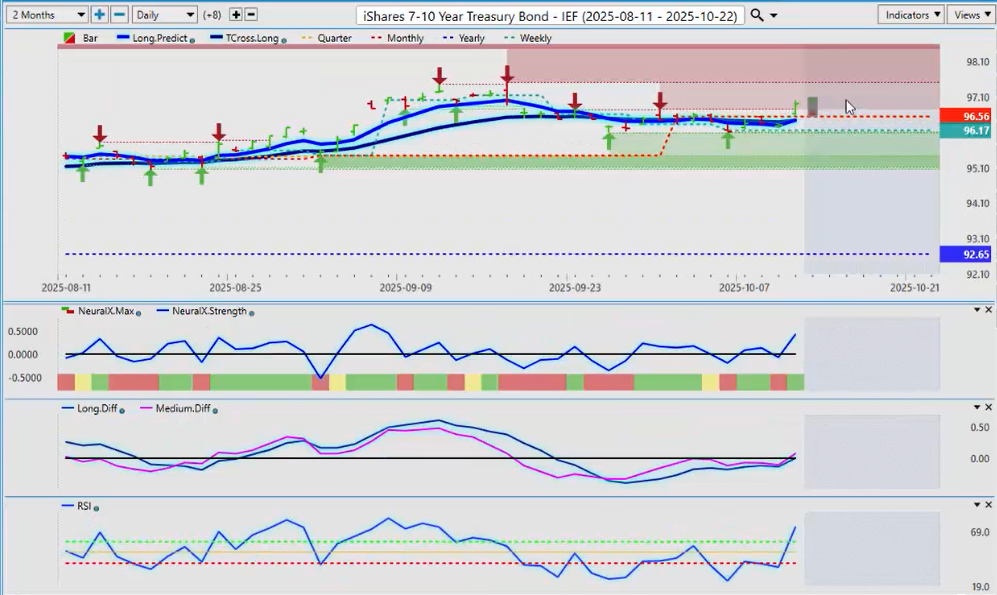
Now, what I do find unusual is there is an inverse correlation between IEF, the 7- and 10-year Treasury Bond ETF, and the Dollar Index. So, actually, the Dollar Index and this particular ETF have both moved up. Now again, I showed you guys the difference between the UUP and the USDU — the WisdomTree Dollar Index. So, this will be a very interesting week coming.
But I can advise that in the month of October, this particular ETF, the IEF, does very poorly. So, I believe that you could have a very strong sell here on this. But again, watch the dollar very, very closely.
Now, we’ll look at a few Forex pairs for this week. Basically, the Dollar Index is the driver of your main G7 forex pairs.
Euro versus U.S. Dollar ($EUR/USD)
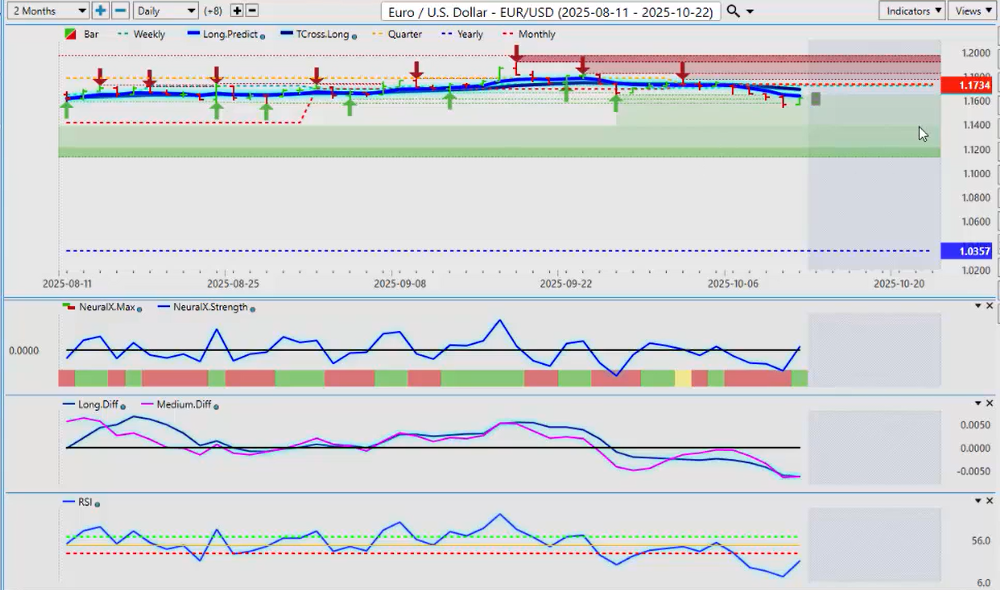
Now, the EUR/USD again coming under heavy selling pressure this past week. And you can see where this is happening — right along the current quarterly and monthly opening price. Now, the T-cross long has slipped below that quarterly opening price at 1.1734.
So, the resistance here is very easy to see if you know what you’re looking for — 1.1734 and our T-cross long at 1.1690. If you want to short, those are the two areas to do it. And if you want to go long, above 1.1734 is the place to do it. Because again, if we can’t hold below here, then we’ve got a problem.
Now, looking at the neural index strength and the MA diff cross, we’ve got a predicted RSI that’s rising. In my respectful opinion, if that predicted RSI can cross over the 50 level from oversold territory, then you have a long trade here. But we must clear 1.1734.
But the indicators are suggesting, if nothing else, we are going to retrace back to those two aforementioned levels.
U.S. Dollar versus Swiss Franc ($USD/CHF)
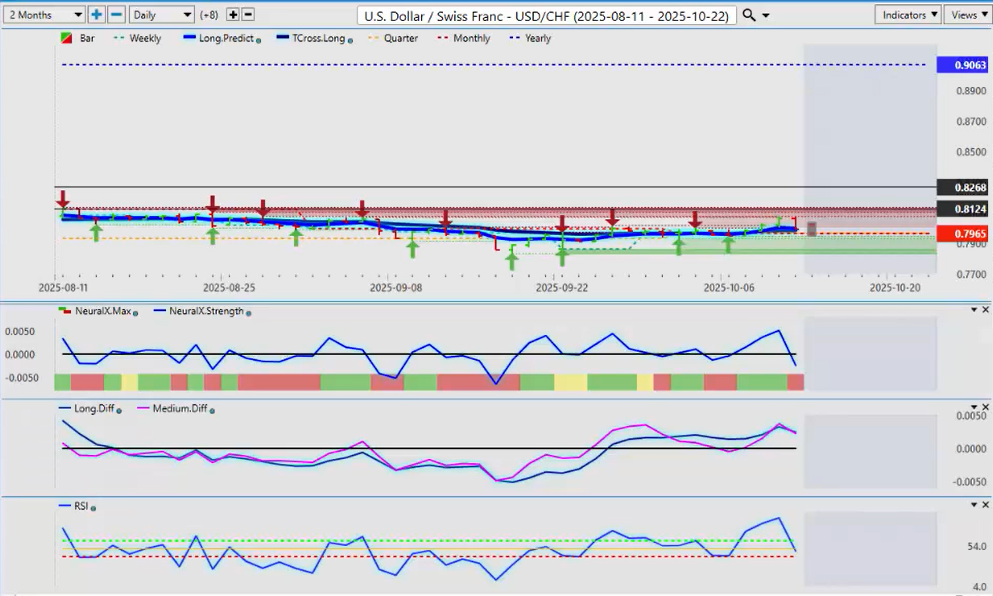
Now, the USD/CHF again — a very strong Dollar Index trade here, and as you can see, it’s holding the line here. But for next week — because again, this is an outlook, guys, not a recap of something that’s already taken place — this video is being done on Sunday morning at 11:00 a.m. while the markets are closed. I always need to point that out.
So again, when we look at this, the key support levels — 0.7965 and 0.7981. If we can hold above these two levels, then we go higher. The VP indicators are saying that we’ve got a bit of a problem here. So, this is the second chart in a row that’s pointing toward dollar weakness. But again, we must break through those critical levels — 0.7965.
Excuse me — that is the level I would keep a very close eye on. And again, you can also straddle this area. You can buy off that level, or you can have a sell stop ready to go below 0.7965. And if all of a sudden it snaps lower, you have a sell stop ready to go — and as it passes by, it picks up your order.
British Pound versus U.S. Dollar ($GBP/USD)
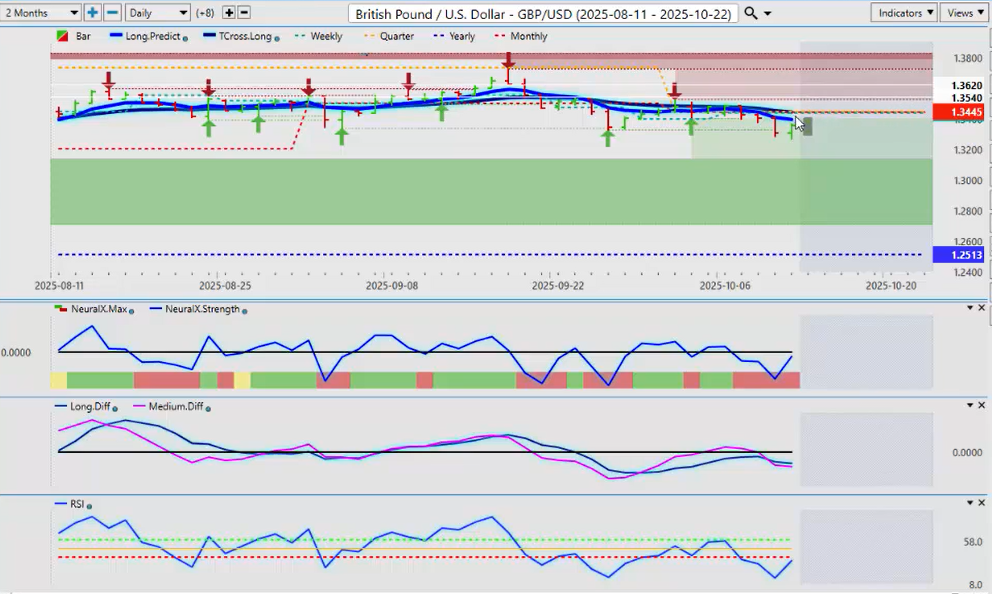
Now, the GBP/USD taking an even bigger hit than the EUR/USD. It’s trying to rebound here. But if I look at the British Pound versus the euro, I have to give the euro a slight nod here. But there are some signs of life here on the GBP/USD from a retracement standpoint.
Once again, guys, the main goal on these outlooks is to identify critical levels with a directional bias. So, that quarterly opening and T-cross long — 1.3442, 1.3445 — both the T-cross long and the quarterly monthly opening price are the exact same number.
So once again here, always trying to give something to the bulls and the bears. The bulls would be looking to buy above 1.3442. The bears would be looking to sell into 1.3442. So again, buying above it, selling while the market stays below that particular area.
And I believe we can retrace back up to that probably as early as midday Monday. But if it fails there, you know exactly what to do.
U.S. Dollar versus Japanese Yen ($USD/JPY)
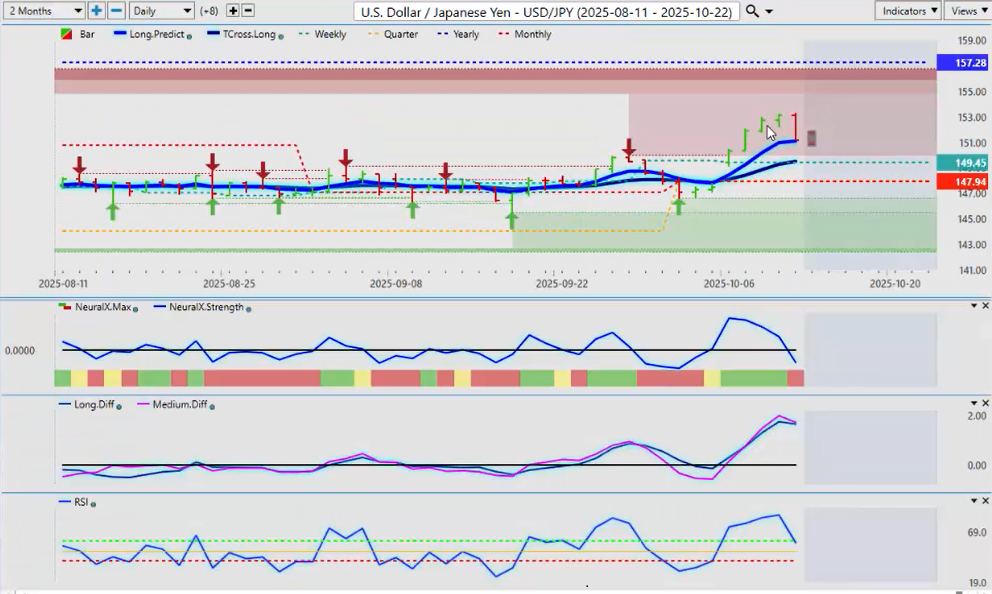
Now, the USD/JPY once again screaming higher — and for all the wrong reasons. Bank of Japan flirting around with intervention, elections, tariffs — a lot of stuff going on here. But once again, in my respectful opinion only, this pair is grossly overvalued, and the only thing holding it up here is the carry trade — the market wanting to stay long the dollar and short the yen to collect those swap payments.
And the second they decide to bail out of this trade, this thing drops hard and fast. So be very careful if you’re trading this particular pair under these conditions because, respectfully, there are far better trades out there than this pair, okay? And that goes double for the Japan cross pairs.
But for now, I believe that next week it’s highly likely we’re going to retrace back to the T-cross long at 134.49. It then becomes the question — can we break through that level? I believe into year-end we can.
Ultimately, the yen has historically also had a very high correlation to Gold, as has the Swiss Franc. So watch that correlation very closely. But the positioning of the neural index strength, the potential MA diff cross forming in heavily overbought territory, and falling predicted RSI — all of those things are warning signs.
Plus, above all else, what is the primary trend, guys? It’s down — 157.28. The USD/JPY, I don’t believe, has been positive at any time in this calendar year. No, actually, it hasn’t — the first few days in January, and this thing has only gone down since.
Now, from a technical standpoint, we have broken above this area again — 150.27 — but I don’t think we’re going to hold above it for the aforementioned reasons. So, we’ll keep an eye on it, but I think there’s better value elsewhere.
U.S. Dollar versus Canadian Dollar ($USD/CAD)
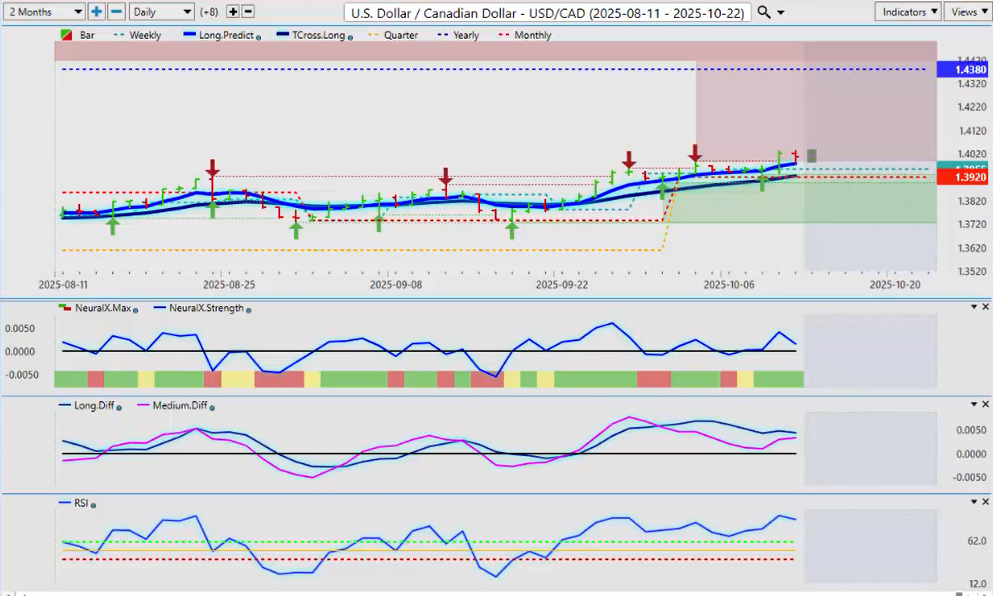
Now, when we look at some of our main equity commodity currencies — looking at the CAD/USD — taking a big hit again, penetrating through that 1.40 level this week. Moderately better unemployment numbers out of Canada, but the bulk of those jobs came from Alberta — not across all of Canada.
So, I think the market will realize that next week, and they will continue selling the CAD/USD until such time as there is a trade deal between the U.S. and Canada. And I think Trump is making that obvious — that’s not happening. So, the Canadian delegates left Washington yet again with no deal.
So, until there is a deal, USD/CAD longs are heavily favored. So, the critical levels that we need to hold for next week are T-cross long — 1.3924 — and our quarterly opening price — 1.3920.
So once again, a very good straddling opportunity. The bulls will buy at the T-cross long or the quarterly opening. The bears would look to short on a sustained break of that quarterly opening with the T-cross long. If we get that, then shorts are fine. I have no bias either way. That’s why I always like to give something to both sides.
There’s an argument to be made on either side — the long side or the short side. That’s what makes a market here, guys, right? So once again, know your levels.
Australian Dollar versus U.S. Dollar ($AUD/USD)
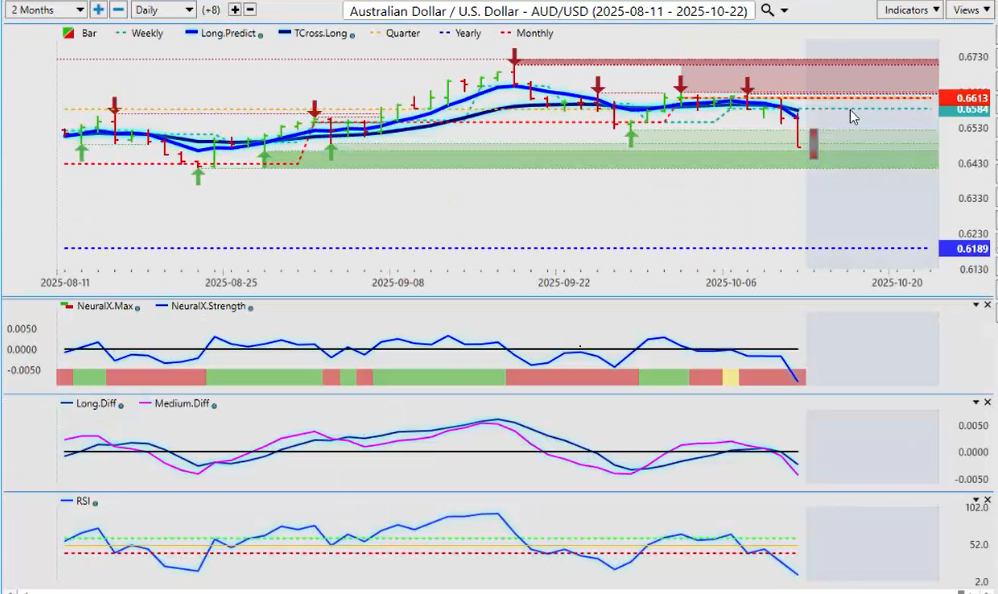
AUD/USD — when we look at that going into next week, the Aussie has tried to rebound, but Friday was just too much for it. So, very often the best thing I can ever tell you is that whatever took this down is the same thing that’s going to take it back up — and that’s Trump backing off the tariffs on China.
I don’t know if he will or not — I guess we’ll see. But any talk of things settling down between the U.S. and China, and this pair rebounds very quickly. But make no mistake, this is a fundamental trade — and that is what the main driver is going to be.
New Zealand Dollar versus U.S. Dollar ($NZD/USD)
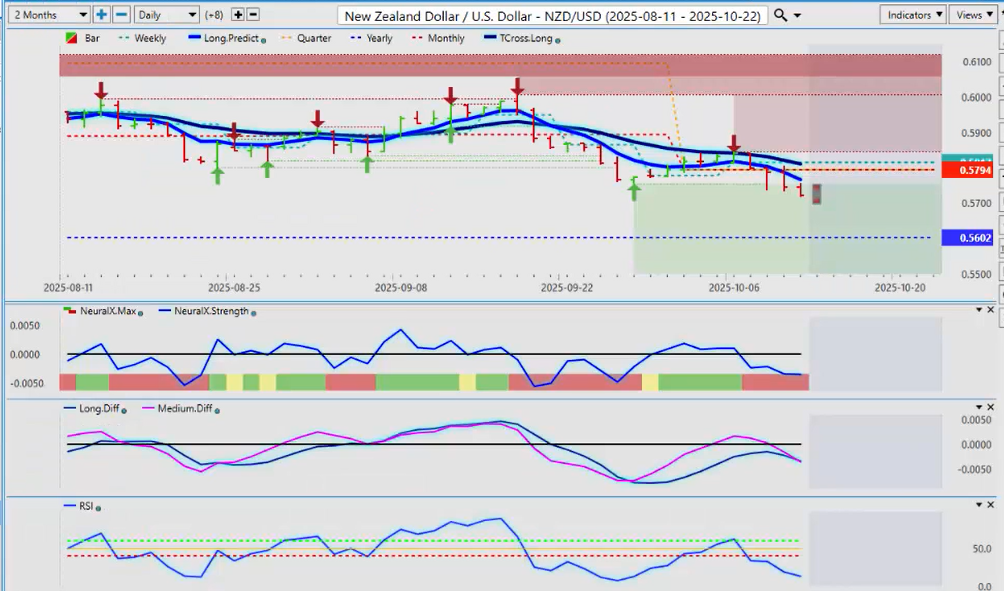
And the same thing is going to apply to the NZD/USD. The Kiwi in a little bit worse of a position here, but I would argue both the Aussie and the Kiwi are still positive on the calendar year, and longs would be heavily favored on the Kiwi near 0.5602 — if we can even get down that low.
And when we look at the Aussie, 0.6189 — there’s a lot more room for the Aussie to run than there is for the Kiwi. And I think the market has really exaggerated the Bank of New Zealand rate cuts, but that’s a whole other webinar here, guys.
So once again, expect another very choppy, volatile week. But with that, there will come opportunity. Keep an eye on the media announcements because I suspect there will be quite a few next week.
So, with that said, this is the VantagePoint A.I. Market Outlook for the week of October the 13th, 2025.

