


Welcome to the Artificial Intelligence Outlook for Forex trading.
VIDEO TRANSCRIPT
Hello everyone and welcome back. My name is Greg Firman and this is the VantagePoint AI Market Outlook for the week of October the 18th, 2021.
U.S. Dollar Index
Now, to get started this week, we’re going to begin where we always do with the U.S. Dollar index. Now, once again, the indicators we’re using this week, the 37-week look back. We’re using bars and our candles, our predicted short, medium, and long-term difference, neural index, point in time price, very important, our triple EMA cross, and of course, our verified support and resistance zones.
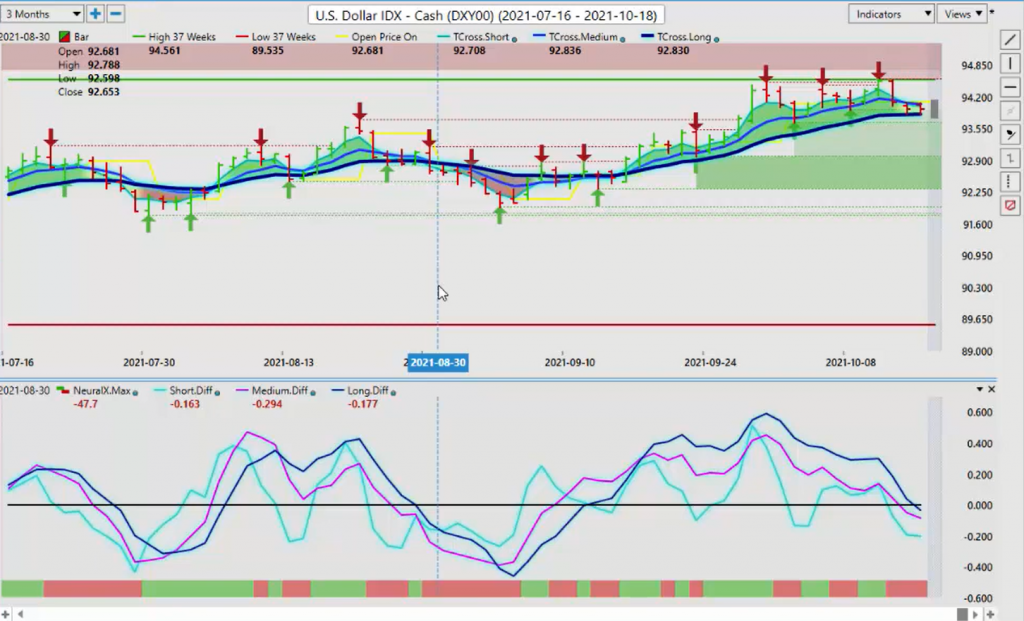
Now, we’ve come through the event risk of the Fed minutes. And again, the market didn’t really get that dopamine that it was looking for. Even though they’ve already interpreted that the Fed is getting more hawkish, the minutes didn’t give a clear direction as to when these rate hikes are going to come, so the dollar was a little bit softer. Now, we can see for two days in a row we are holding against this T cross long 93.84. This is going to be a make or break week for the dollar.
Now, what I’ve talked about in previous AI weekly outlooks is that we have a dollar cycle where the dollar is strong at the beginning of the month, almost every month, nine of the 12 months of the year. But then around the 20th of the month, the dollar’s a little bit soft again. We are approaching that in the next week. When we look at our VantagePoint indicators, we’ve got our predicted differences moving below the zero line.
Our neural index is down. But again, we are holding above the T cross long, which is a very, very important, in this case, a support level. When we look at our individual crossovers following the move down, we can see that our short-term crossover is moved to the downside with the predicted differences. Now, the predicted differences, again, measure the strength of the medium term crossover and the long-term crossover against each other, and they give us a directional bias as to which way this market is moving.
When we combine that with the patented VantagePoint crossovers, we can see that this move is highly accurate. Now, when we look at the medium term crossover, we do have a crossover taking place here to the downside. But again, that support level that I mentioned must be breached in order for this to continue lower. Now, the additional verified support low we’ve got at 93.67, the dollar is likely to find support down in and around this particular area. But first of all, we must break through that key T cross long if the dollar is going to continue lower.
Now, when we do a comparative analysis using inner market correlations to assist us with this. Now, one of the ways we can do that is, again, when we look inside the VantagePoint software and look at the main correlations, the positive correlations that the dollar currently has, the natural gas, British pound, U.S.-Aussie dollar, natural gas playing a big part with the dollar here obviously, U.S.-Swiss Franc and ProShares UltraShort Euro.
Now, when we look at it from a neural index standpoint, what the dollar actually is looking at inside or what the VantagePoint software, excuse me, is looking at is all of these different markets here that go between the futures, the ETFs.
NASDAQ Index
We can see all the different markets in here and that also stocks play a large part in this. When we look at our analysis from last week, it’s very important to look closer at this. Now, last week, we did a complete and thorough analysis of the NASDAQ. This was done a week ago, talking about how the NASDAQ is getting ready to move up.
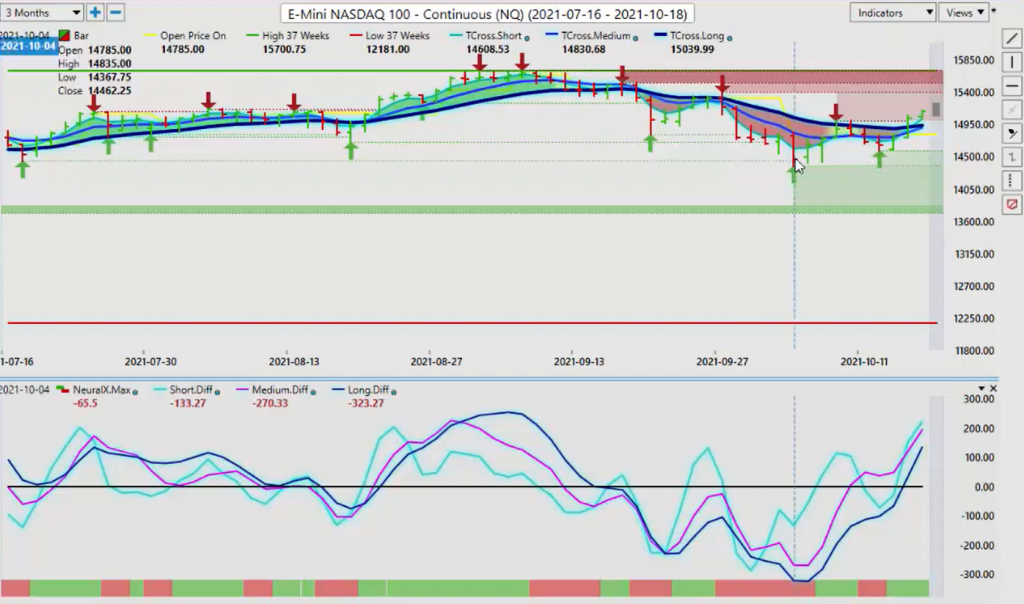
Now, we also did this live in the VantagePoint training room on Monday and on Wednesday of this past week. Now, what we were looking at is saying, okay, our predicted differences, the pink line and the blue line, show that the trend in the NASDAQ is starting to strengthen. Again, this was a week ago that we looked at this particular trade. This is the outcome of that trade. But again, utilizing all of the VantagePoint indicators, we can see that the trend is actually starting to show some life.
Now, the key point of when this really started to take off was on Wednesday after the Fed announcement. Using that point in time of the weekly opening price, the very second it broke above the weekly opening price, it extended higher. Then we broke above the T cross long. But earlier in the week in the VantagePoint live training room on Monday of last week where we were actually trading this thing in live conditions, we were actually exiting this trade at the T cross long. And the reason we were doing that is because we have resistance there.
The additional strategy that I suggested to apply was putting a straddle play on here that we buy up to the T cross long, then we close it out and we have long buy limit orders sitting above the T cross long. That was coming in at 14,921. The bit of concern I have here is that, again, that the market is moved largely based on its interpretation, or they didn’t get what they wanted from the Fed so it caused a short-term spike in the NASDAQ. But very often that’s how this game works, guys.
And an announcement like that is what we use to push the market in our direction, but we want to make sure we’re already in that trade. Last week we discussed in the NASDAQ that we have a verified support low at 14,437. We have another one, a series of support levels that are slightly below that, that we connect the dots to October the 4th. Then we see the market, the predicted differences, starting to rise with the neural index. Then we bring in…
Again, if we click on our F5, you can see in the VantagePoint live training room that I will use the predicted low to get into these long trades based around the complete analysis of the strength of not just the medium term, but the short, the medium, and the long-term crossovers are all showing strength here. That was the trigger to get us to buy off these longs, but exit at the T cross long and have that straddle play where we have buy limit orders ready to go if we break above the T cross long.
All of that came to fruition.
S&P 500 Index
We can assess here that the S&P 500 is the identical same trade as the NASDAQ virtually. They both spiked after the Fed minutes. All the global equities, or U.S. equities anyway, all spiked right after that Fed minutes because the market again is a little… They need that dopamine. They need that constant handholding from the Fed that, okay, when are you raising rates? When are you doing it? Well, the Fed didn’t signal a specific date, but I believe he probably will potentially as early as next month.
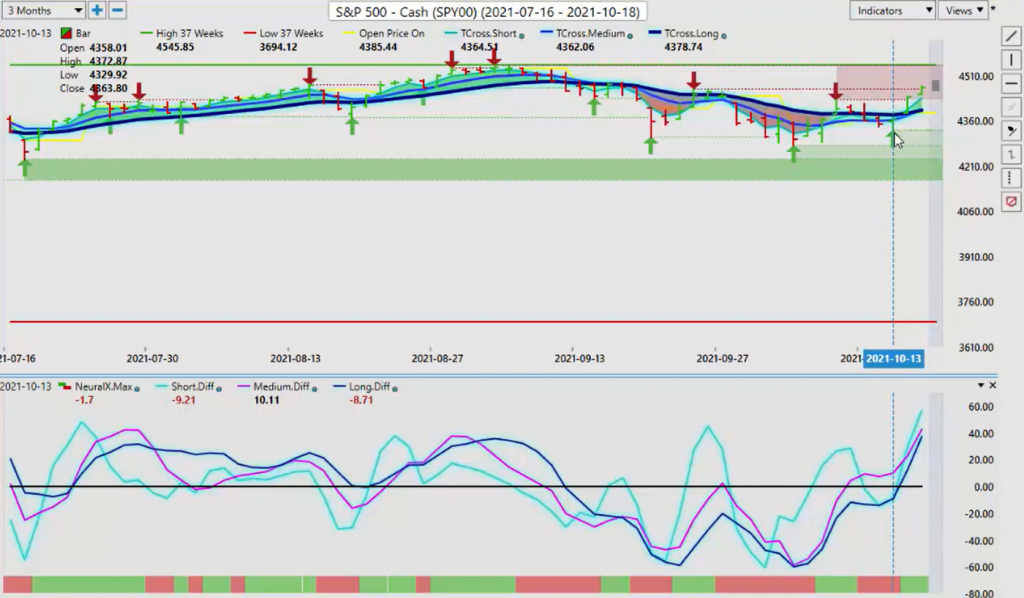
And that could let some of the steam out of the equity rally. Again, we always want to make sure when we see a spike like this because of the way the market has interpreted something, we want to be very cautious about that. Because if we look at the S&P 500, we’ve got pretty stiff resistance at 4,465, and even bigger resistance at 4,545, the all time high. Again, we’ll be watching this very closely next week. But in my respectful opinion, it’s going to come down to whether the dollar sells off.
If the dollar continues to sell off, that’s the inner market correlation you want to watch for next week. That would trigger an additional rally in the equity markets and further losses in the dollar.
Crude Oil
Now, when we do a comparative analysis again to the equities or to the oil contracts, excuse me, once again we continue to push higher here, but this entire move is largely based around China demand for energy. We’re sitting on the cusp of a potential energy crisis. All of these things are going on, but these catalysts keep pushing oil higher.
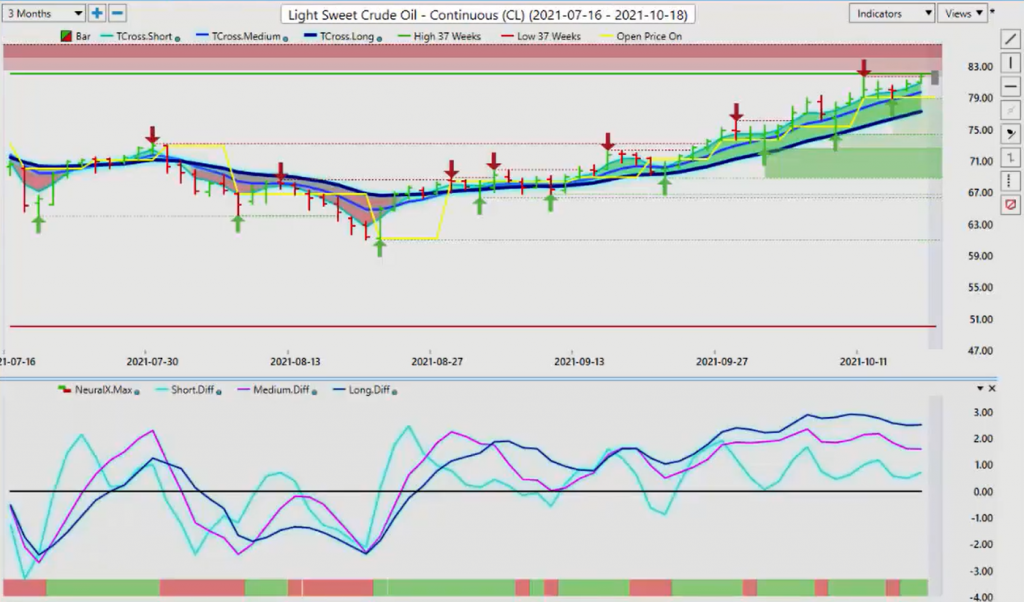
Right now our predicted differences are a little bit mixed here to be perfectly honest. They’re kind of running sideways, but still bullish. If we click on our F8 in our VantagePoint software, we can see how the market is actually hugging this particular level, on this blue line by itself. Now, again, one of the strategies that you can apply here is that if we click on our F5, we can definitely use those predicted highs and predicted lows.
Now, if I go down here and I go to predictive, I can actually put the blue line inside that predicted high and low, and then that gives me an additional level to look for. If the market’s above the blue line, we’re long. If it’s below the short line or below the blue line, we’re short. But we also want to look at that T cross long. In this particular case, over the last three or four days, particularly prior to the Fed, you can see that the market is hitting the predicted moving average by itself and the predicted low.
This helps give you a directional bias in which way to trade something and if it’s truly bullish. As long as oil at the start the week holds above the actual long predicted, excuse me, of 80.18, then oil would continue to extend higher. But again, that is also going to depend on the global equity markets.
Gold
Now, gold got a bit of a bump here. And what I found once again very, very suspicious is that gold made a big spike up on Wednesday morning prior to the Fed announcement. That tells me that that information was absolutely leaked.
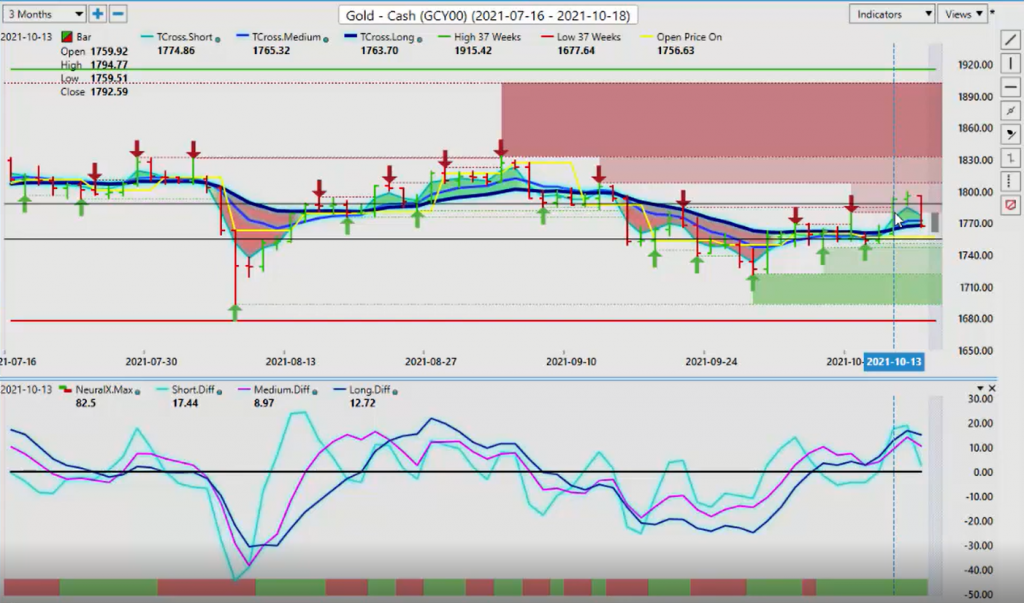
Why else would they go into gold just blindly prior to a Fed announcement? But as you can see, once the news wore off or the market started to forget about it, gold immediately had a very negative reaction. As stocks moved higher, Bitcoin moved higher, but gold is stalled at the T cross long at 1,767. And again, doing the comparative analysis between gold and the dollar, one of these two is going to break to the upside or the downside. Again, this is kind of a tell here.
Now, again, our predicted differences, the slope of that, is starting to point down, but the neural index is still holding here. Now, that level of, again, that T cross long coming in at 1,767 is very important. But if we click on our F8, you can also see that now we have closed below the long predicted. That’s a potential warning sign here, but the very fact that we had a big spike up and then a big spike down to finish the week.
But always remember too, the yearly opening price is a very important non-indicator to use because gold has never been above 1,904 for any more than a day or two this entire calendar year. For someone to say that gold is bullish, that’s a stretch here, guys. If you bought it on January 1, you’ve consistently been losing money. That’s just a fact. That’s what the charts tell us. We always want to keep that in the back of our mind. But for now, right now, 1,767 is the level to watch.
Bitcoin
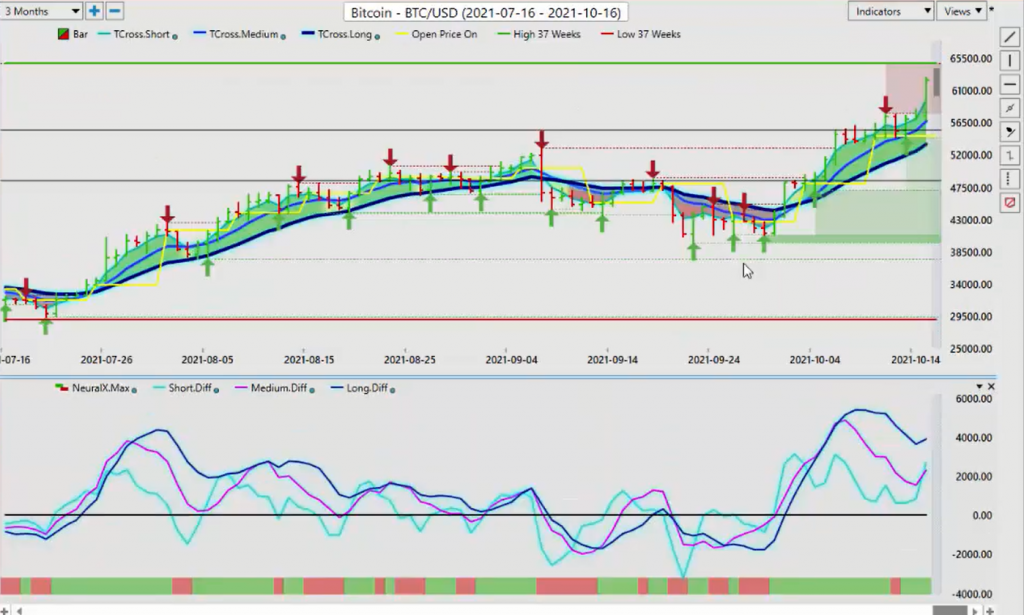
Now, once again with Bitcoin here, VantagePoint continues to shine when it comes to Bitcoin, and it continues to mock people like Warren Buffett, like Jamie Dimon that continue to make these frankly negative comments, negligent comments regarding Bitcoin. Bitcoin has again been the number one investment in 2021. And at the time I’m doing this video, Bitcoin I believe is sitting around 62,000. Once again, this has been a fantastic call. We had our triple EMA cross back here at the end of September. These are very, very significant gains.
Now, again, you’ve had recent comments coming out last week, this time from Jamie Dimon saying that Bitcoin has no intrinsic value. He doesn’t believe that it’s going anywhere. He’s very, very negative on it, but then at least we had some competent reporters that asked the question, “Well, why are you offering investments in it then?” And it was kind of like a deer in the headlights moment for him. He didn’t really have a response other than to say, “Well, if my customer wants it, then I’m going to provide it.”
Well, if you’re advising them, then you would be advising them not to buy it or not even invest in it. Again, guys, we need to focus on the charts when it comes to Bitcoin and really understand that over the last 10 years, Bitcoin has put every other market to shame with an annualized returns of about 230, 240% per year. There was an excellent article in the VantagePoint blog that they discussed this about comparing it to fiat currencies, to gold, to some of these other commodities. And it really does open people’s eyes when you have positive, when you just look at the charts.
Right now with Bitcoin, yes, we are making a very, very big move. If we click on our F8 here, the level we’re going to watch to start the week is 57,749. We’re looking to hold above that so Bitcoin can continue to rally here. But again, a very, very strong move. When we click on our F5 in the VantagePoint software with this strong move here, not only can we use our… I’ll show you this guys again. This is another trick. We put our long predicted right inside. Okay?
And when we look at our predicted high and predicted low, we use our long predicted, the predicted moving average, that will either run inside the predicted high and predicted low or just outside of it. We can use that as a place to put stop losses or for additional entry points, because you can see that we slipped below there in very, very high volatility. We slipped just outside the predicted low, but we didn’t break the long predicted.
This will give you that added security that you need for these entry points to know where to put your entry point and to keep your stop below the long predicted, not just using the predicted high and predicted low. Because the long predicted, as you can see, the market is in constant contact with this number almost every single day. And when it’s not, that usually means it’s going to retrace back to it, like a moth to a flame. Again, it’s very difficult to script something like this when, again, you follow this up and it happens across many, many different markets.
This could be a little bit of a stretch going into Monday, or on Sunday I should say because Bitcoin’s trading over the weekend, but the predicted low here is going to come in at 60,316. But again, that’s a weekend rate, but it’s still showing a very, very strong move. My concern is when I see a big break of the predicted high, that usually screams of a retracement back to the long predicted at 57,749. Now, as we look at some of our main Forex pairs this week, again, we’ve looked at the equities. We’ve had a very, very good entry on the NASDAQ from a week ago.
If you’re just going into the NASDAQ now, you maybe a little bit late to the party. I guess we’ll see if we can extend, but that again is going to depend on the dollars. We look to these currency pairs to further assist us in what’s happening.
Euro versus U.S. Dollar
Right now the Euro is once again pressuring the T cross long. The only thing stopping the Euro from advancing is the inner market correlations with gold. Gold is a tell here for our Forex traders, because if gold is moving lower, chances are the Euro is going to get dragged down with it.
When we look at our T cross long 1.1621 is the level we want to watch to begin the week. We have our predicted differences rising. We have our neural index. The question is, is some of the pricing through the inner market correlation slightly distorted because of that Fed minutes on Wednesday and the way the market’s interpret it? A little bit of profit taking, all these different things.
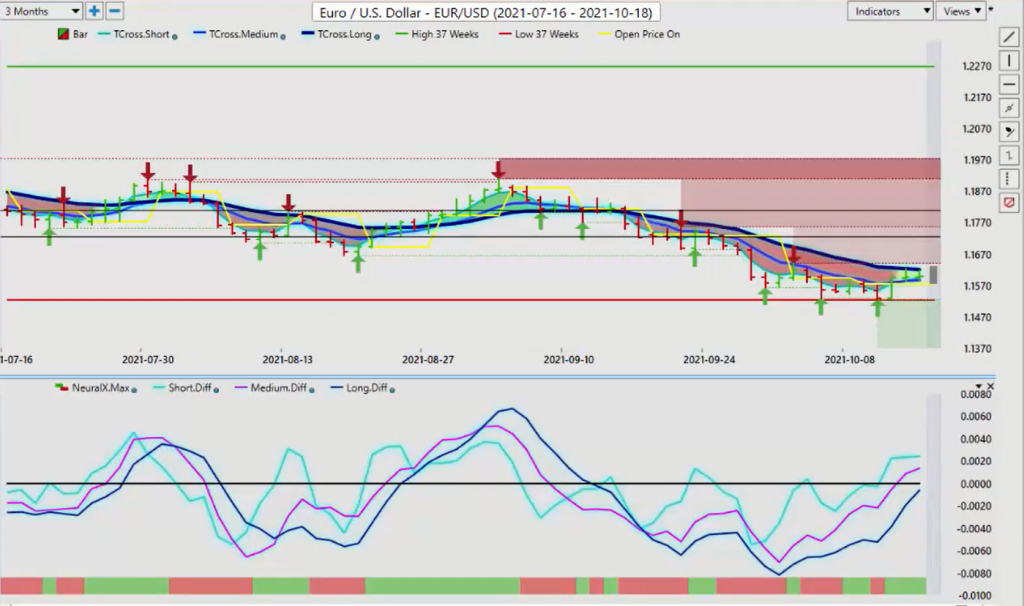
So to begin the week, we’re looking for a break of 1.1621, but we’re going to need the dollar index dropping below that .9380 market if the Euro has any chance of extending higher. Now, again, when we look at that seasonal standpoint or seasonality or month over month, what I’ve mentioned on many times is that I have seen the dollars selling off on the 20th of the month only to recover the following week as we go into institutional buying.
So for now, there is a slight risk to the upside that the Euro could break through here in the coming week, but you will know that because the key level is 1.1621. If you’re a short, if you still believe that the dollar is going to strengthen, I’m not going to dispute that, then you would sell into 1.1621, or if you don’t believe that, I would be putting a buy limit order just above the verified zone, the high 1.1640, or just above the VantagePoint T cross long, and that one is that level is coming in at 1.1621. Now, the counter to that would be U.S.-Swiss Franc.
U.S. Dollar versus Swiss Franc
If the dollar index can recover, then the dollar, then we would see strong buying on U.S.-Swiss Franc between the low of .9215 and the key level, which is these verified zones we’re identifying down at .9163. But as you can see, that our medium term crossing our longterm predicted difference has crossed to the upside. In my respectful opinion only, when the neural index goes from red to green, that will trigger a buy signal. But again, trading this pair is almost identical to trading the dollar index.
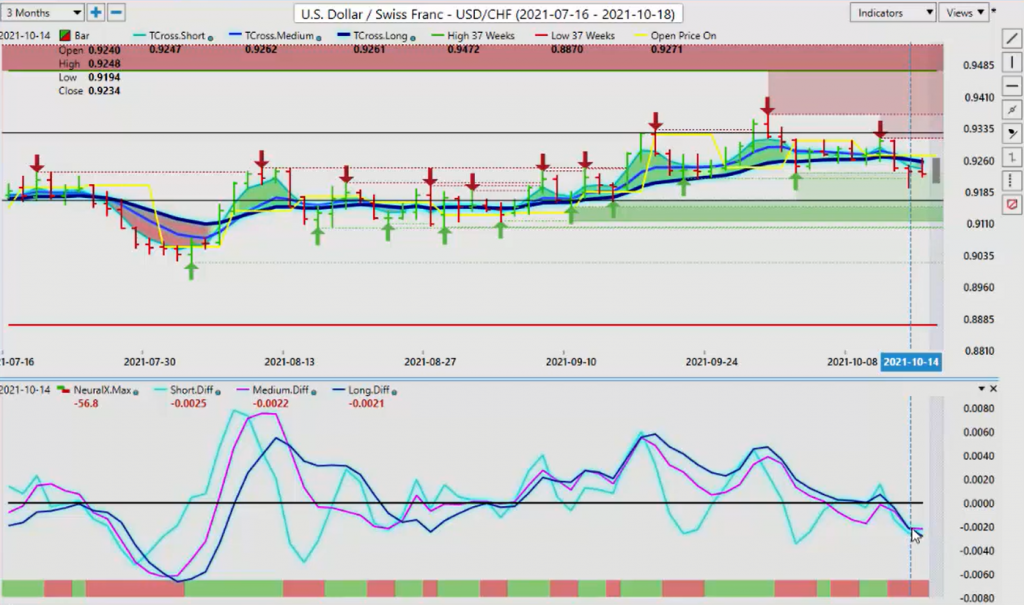
When we look inside the neural index, we can see with the U.S.-Swiss Franc that we’ve got Euro-U.S., we’ve got the dollar index, we’ve got the PowerSharaes Qs, Japanese Yen, New Zealand Dollar, the S&P 500. This is a very, very interesting setup. But when we look closer at the inner market correlations, the dollar index has a 77.96% positive correlation to this particular pair. Again, if the dollar index can hold that .9380 mark, then the U.S.-Swiss Franc would be getting ready to reverse.
British Pound versus U.S. Dollar
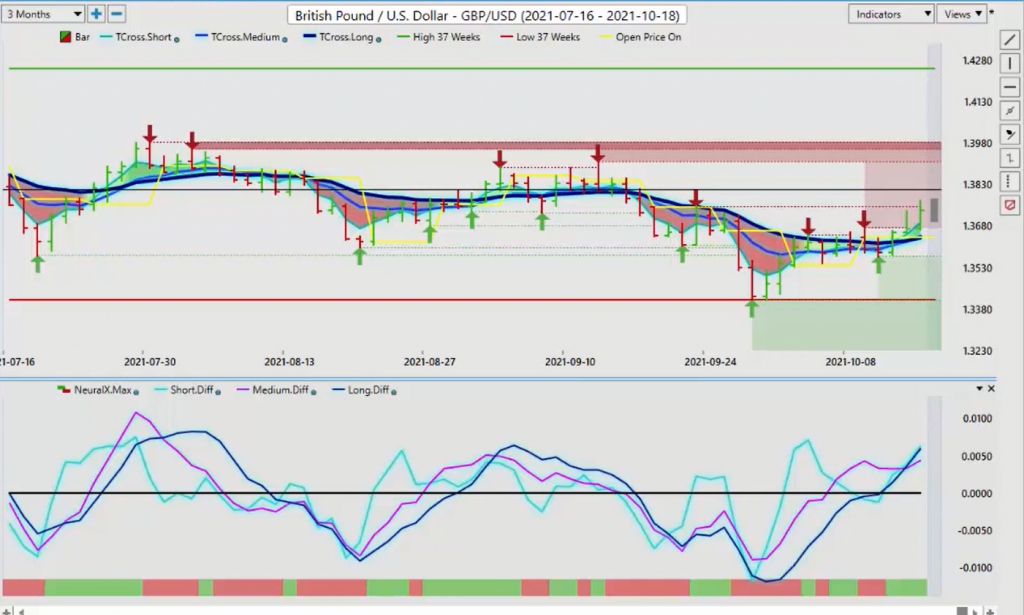
Now, as we look at the pound-dollar, once again, most of these currencies getting a boost after the Fed. You can see it on Wednesday. The primary trend on the pound-dollar was intact until we got the Fed minutes and that pushed it higher. In 80% of the time, when the market responds to something like that, it very often reverses shortly thereafter. We have very, very strong resistance up here on these verified zones that go up to the high of 1.3750, and even stronger resistance up to the high of 1.3912. This particular area would be looked at for a potential short.
Now again, we can see that our medium term crossing the long-term predicted difference did cross on Thursday, warning us that maybe this pound is not as strong as what we think it is and maybe this is just from the Fed minutes. And once the market has forgotten about the minutes and has gone back and looked at the actual Fed press conference and starts focusing on that, like rats leaving a sinking ship, they will start moving potentially back into shorts on this pair. Again, we’ve had very, very stiff resistance for a considerable amount of time.
And again, once we look at this, we want to make sure we understand that. And even with the dollar index, I usually show that, and I’ll show it one more time just so everybody can see where we’re actually at with the dollar. We’re in a very, very long-term channel here. That goes all the way back to. September the 28th, 2020. But remember, we had COVID here guys, right? So this is not necessarily the same situation. The Fed potentially moving the dollar away from a funding currency. If they raise rates, then there’s a possibility this channel is going to break.
But make sure that before you ever take a short-term position or any position that you look at the overall structure of the market. And the structure of the dollar index is we’re in a long-term channel here about the 94.70 mark. On the downside, I would argue it’s coming in at or about the 89.76. The dollar has been above its yearly opening price the entire calendar year for the most part. It’s had retracements, but it still carries a bullish tone to it. So again, we want to be very mindful of that going into our Forex trading for next week.
U.S. Dollar versus Japanese Yen
Now, with the dollar-yen, the dollar-yen is basically in a full-blown breakout play here. We’ve discussed this in the AI weekly outlook for months now. This channel resistance at the high as finally been broken. They broke it again here. This was a big one at this high at 112.08. They pushed through, setting a new high all the way up into the 114 area. This is usually indicative of further dollar strength. A number of larger institutional funds will use the dollar-yen as a barometer as to how strong the dollar is.
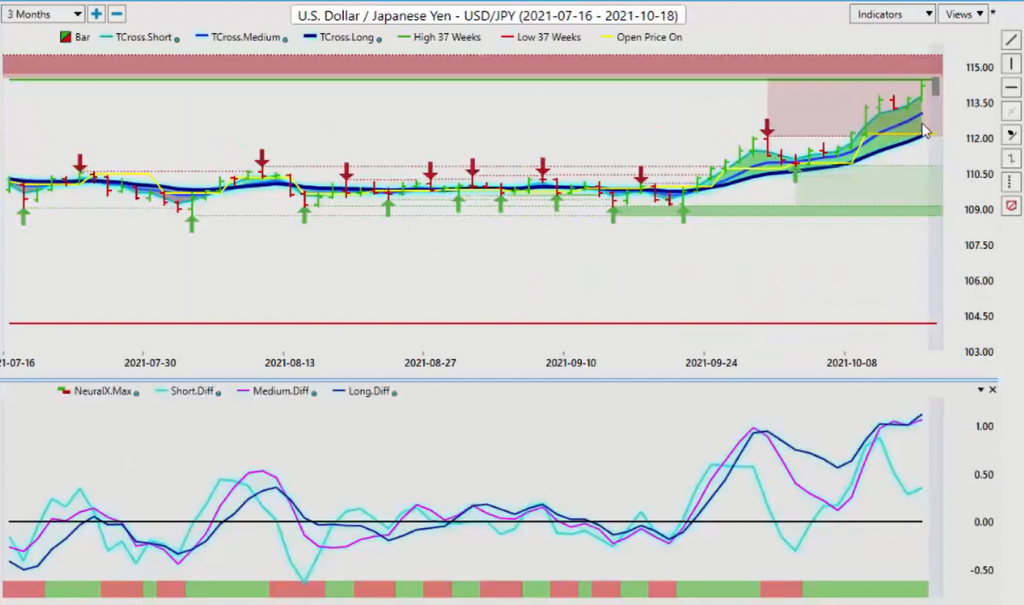
So again, we’re still looking good. Maybe a little bit over done up here. But to begin the week, we’re going to watch our long predicted at 113.28. If this trend is real, then we’re going to extend higher. But once again, when we go back and look at the dollar-yen over a year, then we keep coming back in the VantagePoint software to look at these verified zones. And this was a very, very large resistance at 112.22, which they blew rate through. We set a new 37 week high here. So again, we keep going back to look to see what the structure of this looks.
It would appear at least at hindsight that we’re going to continue to advance here, which we are, breaking through the high of 113.70. Now, we can just keep going back until we find additional resistance areas. This one now coming in at 114.55, and that goes all the way back to 2018. If we go back to 2017, we’ve got about the same level there, 114.50. We may have a short opportunity at that particular level, but we’re going to rely heavily on the VantagePoint levels once we get to there, if we get at that particular level.
U.S. Dollar versus Canadian Dollar
Now, the U.S.-Canadian pair has had a big rundown here to the downside this past week, and that’s largely due to energy, energy, energy when it comes to the CAD. But the CAD also needs the equity markets moving higher. Right now, if we see any kind of reversal coming in the U.S.-CAD, that would be a warning sign the dollar index is getting ready to go higher and stocks are getting ready to go lower. We’re going to continue to monitor this, but we lost a major support level at that 1.2422 area. The question is, can we get back up inside this channel?
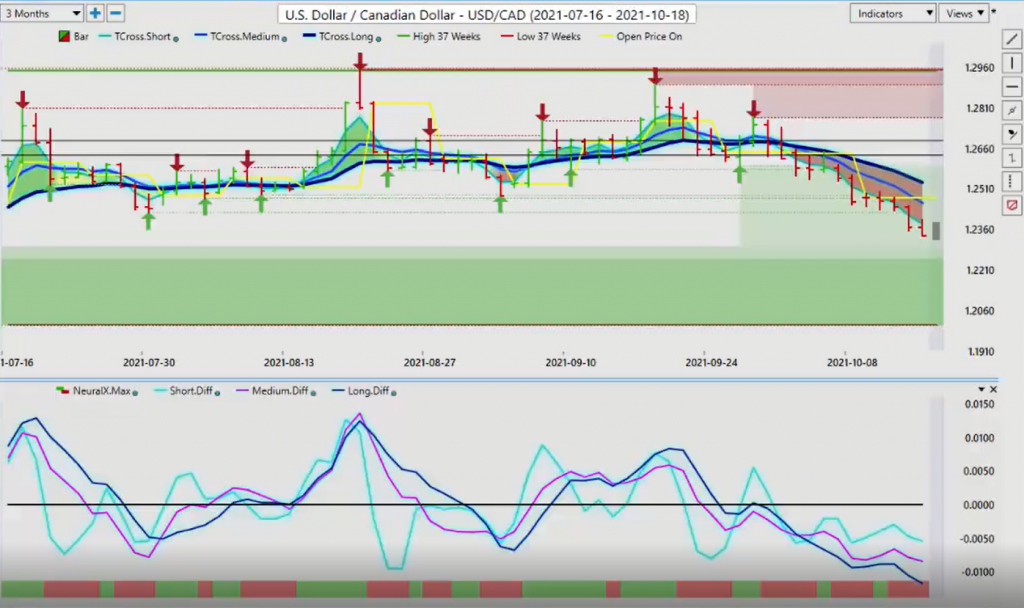
Right now the VantagePoint, despite the fact that we’re heavily oversold here on this pair, we’ve been heavily oversold for a considerable period of time, that is not stopping sellers from pouring into this particular pair because of energy prices. So again, if energy prices and stocks cool off, then this pair will cool off and we’ll start moving higher. But for the time being, the key level to start the week here, our long predicted 1.2430, that’s the actual breakout point.
If we’re holding below 1.2430, then we’re likely looking at a much deeper target to the downside, probably towards the 1.20 area. Now, again, this is a weekly outlook. That’s all it is here, guys. I’m not forecasting all the way out to the end of the December. Who knows what could happen with the Fed, with energy prices, with China, with Taiwan? There’s a million different things that could happen. We always look at this from a week to week, month to month basis.
Right now if I’m backing this off to where we are, we look at this on a year-over-year basis, I cannot rule out the 1.20 level at this particular time. The only thing that could potentially stop it is around 1.2282 or this coming week or next week if we can get back up above 1.2430. But at the current time looking at energy prices, that appears very, very unlikely. Now, when the big banks forecast, they forecast three months out.
Australian Dollar versus U.S. Dollar
So therefore, casts are that Aussie-U.S. was supposed to be at 70 cents this week. It’s not, guys.
It’s at .74. So again, you don’t want it to go too far out in your forecast. Week to week. Month to month. I don’t go day to day, but I go week to week, month to month. So right now the Aussie is coming up against a pretty stiff channel. Now, we can also use this one as a barometer to gauge how those stocks are doing, the S&P the NASDAQ, the global indexes. If the Aussie starts selling off, we could see the S&P 500… That could be a leading indicator for the S&P 500 and the NASDAQ. Keep an eye on this pair. But for now, it’s bullish, but it’s a very ominous signal here.
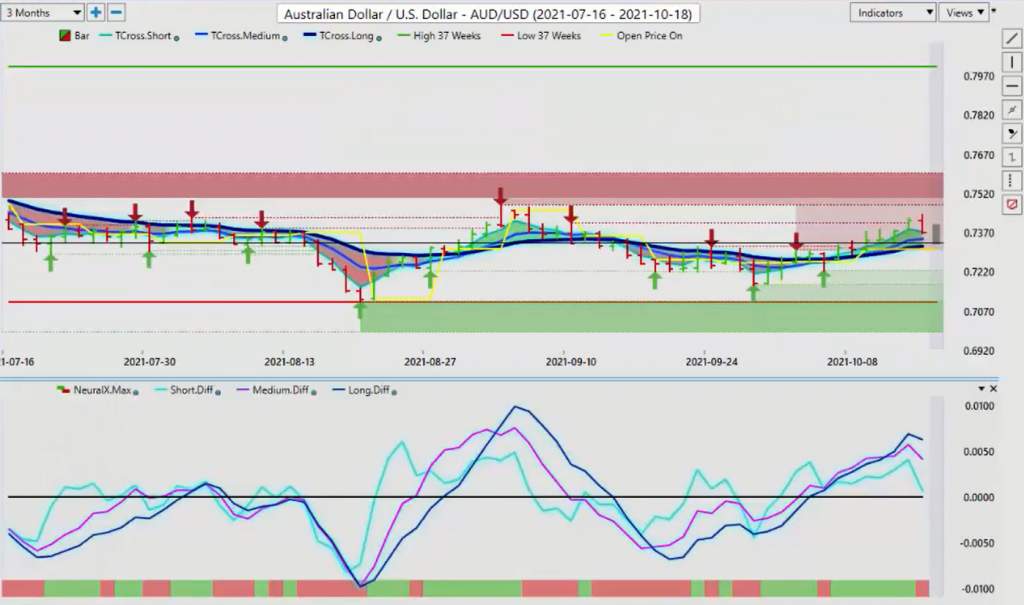
The medium term crossing the long-term predicted difference to the downside. Both of the slope on these two is warning us our neural index is picking up based on the correlation of 31 other markets, some of which I can show you right here. Again, you can see the top 10 correlated, the top 10 inversely correlated. Once again, when we look at this, the inverse correlation here, it’s important that we monitor it. Because again, stocks always play a big part.
When we look at the internals of the Aussie, it’s still a large player here in the Pacific realm side, because it tells us how the stocks are doing. It’s got a high correlation to China. Right now, these are just some of the markets that VantagePoint uses to forecast these that we can see, but we can actually break it down into the exact one. The inverse correlation, you can see the dollar index. If the dollar index recovers next week or the week after, then the Aussie could be a premium short at these particular levels.
New Zealand Dollar versus U.S. Dollar
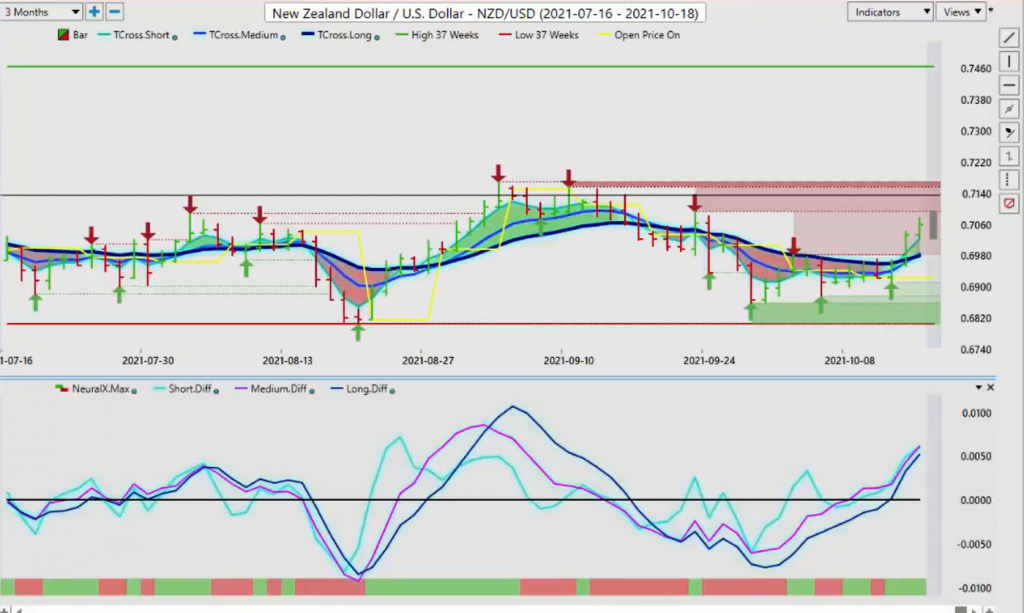
The same thing would apply to New Zealand, guys. It’s virtually the same trade. You can see that New Zealand still caught between the highs and the lows over the last three months, the high being .7169, the low coming in at .6805. We’re very much trading within the overall range here, but I would be watching the stocks very closely. This swing high at .7093, if it’s going to fail, it’s going to be between .7093 and this upside resistance at .7169. I would argue that that is an excellent potential area to start setting shorts.
With that said, this is the VantagePoint AI Market Outlook for the week of October the 18th, 2021.


