


Welcome to the Artificial Intelligence Outlook for Forex trading.
VIDEO TRANSCRIPT
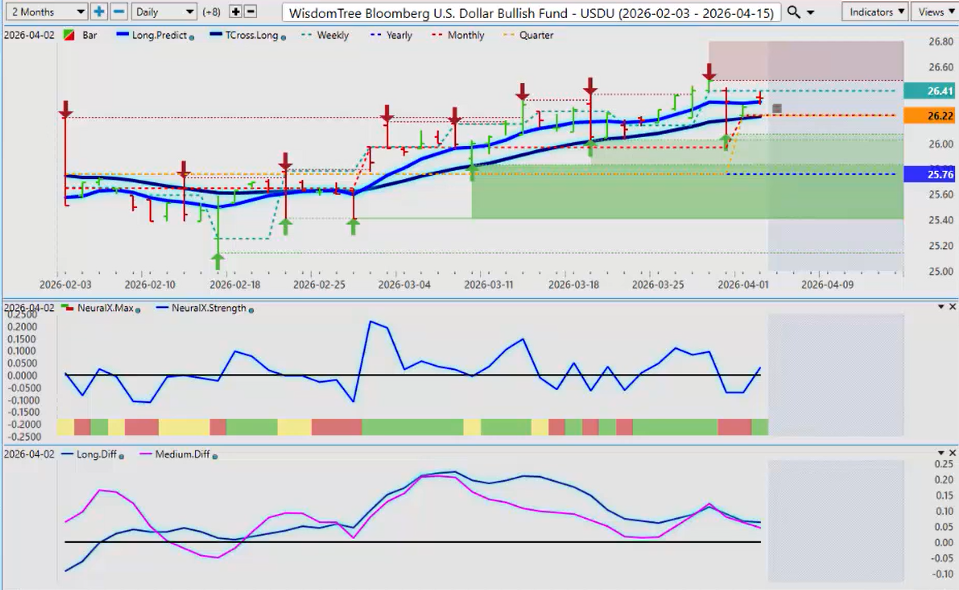
Wisdom Tree US Dollar Bullish Fund – $USDU ETF
Okay, hello everyone. Welcome back. My name is Greg Firman and this is the Vantage Point AI Market Outlook for the week of of April the 6th, 2026.
Now, to get started this week, we’ll begin where we always do with that very important US dollar. Now, we’re coming off the non-farm payroll number. I believe you’re going to have a very volatile start to the week where a large group of people believe that that number was good and a number of other people believe that that number wasn’t good.
Now, the jobs number in the US came out at around 170 73,000. The problem is you had had 135,000 downward revisions. So, that’s not exactly a strong number in my respectful opinion and on top of all that, the U6 number has gone up. So, this is all about interest rates. Will the Fed hold? Will he cut? Will he possibly hike? In my respectful opinion only, it’s a dollar negative, but the initial move out of the gate on Monday will support the dollar.
Now, using the USD, we’re above the yearly opening price. We’re currently above the quarterly opening at 2622, but I believe that it’s very likely by Tuesday, Wednesday we will lose that particular area as the market looks closer at those numbers and questions how strong the labor market really is. Now, VP is giving us a warning of that with an MM diff cross to the downside.
Just a question now, can we hold above that? But, all of your support on the dollar next week will come in at 2621 where that quarterly opening price resides. If we lose that particular level, then that will confirm a somewhat bearish biased for the dollar, but again, it’s all in how the market is going to interpret that payroll number in thin illiquid markets on Friday.
Gold ($XAU/USD)
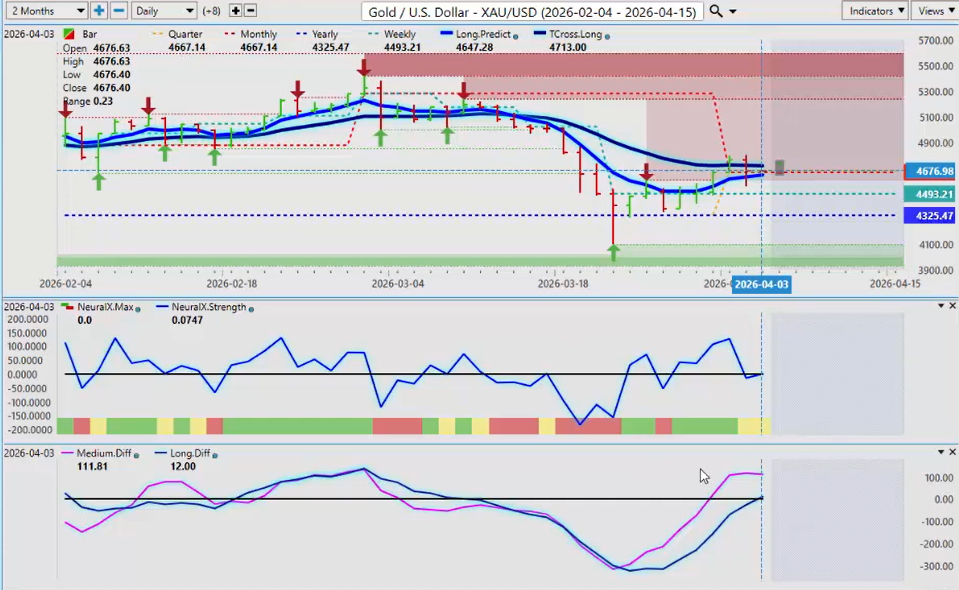
Now, gold has reacted failing on Thursday and on Friday. But again, markets closed on Friday. You can see that the T cross long there, 4713. That’s our key resistance to start the week. Again, we want to watch this quarterly monthly price very, very closely as we start the second quarter at 46,067. That’s the critical level.
Now, the VP indicators, we have a medium-term crossover which is the pink line going above the zero line. And we have a long-term crossover to the upside also that’s just in progress right now on a Saturday afternoon at 1:24 because again, this is an outlook, guys, not a recap of something that’s already happened.
We’re looking forward into next week with key Vantage Point levels and determining whether the market can hold above that or below that depending on the on the market. Now, gold, the yearly opening price, 4325. You can see that we are yet to close below that area. We pushed down below that, came back up, hit the yearly opening price again, and now we’ve moved higher.
But, this is currently a retracement back to that all-important T cross long. We must break through this critical level next week, 4713. We’ve got the payroll number. Again, I I’ve I’ve given the the positive is that is 178,000 jobs. The negative is there’s 135,000 downwardly revised from the previous previous month.
So again, not a strong labor report in in in my view. And I think our our rolling 3 months is only about 50,000 new jobs in total over 3 months. So, I really don’t see how the Fed can spin this into a rate hike or even staying on hold. But again, the market will decide that probably by Wednesday of next week. But remember, gold remains a long while above 4325.
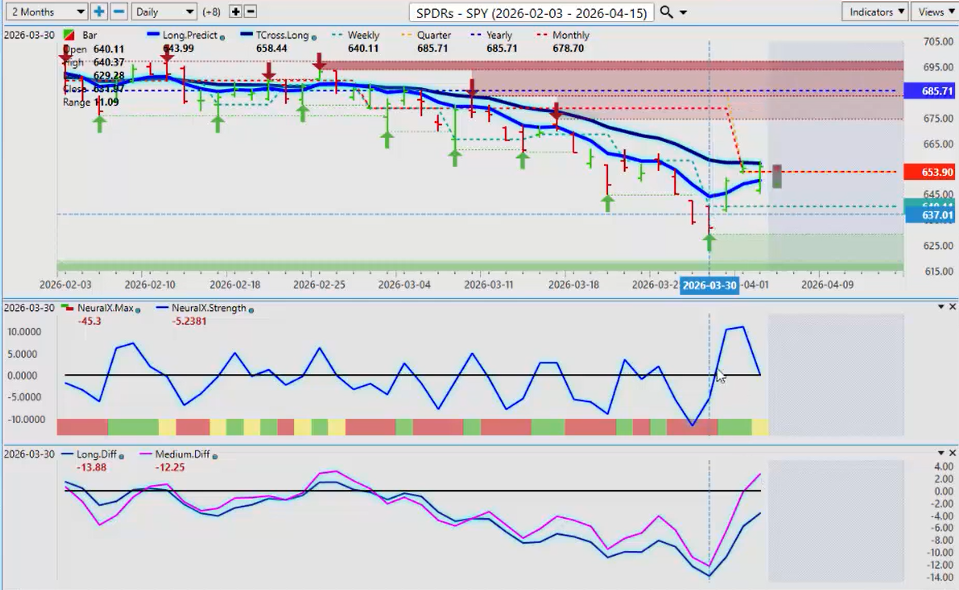
SPDR SP 50 SPY ETF ($SPY)

Now, looking at some of the key equity markets, looking at the spy’s, the spy’s remain in a very firm downtrend that began over here in the right around the end of February as we crossed over the yearly opening price. Price turned negative on the year. Now, we’ve got a maybe a short-term bottom in here on the spy’s, but right around 629, but I believe that will be retested sooner rather than later.
The neural index strength pointing straight down. We do have a medium-term crossover to the upside, but guys, this is a great example of this. When you have a a medium-term crossover and it’s below the T cross long and it’s below the yearly opening price, the primary trend is still down. So again, this could be just a corrective move back up in an overall downtrend. That’s the way it currently looks. Okay?
iShares Russell 2000 Value IDX ($IWN)
Now, with the Russell, we can see it’s a little bit different picture here with the W W IWN, excuse me. We’ve had a retest of the yearly opening price. We’re rebounding off that. We’ve come down, made a higher low. We closed above the T cross long. We’ve closed above the new quarterly opening price and the yearly opening price.
So again, there is some we could end up moving higher here. But of all the in the US indices, the Russell is definitely the the better play in my respectful opinion.
Global X DAX Germany ETF DAX 30 and FTSE 100
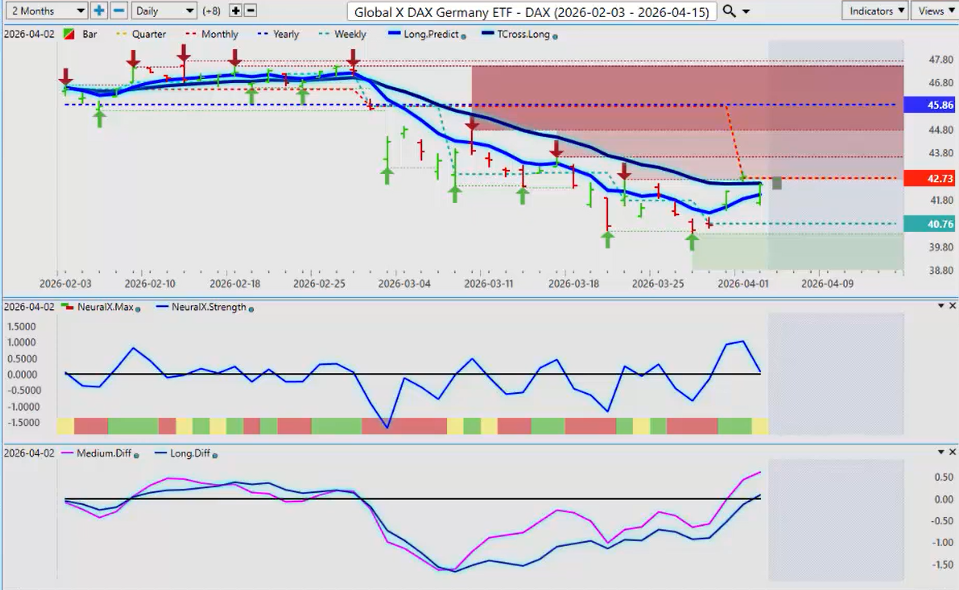
Now, when we look at the DAX 30, in again, in my view, what I’ve seen in the month of April, the FTSE 100 is actually one of the strongest global indexes during that period.
Now, I’m thinking that it’s possible the Global X DAX or the DAX futures can move higher with that FTSE. But again, that’s left to be seen. But what I can tell you right now is that we we have a medium-term crossover to the upside that took place on Wednesday. Now, we have a long-term crossover that has taken place on Friday.
We just have to get above that T cross long, turn positive on the quarter, and then we’ve got ourselves a long trade, which I I believe is possible. But again, the FTSE is the one you really want to keep your eye on in the first couple of weeks of April.
ProShares Short Term Futures ETF VIX ETF ($VIXY)
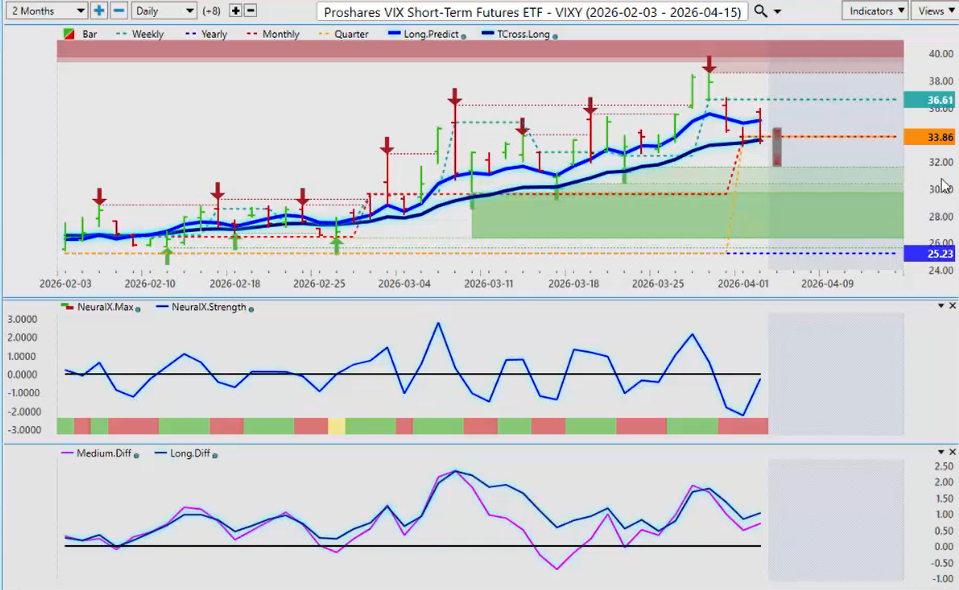
Now, we do want to check the uh the VIX to see if there’s any kind of sell signal on this at all. But again, right now, we we’re coming off of a of the high basically for the pretty close to I would say for the year. I’ll just go back here and double-check that before I say something different. Uh yeah, back here on March the 30th, the VIX ETF made that high.
And we’ve been dropping lower. But once again, this is corrective in nature until such time as we can close below 3364, which is the Vantage Point T cross long. If we can cross below that, then we can the we could see the the VIX move significantly lower and the global equity markets higher. But again, either way, I don’t see that move happening till at the very minimum Tuesday or Wednesday.
Bitcoin
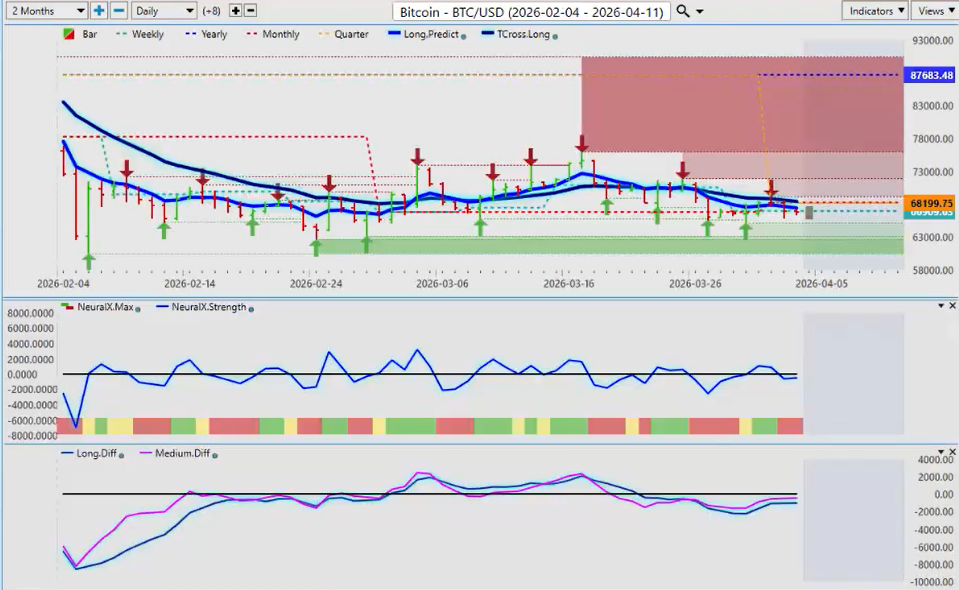
Now, when we look at Bitcoin again, Bitcoin did had a pretty decent month of March, which I’ve talked about in the earlier part of March that in most cases, March sees buying in Bitcoin, whether it’s in an uptrend or a downtrend.
Bitcoin remains in a very strong downtrend in 2026. That is likely to change towards the year end and into 2027. But we’ll deal with that when the time comes. For now, Bitcoin is negative to start the quarter. We’re below the T cross long, 68,436. So as long as we’re holding below that, that’s your main pivot level. And again, that quarterly opening, 68,199. That is a key level. As long as we’re holding below that, shorts remain in play.
Oil Prices ($USOIL)
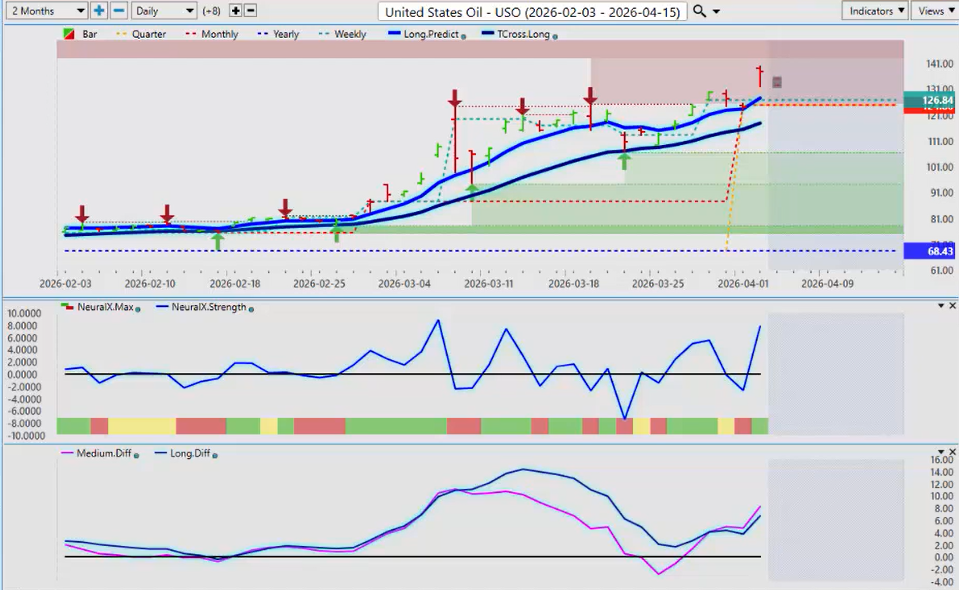
Now, with oil prices, I think that oil prices are about to explode to the upside potentially again next week. A lot of rhetoric over the weekend between between Trump and Iran. So, I believe a threat has been laid that that Strait of Hormuz must be opened immediately. Hopefully, I said that word right. Sorry. But again, a very choppy volatile start on Monday because Iran does not appear to be backing down. So, we’ll see how this one plays out or if if there’s some kind of settlement. But right now, we have an MM diff cross that is back to the upside. We’re firmly above the quarterly opening price.
I do believe that oil prices will come down, but it’s going to take some time and some kind of settlement between the US, Israel, and Iran before that happens. So, the quarterly opening, that’s the level to keep your eye on, 12486 and our T cross long slightly below that at 11785. Indicators again still remain bullish despite this very inflated price.
Euro ($EUR/USD)
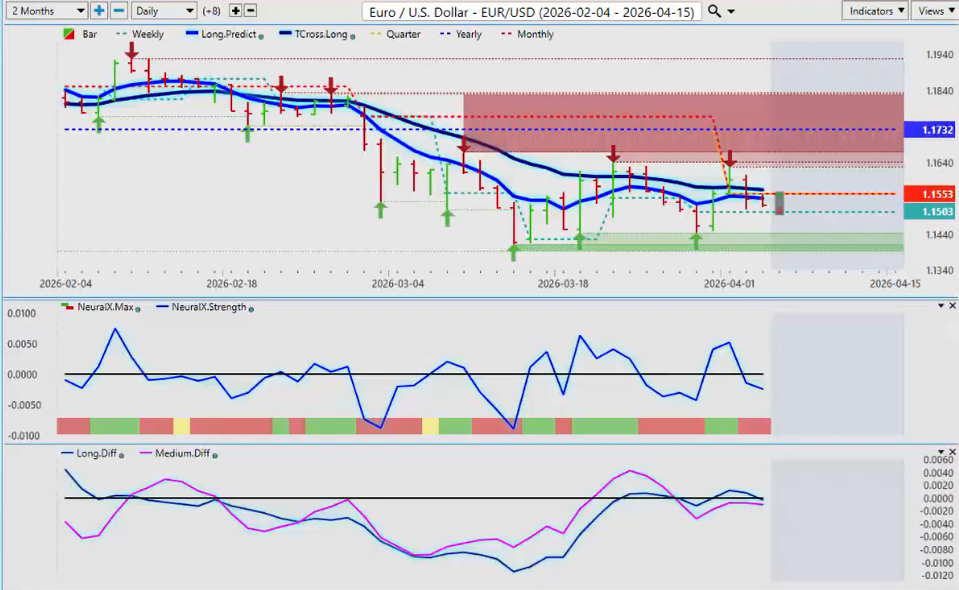
Now, when we go into some of our main forex pairs, I believe that the dollar will see some kind of strength this coming week. But it may not be until the latter part of the week. In most cases, the dollar is strong until the Tuesday after the non-farm payroll number. Now, you will have a bit of a bank holiday in in some of the countries like Canada on Monday. So, Wednesday, Thursday is where I would look for that dollar weakness.
But it all depends how people interpret how the markets and the institutions interpret that payroll number. I don’t interpret it as a great number and if they think the same thing then they will start cutting back on their dollar positions which could see the euro rise. However, once again, we are not getting above that T cross long. That level is 115.63. That’s your main pivot area but your quarterly opening at 115.53 that too is a big area. So if you’re a seller, you would sell into into those two levels. If you’re a buyer, you want to get above the T cross long at 115.63.
US Swiss Franc ($USD/CHF)
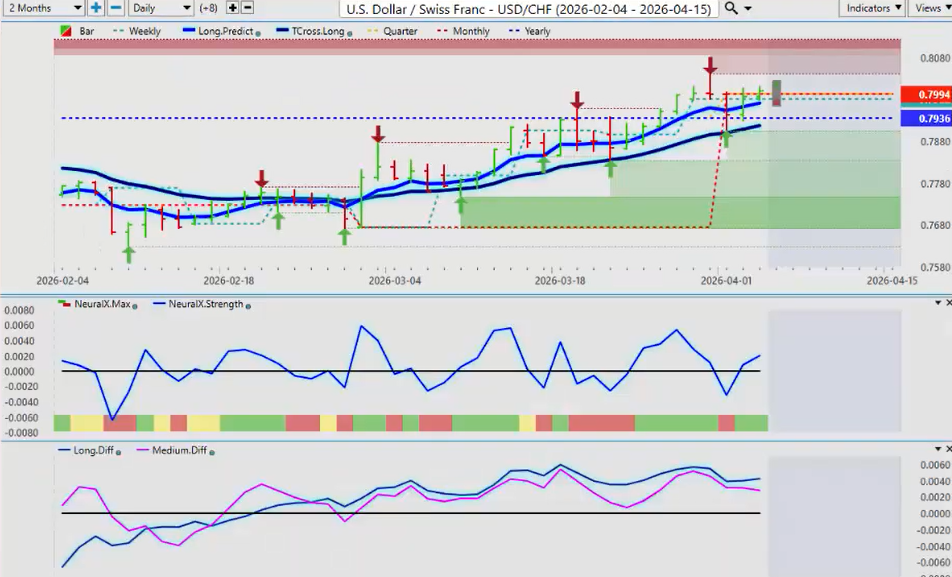
Now, with the US Swiss franc, in most cases, what I will warn everybody and this is not just about US Swiss franc, guys. This is about Aussie Swiss franc, uh New Zealand Swiss franc, Canada Swiss franc, even Great Britain Swiss franc. Uh the month of April usually does see the the Swiss franc strengthen.
Now, the Swiss National Bank has been on the prowl for several months probably already knowing this and trying to artificially weaken their currency but it’s not working. Uh so again, if those cross pairs come under pressure, so will US Swiss franc. So the quarterly opening there 79.94 I would and if we can break down back below the yearly opening price at 79.36 then we have our T cross long sitting at 70.19. I do anticipate this level either way to be tested in the days and weeks ahead. So keep an eye on that but for now, we have a verified resistance high at 80.42 and that’s the area there too to be very very cautious buying up at these very lofty levels.
British Pound vs. Dollar ($GBP/USD)
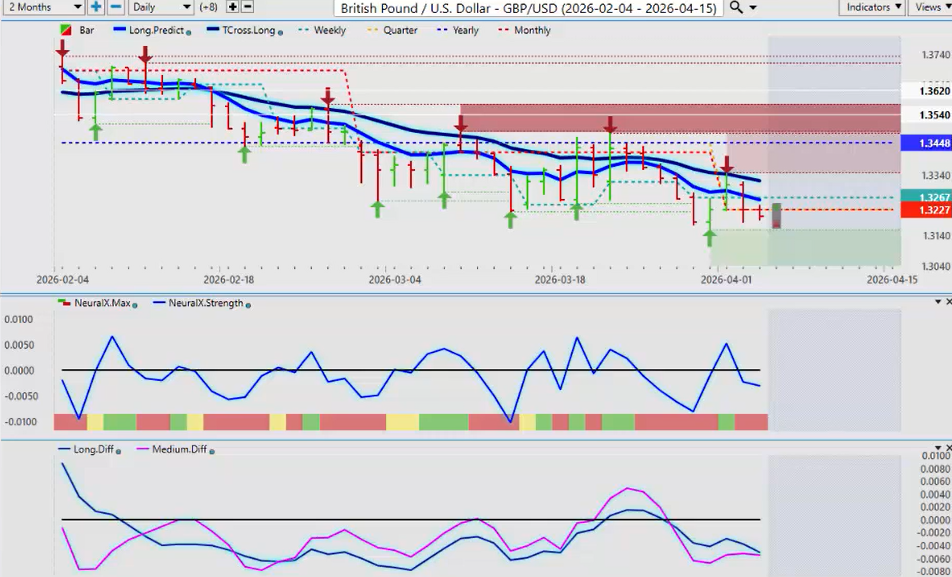
Now, the pound dollar, if the FTSE 100 moves higher, I believe the pound dollar can move higher too. That would be the trade. So we have a verified support low that low coming in at about 131.60. Keep your eye on that but again, if we can start pushing higher above 132.27, I believe we have a shot this month of getting back to 134.48.
A lot of fundamental variables that could alter that path but for now, based around master or if we want to master trading or seasonalities, then we have to look at a minimum of 5 years back and it shows strength in the FTSE and usually when they buy a country’s stock market, they do tend to buy the currency also. So keep an eye on that. Right now, we’re starting to bottom out on the predicted differences. I’m looking for my neural index strength to start turning back up and that could be the trigger but at the very least, I believe we will retrace back to that T cross long at 133.21.
US Dollar v. Japanese Yen ($USD/JPY)
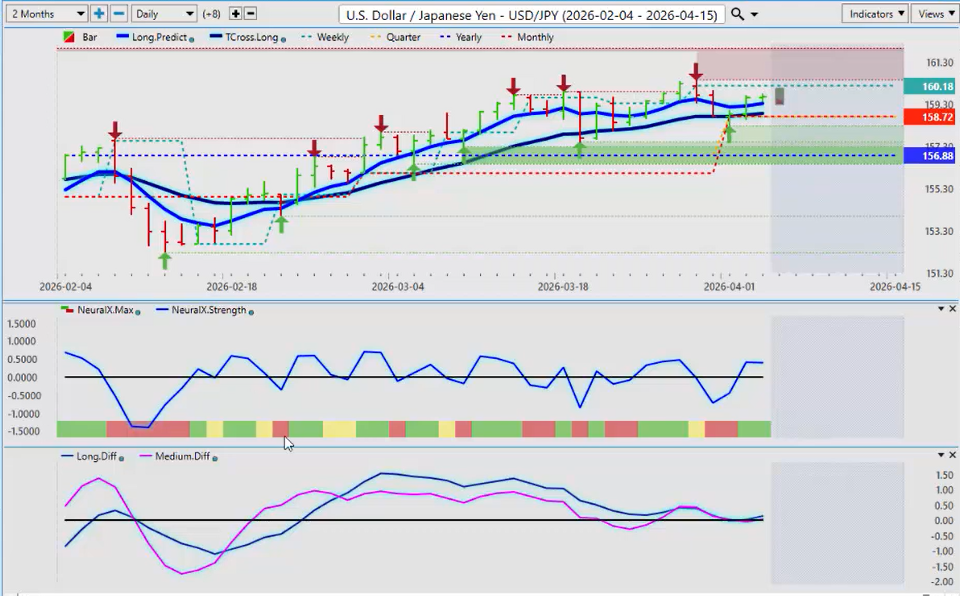
Now, with the dollar yen, once again, Bank of Japan still talking about potentially hiking. So for now, this pair continues to hold above the quarterly opening but here’s two ways you can play this and I always like to give something to the bulls and something to the bears. If you’re a buyer, the T cross long and the quarterly opening is coming in at the same level 158.72. However, if you’re a seller, then a sell stop order just below the VP T cross long at 158.87, if it passes over that area, chances are it’s going to start accelerating to the downside. So again, a sell stop order would kick in as soon as it passed down below that particular area. But again, you’re buying at the at that level and selling just below it.
US Dollar v Canadian ($USD/CAD)
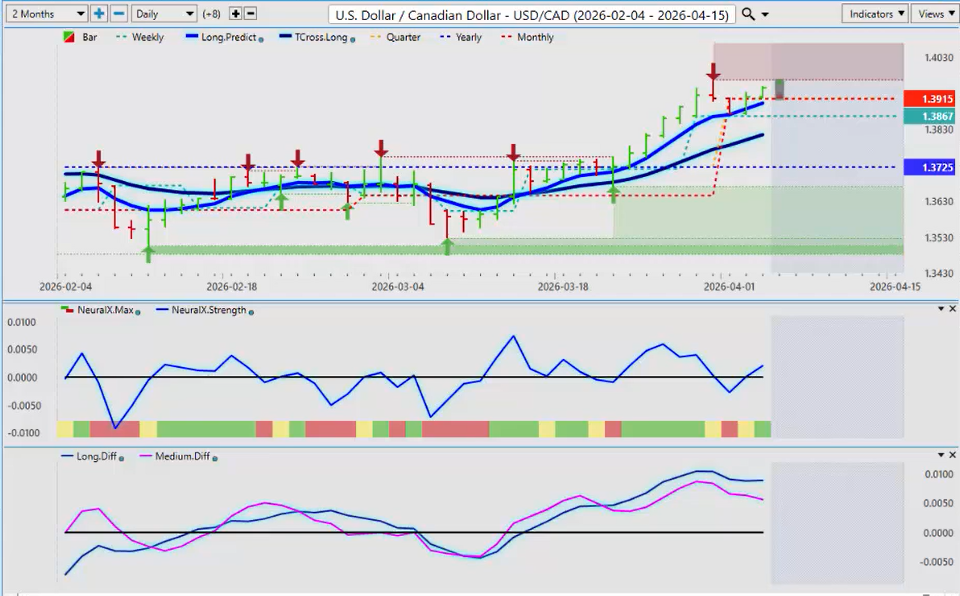
Now, with the US Canadian, the Canadian, the Aussie and the Kiwi have been under pressure in my respectful opinion with the high correlation these three currencies have to the equity markets. So once again, uh the Canadian dollar under significant pressure here and I spoke about this last week. Bank of Canada, uh the new Prime Minister Carney uh doubling the deficit in less than a year almost. So the market’s not really liking some of these policies.
Uh but usually, if we saw the price of oil anywhere above $100 a barrel, uh fair value would put the US Canadian pair closer to the 118 level, 119 level, maybe even lower. Last time we’re over $100 in a barrel in oil, uh I believe the Canadian dollar was at par or below par against the US dollar. So there’s a lot a lot has changed in the uh political environment around Canada but it’s arguable whether it’s for the better because the currency is suggesting it’s not and to be clear, uh Canadian dollar has been up well above 130 for a very very long time, guys.
So this is not an Iran US conflict. I would argue it’s not even really a tariff issue with the Canadian dollar. There’s a lot of other things going on besides that but once again, in most cases, based around seasonal patterns, the Canadian dollar is stronger mid-April through mid-June with higher gas prices, higher oil prices. Uh I don’t know if we’re going to see that this year or not but for now, uh we remain it’s still net bullish while above that quarterly opening but 139.15, that’s the area to keep an eye on. If you break that, you go neck the next level is the T cross long 138.14. If we can do that, which I believe we can, it won’t be until probably uh mid-April and if things do calm down between uh Israel and the US, then uh and and Iran, of course, then the Canadian dollar and oil prices fall, then the Canadian dollar really has a problem it’s facing. So we’ll see how this one plays out but for now, the key thing, guys, know your levels, right?
Australian Dollar versus U.S. Dollar ($AUD/USD)
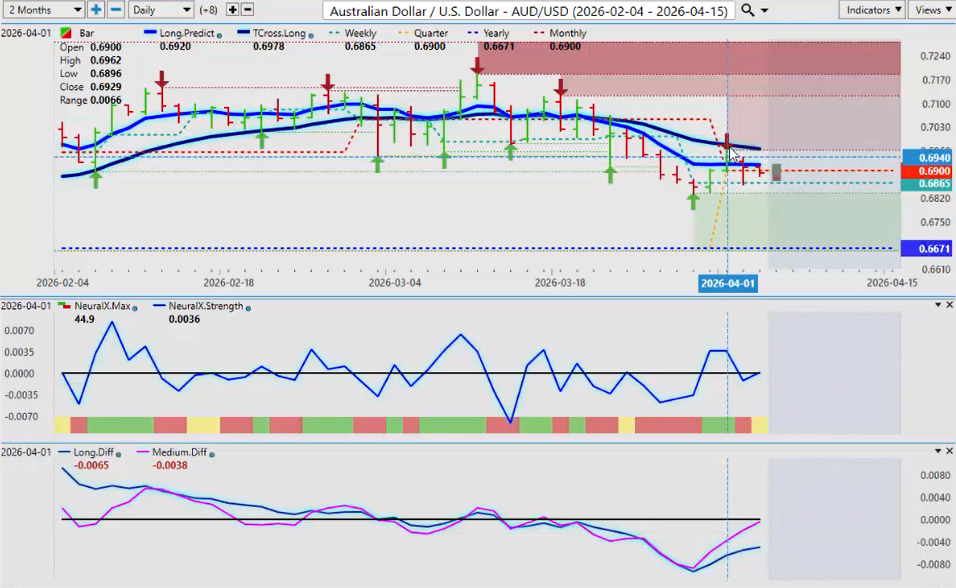
Now, the Aussie and the Kiwi, the Aussie remains the stronger of these two. And when we look at that right now, let me just get rid of that for you. Here, delete that. So right now, we’re hovering right along a verified support low 68.33. We’re rising off that. But again, we’re getting all tangled up in the VP predicted moving averages. A nice retracement up there all the way up to the T cross long. The MA diff cross nailed that. So did the neural index strength. But again, guys, that is a corrective move for now. But but I will say that as long as we’re above 66.71 between the Aussie and the Kiwi, the Aussie is the currency to buy and that would translate into strength with a cross pair like Australian New Zealand.
But again, it all depends on where we go with equities. I believe the equities probably are not going to recover anything significant until the end of the month, maybe even into May. But again, this is a weekly outlook. I’ll update everybody next week but for now, uh buying the Aussie on a dip is still the better play while above 66.71.
New Zealand Dollar versus U.S. Dollar ($NZD/USD)
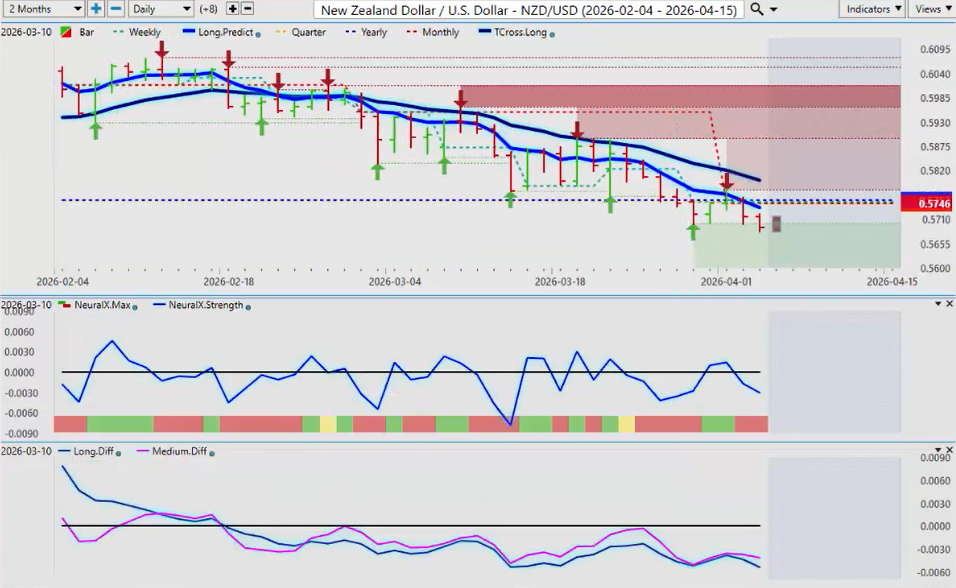
The Kiwi, well, the Kiwi is not faring as well. It’s now officially closing below the yearly opening price. We’ve had a few retracements back to that yearly opening price and failing again. If you look at pairs like New Zealand CAD, New Zealand New Zealand Swiss franc, New Zealand Swiss franc is uh also giving up the yearly opening price and the sellers are still pushing it lower. So that tells me that uh between Aussie US and New Zealand US, Aussie is the one I would want. And uh doesn’t mean that I’m going to sell the Kiwi. It just means maybe I don’t I don’t want to buy it but uh again, guys, we’re going to have a very choppy start to the week.
We’ve got threats going back and forth between Iran and the US. We’ve got a highly speculative labor report that just came out where you’re going to get a large group of people that are going to be in the positive camp and a large group that’ll be in the negative camp but it’s the question is will the Fed move on that number and or stay on hold or hike? Uh I think going forward, he will not be able to do either one of the latter that I just mentioned.
So with that, there will always be opportunity. So with that said, this is the VantagePoint AI Market Outlook for the week of April the 6th, 2026.


