Register for a Free Live Training
The Hot Stocks Outlook uses VantagePoint’s market forecasts that are up to 87.4% accurate, demonstrating how traders can improve their timing and direction. In this week’s video, VantagePoint Software reviews forecasts for SPDR S&P SPY ETF ($SPY), W.W. Grainger ($GWW), Fifth Third Bancorp ($FITB), United Community Banks ($UCB). Colliers International Group ($CIGI), J.M. Smucker ($SJM), Williams-Sonoma ($WSM)
Hello again, traders, and welcome back to the hot stocks outlook for April 10th, 2026. I hope you all have had an excellent week out there in the financial markets. And as always, we’re here to cover the most recent Vantage Point AI predictive forecast.
So, if you haven’t already, be sure to go ahead and click the link down in the description below and get signed up for a live demonstration, where you’ll be able to learn all the specifics about how these predictive technologies are helping traders make much better trading decisions out in the marketplace.
And so, really a lot to cover. We talked a little bit last week about how we see the SPY actually shifting to the bullish side. And of course, that indicates, hey, maybe we should look to where we’re seeing bullish predictive forecasts within Vantage Point. And this actually gets very easy for traders, as we have scanning features within Vantage Point, the Vantage Point Intelliscan, which really allows traders to fine-tune exactly what they’re looking for as far as these predictive tools.
But let’s go ahead and highlight how all this works together, and then, of course, we can review many of these previous opportunities from previous weeks and get caught up here.
W.W. Grainger ($GWW)
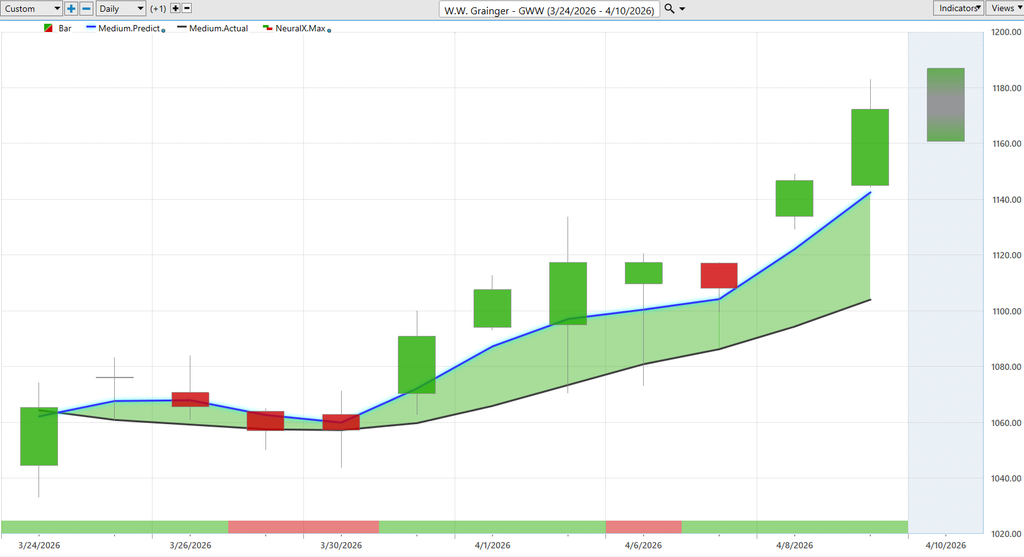
So, with W.W. Grainger, what we have here, of course, is daily bars and candles. So each one of these candles is going to represent a full and complete trading day. And so, it’s right up against that daily price action that you’ll first notice there is a black line and also a blue line value.
Now, what the black line is is actually a simple moving average. So, this is a very common technical analysis indicator, and all of the data that generates most traditional technical analysis just comes from the past. So, it reconfigures the previous 10 trading days, in this case, adds those all together, divides by 10, and we get a rolling measure.
But all of that data, again, comes from the past. So, it’s really lagging and just reconfiguring what’s already occurred. But what Vantage Point traders are able to do is compare that lagging moving average, essentially our baseline, to the proprietary predicted moving average that’s generated via the technology.
And so, whenever this blue line, in this case, gets above the black line, well, it’s Vantage Point suggesting that these average prices should start moving higher. Now, what’s interesting about this is it doesn’t just, again, look at past prices to factor and calculate these values. What Vantage Point’s artificial intelligence is doing is what we would call intermarket analysis.
And so, it’s going to look at dozens of markets that are known to drive and influence future prices. Now, this can be things like other individual stocks. This can be ETF groups like SPY, or the QQQ, or IWM that gobble up a huge assortment of the index. This can be sector ETFs that focus on a particular area of the market.
But this really goes down the line to things like global currencies, like the value of the US Dollar Index, things like global interest rates, and even global commodities like gold, silver, and oil, where applicable. And certainly, we’ve seen energy stocks do well, influenced by the move in the core commodity there.
And so, for Vantage Point users, again, whenever we see this blue line get above the black line, it’s factoring in all of those relationships and making a prediction on where things are likely to head next. You notice as long as that blue line stays above the black line, the overall forecast is bullish as far as the overall trend.
And you see you get about a 10% move here in just the past 11 trading days in W.W. Grainger. And a lot of that coming really this past week, where we recognize, hey, there’s strength in this market. Where might we want to look for opportunities now?
You’ll also notice at the very bottom of the chart, you see this bar that goes from green to red, back to green. Well, this is also utilizing Vantage Point’s predictive technology, but it’s tuned to solve a different problem for traders, and that is short-term strength or weakness over the next 48 hours.
And so, what we can recognize is when that blue line gets above the black line, the overall trend is up. But you’re going to get these instances where the neural index goes bearish and warns you, essentially, of lower lows coming through over the next couple of trading days that you might want to be aware of.
You see here as well, neural index gets bearish. You get a little bit of a down day, some lower lows, but notice the overall trend still very bullish, still moving higher as far as its predictive values.
So, this is where things get really exciting for traders, as we have that overall trend direction, anticipation of short-term strength or weakness, and also the Vantage Point intraday predicted high and low. So now we have a forecast for intraday price levels.
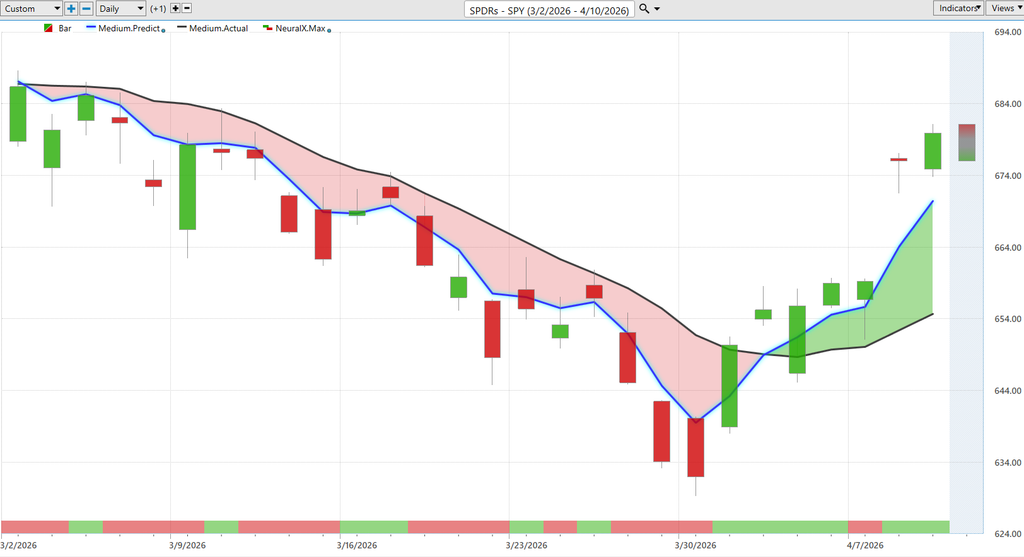
Now, here’s SPY. So, with all that information that we just took in, okay, well, what’s been going on with SPY? Well, we’ve been in a downtrend, but what we recognized last week is that blue line has gotten above the black line.
And so, traders can look to identify, hey, where are those markets that are already in an uptrend that are really leading the way? Of course, if you want to trade SPY, we have those predictive levels as well.
So, you see you get our predicted lows coming through here, really nice entry on what would have been Tuesday at this point. And even here yesterday, moving down to the predicted low before markets going higher going into the end of the week.
So, even just here, going back to where we were Friday, the S&P 500 up about 3.8%. A very strong move that traders can really get ahead of as we see things starting to shift around.
Fifth Third Bancorp ($FITB), United Community Banks ($UCB)
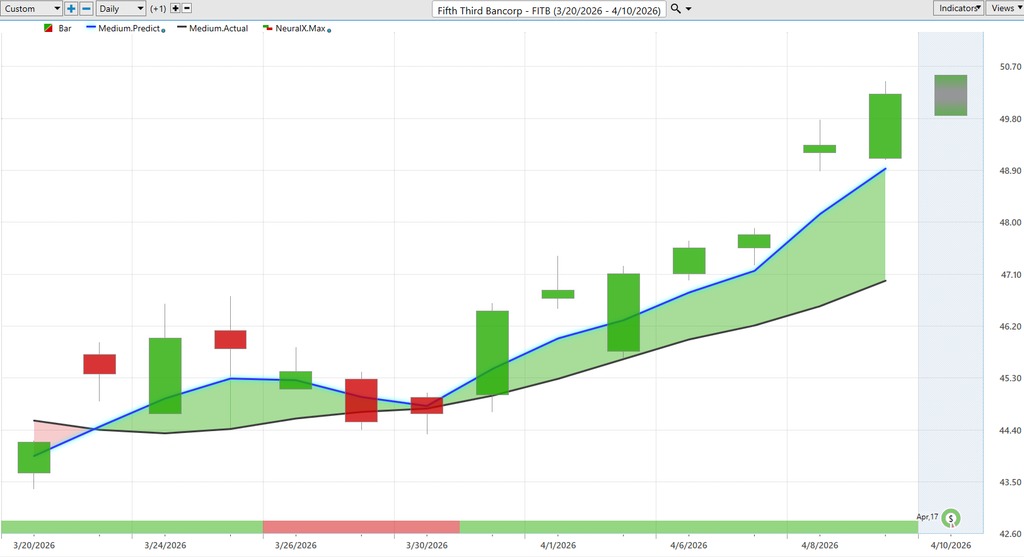
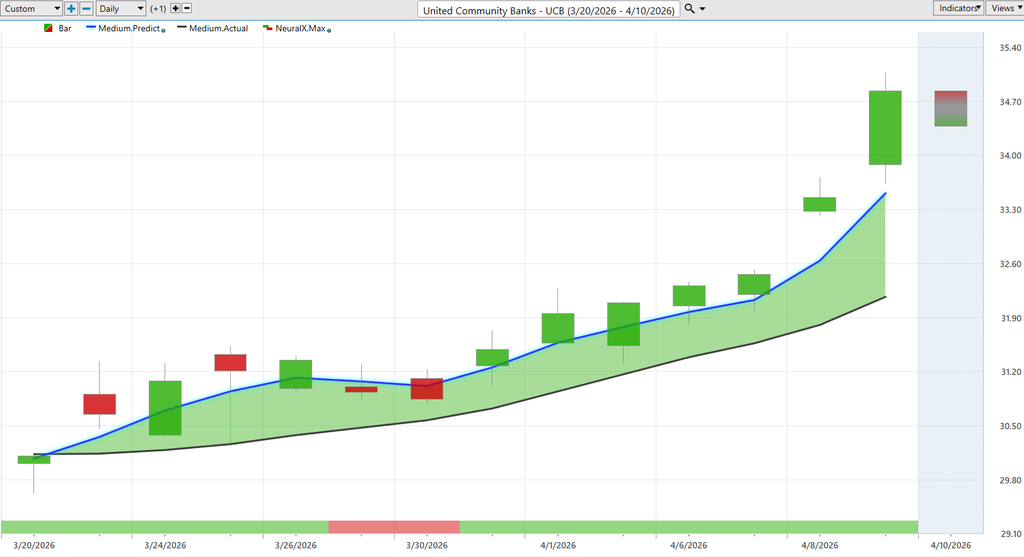
Now, here’s some banking stocks. These are also in a pretty strong downtrend. But you see, going into this week with strength, well, this is an area where we have a lot of strength from the Vantage Point predictive tools.
And now, as we look back over the previous predictions, we can see we really have this roadmap that’s telling you, hey, look down towards these predicted lows. You want to be a buyer, taking profits on longs.
And again, even just this past week, just over the past five trading days, really since last Friday, up about 10% in about five trading days. But this is why this is very important. You want to recognize where these markets were already in an uptrend before the S&P 500.
United Community Banks shows a very similar setup. You can hone in on the sector, identify the leaders, and then fine-tune entries using predicted highs and lows.
Colliers International Group ($CIGI)
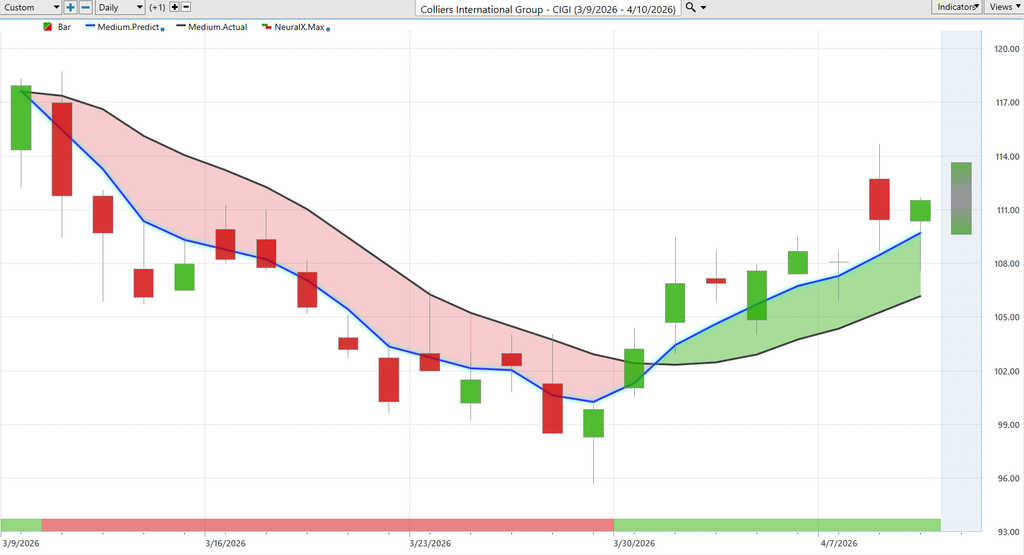
Colliers International Group provides another key example. The neural index is looking ahead 48 hours and has a very high level of accuracy, upwards of 86% to 87%, at forecasting direction.
Notice that even before the crossover, the neural index turns bullish, warning traders of upcoming strength. That early signal leads to confirmation, followed by multiple trading opportunities within a single week.
J.M. Smucker ($SJM)
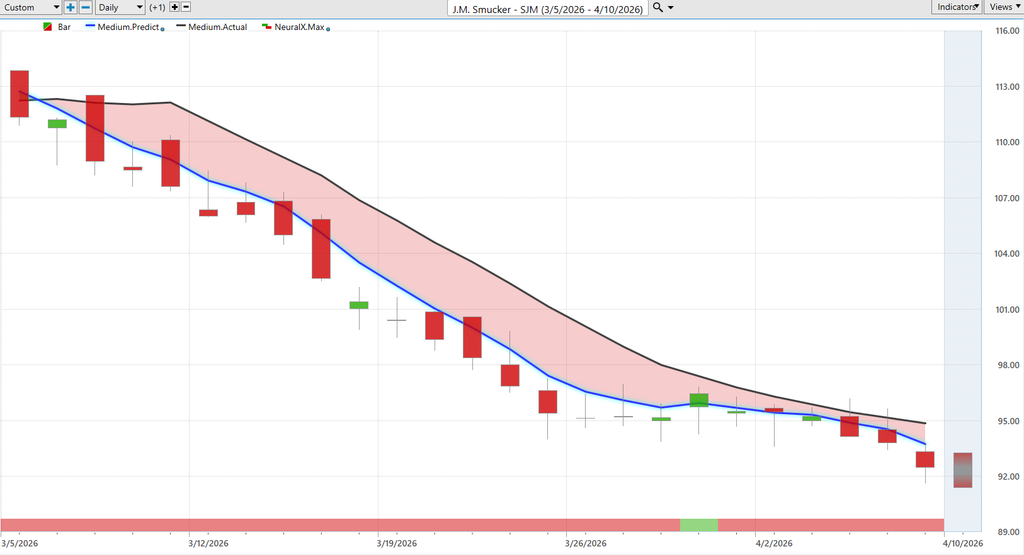
Now, there are still markets in downtrends. J.M. Smucker is a clear example. The blue line is below the black line, and the neural index is bearish.
You see persistent downward price action, followed by a sideways consolidation, and then another bearish push. Traders can use rallies toward predicted highs as shorting opportunities or to hedge long exposure.
Shares are down about 17% in just the past 24 trading days.
Williams-Sonoma ($WSM)
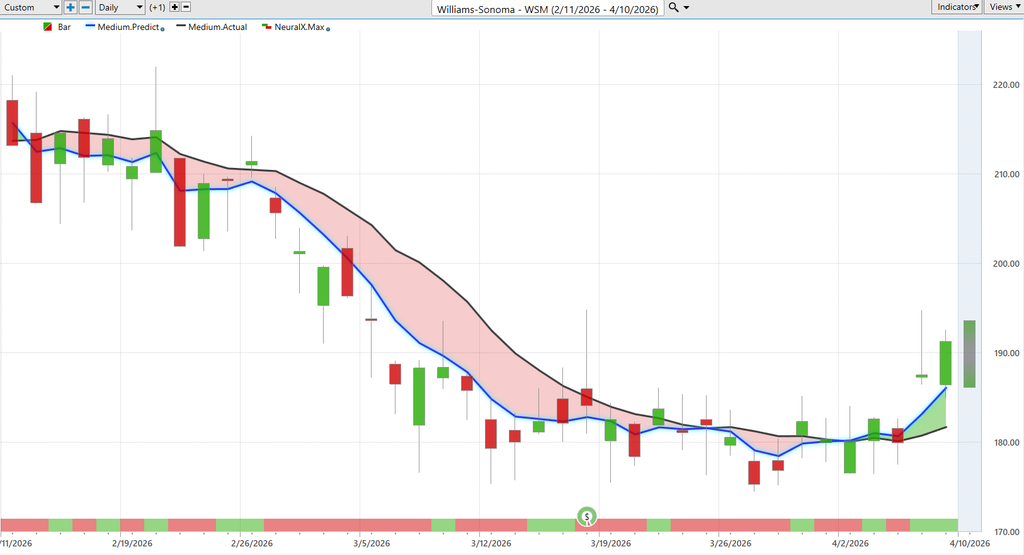
Finally, Williams-Sonoma highlights a transition phase. Initially weak, the stock begins to stabilize as the blue and black lines converge.
You see conflicting neural index signals, but once alignment occurs, the market moves decisively. The move down to the predicted low sets up the next directional shift.
This illustrates how traders can move from short bias to long positioning as conditions change.
So again, very clearly highlighting where are these areas on the map that should be of interest if you want to be a trader in this particular market.
And the beauty of this is you’ve got these tools updating every single trading day. So, traders always have a clear view of where strength is emerging, what should be avoided, and where to focus their capital.
So we’ll go ahead and leave it there for today. But once again, this has been the Hot Stocks Outlook for April 10th, 2026.
Thank you all for watching. Best of luck out there, and bye for now.