Register for a Free Live Training
The Hot Stocks Outlook uses VantagePoint’s market forecasts that are up to 87.4% accurate, demonstrating how traders can improve their timing and direction. In this week’s video, VantagePoint Software reviews forecasts for SPDR S&P SPY ETF ($SPY), Funko ($FNKO), Lennar ($LEN), Under Armour($UAA). Wingstop ($WING), Williams-Sonoma ($WSM)
VantagePoint A.I. Hot Stocks Outlook for April 3, 2026
Hello again, traders, and welcome back to the Hot Stocks Outlook for April 3rd, 2026. I hope you all have had an excellent week out there in the financial markets. And, as always, we’re here to cover the most recent Vantage Point AI predictive forecast.
So, if you haven’t already, be sure to go ahead and click the link down in the description below and get signed up for a live demonstration where you’ll learn all the specifics about how these predictive indicators and technologies are helping traders make much better trading decisions out in the marketplace.\
SPDR S&P SPY ETF ($SPY)
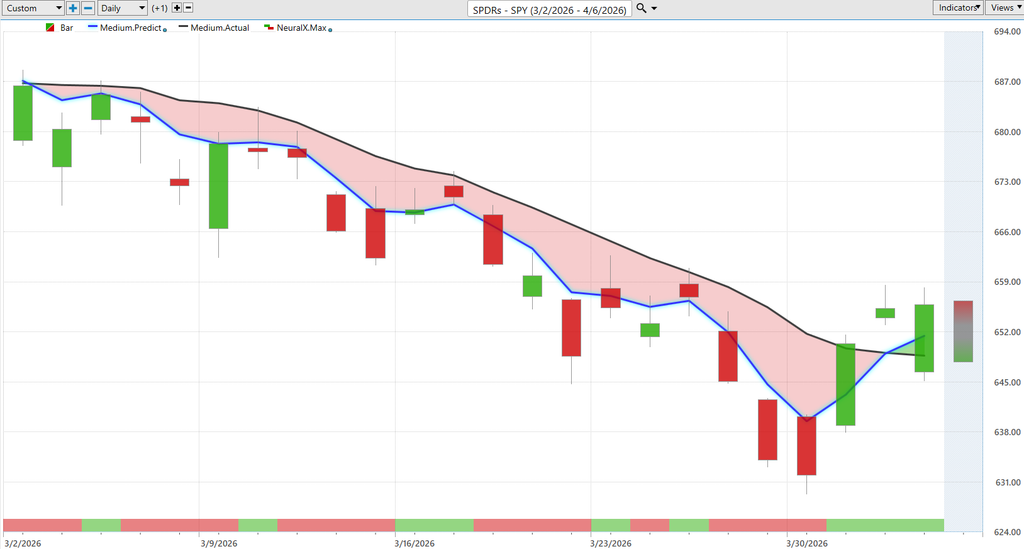
And so we’ll start out with shares of SPY, obviously indicative of the broader stock market. And in these previous hot stocks outlooks, we’ve talked a lot about overall market weakness and strength around energies. But we may actually be seeing a shift there. So this will be very exciting over the next few weeks here.
But what we’re seeing with SPY is, of course, daily bars and candles, where each one of these candles is going to represent a full and complete trading day. And it’s right up against all that price data that you’re going to notice that there is a black line, but also a blue line value.
And so what the black line is is a simple moving average. So this is a very common technical analysis indicator. Uh, in this case, it would be a 10 period. So, it’s going to look back at the previous 10 close prices, add them all together, and then divide by that number.
Uh, and one of the traditional weaknesses with analysis like this, traditional technical analysis, is that all the data comes from the past. So, it’s always lagging. It has no predictive capability and really just reconfigures the past and summarizes what has already occurred.
But, VantagePoint traders are able to utilize our proprietary predicted moving average.
And for this value, essentially a price gets plotted and calculated on the chart every evening. Well, this is where the technology of artificial neural networks comes into play, and they’re performing what we would call intermarket analysis.
And so what that means is that, rather than just having tools that look at the past and reconfigure price, what Vantage Point’s technology is doing is utilizing the data from other markets that are known to drive and influence future prices.
So, this can be other ETF groups within the broader stock market like the Q’s or IWM. Uh, this can be individual stocks that have a heavy weighting and that have statistically shown a significant relationship with this target market that you’re trading. But this really goes all the way down the line to things like global currencies, the bond market, uh, and even things like global commodities, where we’ve seen things like energy stocks do extremely well.
Well, those forecasts are weighted by the crude oil commodity itself, indicating that, hey, uh, we’ve got a lot of strength throughout this sector, and that will influence and help the predictive accuracy of these tools.
So, whenever we see the blue line cross below the black line, well, it’s suggesting these average prices are going to start moving lower, uh, and traders may want to look to take, in this case, a short position.
Now, since that forecast came through, we see just this week actually, uh, market, the S&P 500, had been down about 8% in just 19 trading days. So, when we go over those individual stocks, well, what traders are understanding is the overall indices are bearish.
Let’s find some of those individual markets to go ahead and short, take profits on short positions. Uh, and really quite the opposite with energy and energy shares.
But that’s not the entirety of this predictive forecast. We also have this bar at the bottom of the chart, which we see gets updated every single trading day, and it’s forecasting short-term strength or weakness over the next 48 hours.
So we have a very good tool here that has a very high level of accuracy that’s going to consistently look forward and say what are we likely to see over the next 48-hour window, very, very short term, and keep updating that.
Additionally, we’re also provided with intraday predicted high and low levels.
So what’s happening here is all of that data from all these intermarket relationships is being used to solve these different technical problems of the overall trend, short-term strength or weakness, and those predicted highs and lows over the next couple of days of price action.
And we can use really this suite of artificial neural networks to produce a robust forecast and so we see really how this works. With that blue line below the black line, we can, of course, look at the VantagePoint predicted highs and lows. And these act as really nice guidance as to where traders might want to look to set short positions.
Now, you’re not going to hit these levels every single day. Certainly not perfect, but it does a very good job of indicating where the trader should be paying attention and positioning.
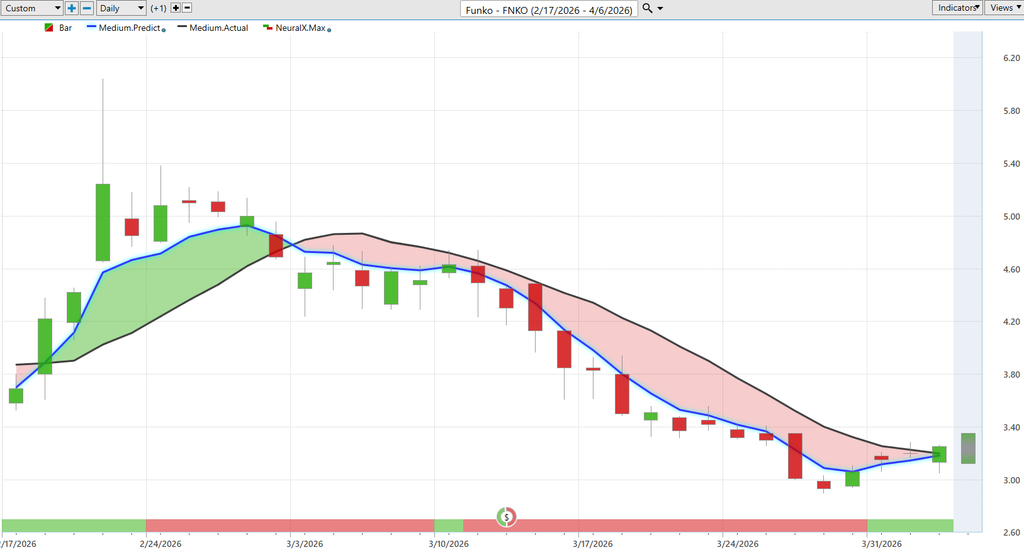
And so to that extent here, let’s look at Funko ($FNKO). And this is a great example again of how all of these predictive indicators work.
Whether you’re trading on the bullish side or the bearish side, you can really hone in on that individual opportunity or individual stock.
Notice that when the blue line gets above the black line here, uh, that neural index gets bullish, and that’s where we see subsequent strength in the market.
But notice what’s going on with the short-term forecasting here from the neural index. Pretty much at the top here, you start to see that neural index go bearish.
Lennar ($LEN)
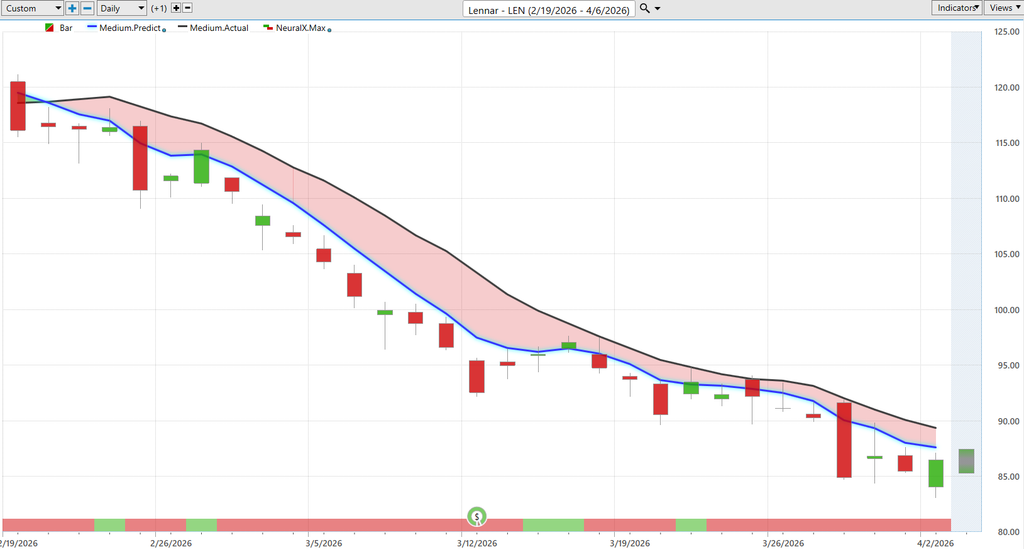
And we’ve seen a lot of that weakness in $LEN and home building and material companies.
Here’s $LEN, uh, blue line below the black line, neural index bearish.
Now, you will see times where the neural index goes bullish, and sometimes you do get subsequent sideways price action over the next couple of trading days, but of course the overall trend is still very bearish here.
So, while you may get some short-term strength within the downtrend, very clear to stay in tune with that overall trend direction.
Under Armour($UAA)
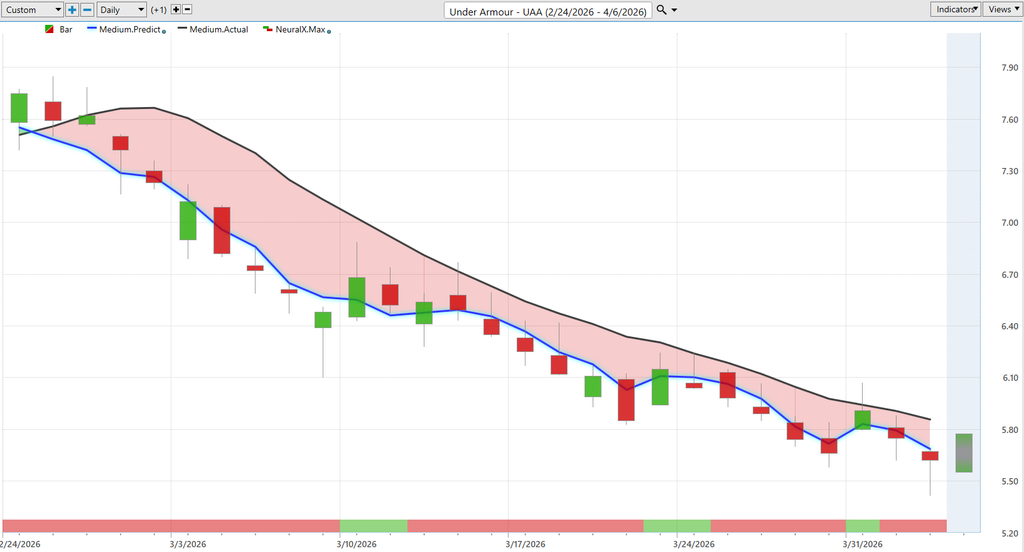
Under Armour looking weak as well. So, we saw shares of Nike have earnings, and the market really collapsed here.
So, a very weak market environment, uh, a very sort of catalyst there to drive things lower in shares of Nike.
Uh, well, not too far away here, here’s Under Armour, and you see a very similar forecast.
Wingstop ($WING)
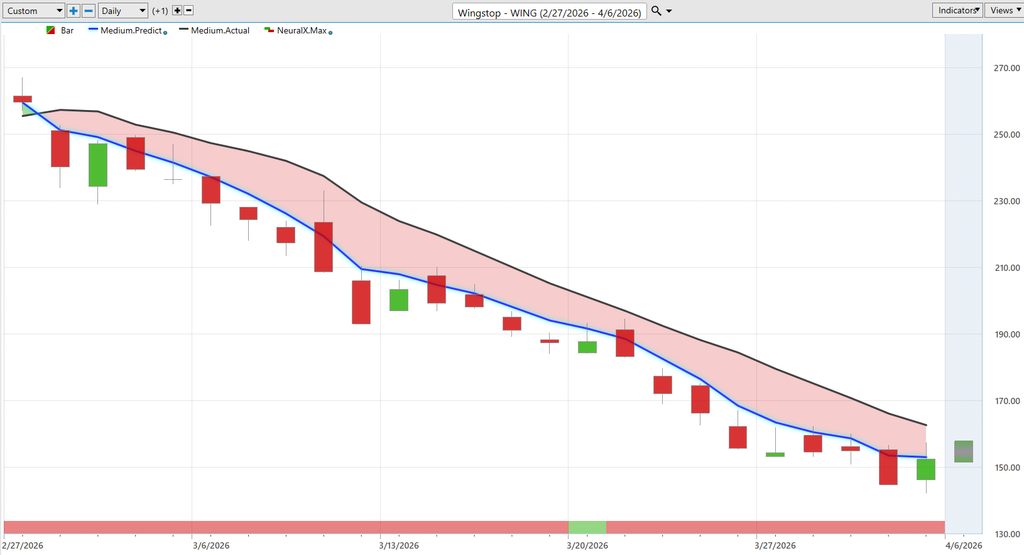
Shares of WingStop, very clearly here. Blue line below the black line, neural index very bearish here.
You really only have one day where it flips up to a one.
Uh, and this is a good indication of really how these predictive indicators work and really the level of accuracy.
Williams-Sonoma ($WSM)

Here we see Williams Sonoma, blue line below black line, and this was an opportunity we brought through very early, uh, highlighting some of the weakness in the consumer side of the equation here.
And again, you see this move up towards predicted highs, a lot of opportunities to get short, take profits on shorts.
So, go ahead and leave it there for today. A lot of interesting opportunities playing out throughout the market, uh, and really interesting events as we see, again, shifts in energy potentially.
We saw a big spike, but you really want to be aware of how are those conditions changing and where are the best forecasts to do some analysis and do some trading.
So, once again, this has been the Hot Stocks Outlook for April 3rd, 2026. Thank you all for watching. Best of luck out there, and bye for now.