


Welcome to the Artificial Intelligence Outlook for Forex trading.
VIDEO TRANSCRIPT
Okay, hello everyone and welcome back. My name is Greg Firman, and this is the VantagePoint AI Market Outlook for the week of February 19th, 2024. Now, to get started this week, we’ll do our comparative analysis using a split screen, looking at the major global indices and how they’re reacting to currency strengths, things of that nature.
S&P 500 Index
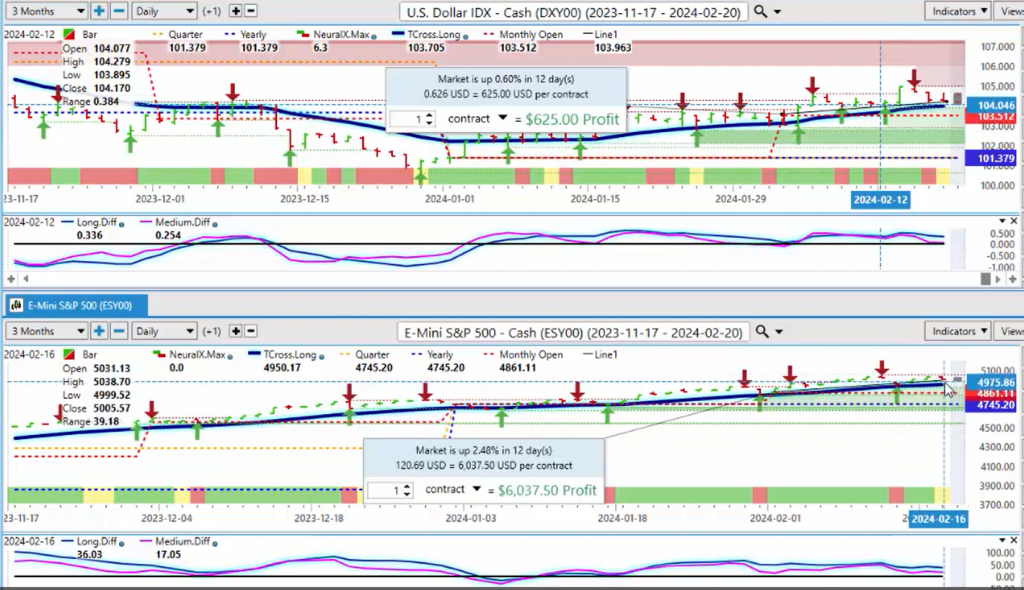
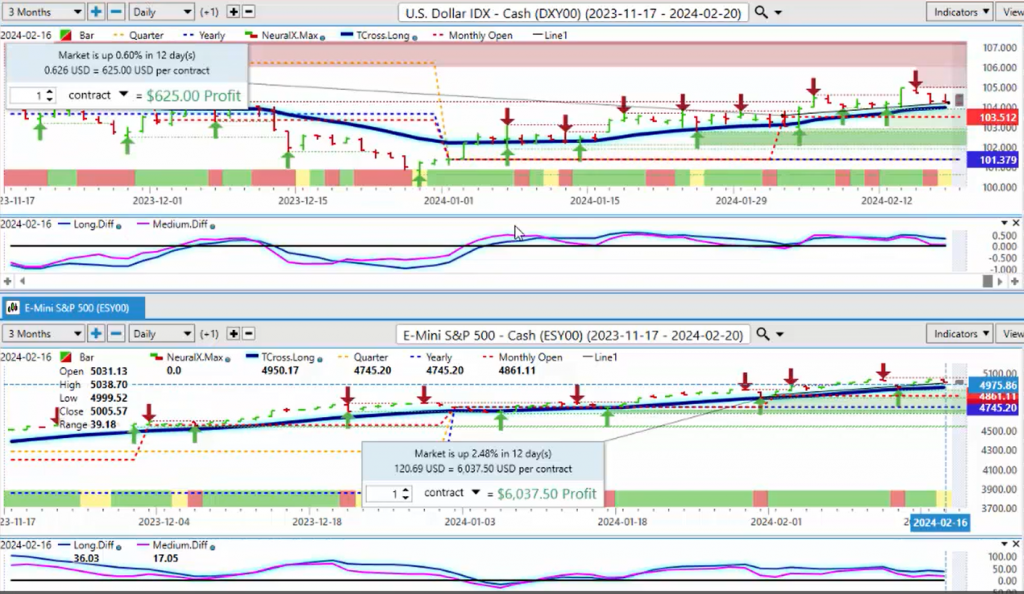
So right now, the S&P 500 is up a mere 2.48%. Again, very important, guys, that we’re not implementing a rolling performance model because it can be very lagging and misleading. We are not up over 5% on the month; we are up 2.48% on the month. There’s a very big difference between those two numbers. You can see that we’re stalling out on the VantagePoint verified resistance high. Now, this particular high, the verified zone, is identified using a single bar. That was a question I noticed that had come up, and I can field that for you. This verified resistance high essentially, we look for two bars to the left and two bars to the right that are lower than that highest point, and that forms a verified resistance or support, the same thing on the downside. So that high is coming in at 5048, and you can, as we can see, that we don’t have a lot of buying up here. The indicators in Vantage Point still remain net positive, but once again, I think it is important to point out too that Vantage Point is not merely a moving average crossover system. An inside look at the neural index, which 95% of other systems simply don’t have, we look at the exact percentages to a specific market. We can use the intermarkets, or we can use the top 10 correlated markets, but this is what a neural index sees. We can see the percentages, both positively and inversely correlated, right? We can look at this from a monthly standpoint, a quarterly standpoint, or a yearly standpoint, effectively increasing the 31 correlated markets that Vantage Point currently uses to upwards of 40, maybe even 50, when we look at the yearly, the quarterly, and the monthly. So right now, we can see that the SPDRs obviously have a 99.93% positive correlation. Then we have ones down here that are inversely correlated. If we look at it on a quarterly basis, you can see that those markets change. But again, the neural networks can not only find these markets, it can identify, put a percentage to it of how correlated something actually is, where these other systems simply don’t have that ability to barely even identify those markets, let alone tell you on a percentage basis how correlated they are. So once again, we’re using the T-cross long, or I’m using the T-cross long, in these presentations over the last few weeks to draw attention to how important it is to apply a predicted moving average with those intermarkets. So right now, on a comparative basis, the dollar is just up .6% on the month because, again, we always measure our performance from proper anchor points: the start of the year, the start of the month, the start of the quarter, the start of the week. And that way, we know exactly where we are in that particular month. So in the month of February right now, the dollar is struggling a little bit here at .6%. A lot of mixed data this past week. The S&P 500 is up a mere 2.48%. So, it’s not doing bad, but you can see that if we look at the global stock markets, they tend to both be stalling out around the same area. Now, in my respectful opinion only, if we do a comparison between the S&P 500 and the DAX, the DAX carries a slight edge. It’s only up about 1.6% on the month, and again, I don’t think the ECB is going to talk about any more rate hikes, probably cuts. So the currency weakens a little bit, that country’s stock market usually increases in value. So once again, we’ll monitor this, but as we can see, using the proper anchor points, the yearly opening price here on the DAX coming in at 16,940, but a series of verified resistance highs up here at the 17,200 mark.
DAX
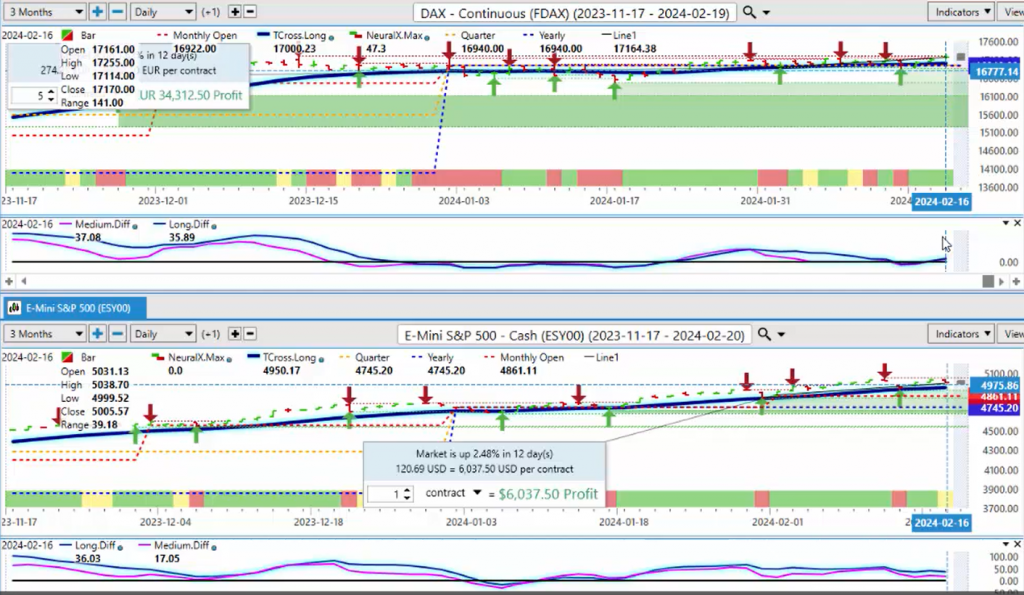
In order for the DAX to continue to advance, we must get above this level and stay above this level. So that’s the area to watch right now. The indicators in Vantage Point are still bullish on the DAX. You can see that our predicted differences have dipped below the zero line, but now they’re sloping back to the upside, whereas the S&P is basically running dead flat here. You can see our long-term predicted difference, medium-term predicted difference, dead sideways.
CAC-40
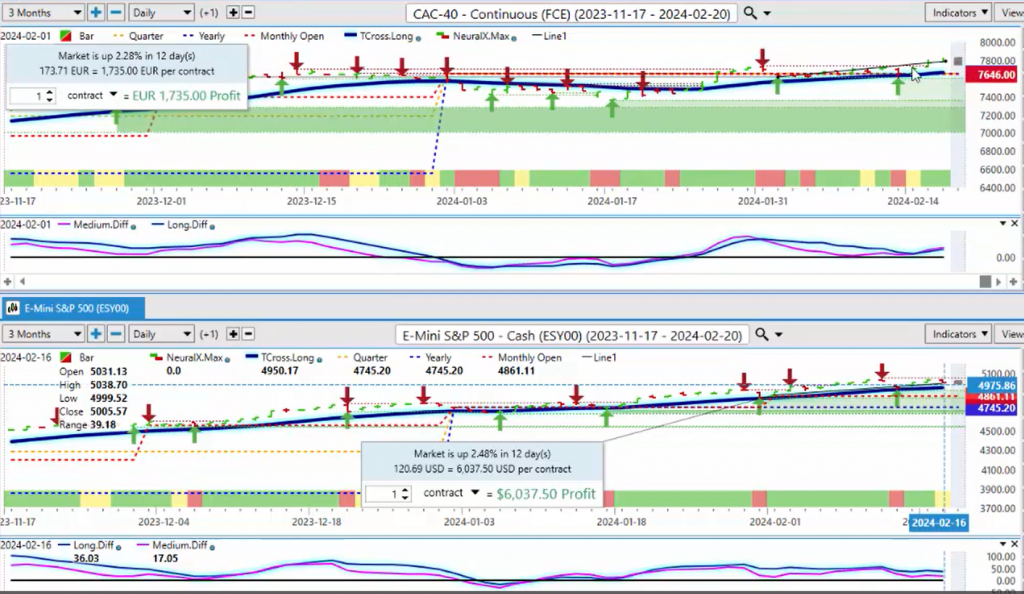
When we look at a comparative to the CAC 40, the CAC 40 basically mirrors the S&P 500 on a percentage basis at the start of February because, again, we’re measuring performance from February 1. I’m not interested in what it did 30 days ago, 90 days ago, 320 days ago. I don’t want to pull everything things that have happened in 2023 into 2024. We can do that via seasonal patterns, but we have to isolate that month to be able to do that. So right now, the CAC 40 is pretty much neck and neck with the S&P 500 on a percentage basis this month, still showing bullish. And I would argue that the European equity markets maybe are a tad more bullish than the S&P, but the main thing is to split our screen and identify how highly correlated these particular markets are. If we were to look at that CAC 40 and again, from an intermarket standpoint, this is what a neural net sees, guys. Again, when we’re talking about a moving average that’s separate from the actual neural index that runs these correlations. So again, if I look at the top 10 positively correlated markets to the CAC 40, we can see that there’s a number of stocks, US stocks, European stocks, the Euro Stoxx 50 93.25%. So again, some of these other different services, they use a different series of different technical tools, etc. But to have these types of capabilities to actually identify a correlated market and then put an actual percentage to it simply shows the value in the Vantage Point software, because if I don’t want to Trade the CAC 40, I can T-rade one of the other correlated markets. So the CAC 40 is still looking pretty good.
Dow Jones Euro Stoxx 50
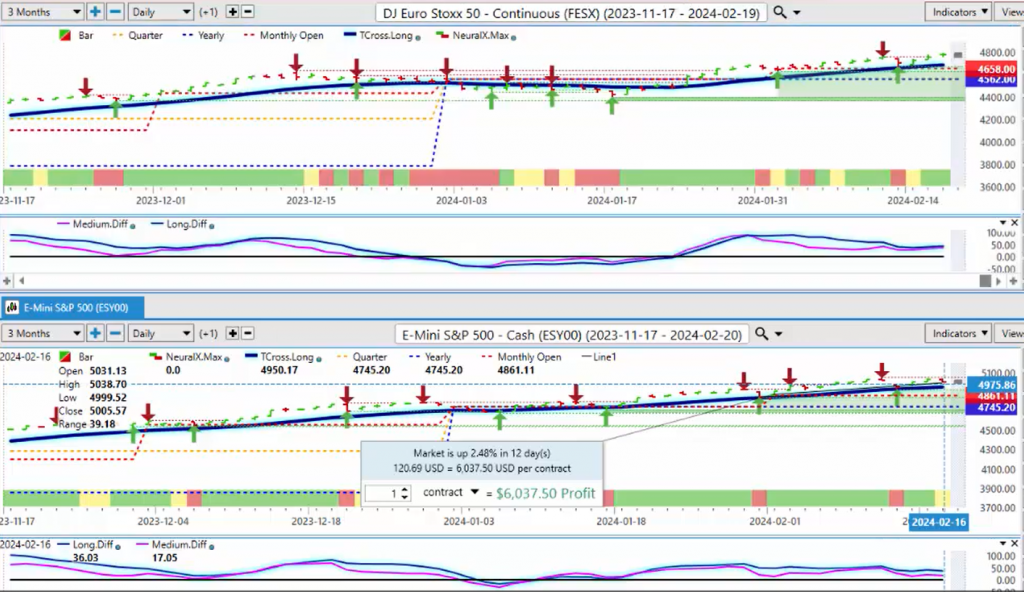
The Dow Jones Euro Stoxx 50, we can see that it too is climbing, looking pretty good. Now, a nice T-Cross structure here with the Euro Stoxx 50, we’ve got our yearly opening price, which is coming in at 4562, and then our current monthly opening price at 4658, excuse me. So again, if we’ve got pretty good support at 4562 and 4658, then we know where these particular major levels are. But usually, when the current monthly opening price moves above the yearly opening price, that’s a bullish move. Now, we can see the same structure in the S&P 500, our yearly at 4745, and our monthly at around the 46,000 mark, 48,000 mark, excuse me. So again, we just want to make sure that we’re seeing these levels on the Euro Stoxx 50 also following the S&P 500 very, very closely.
NASDAQ Composite
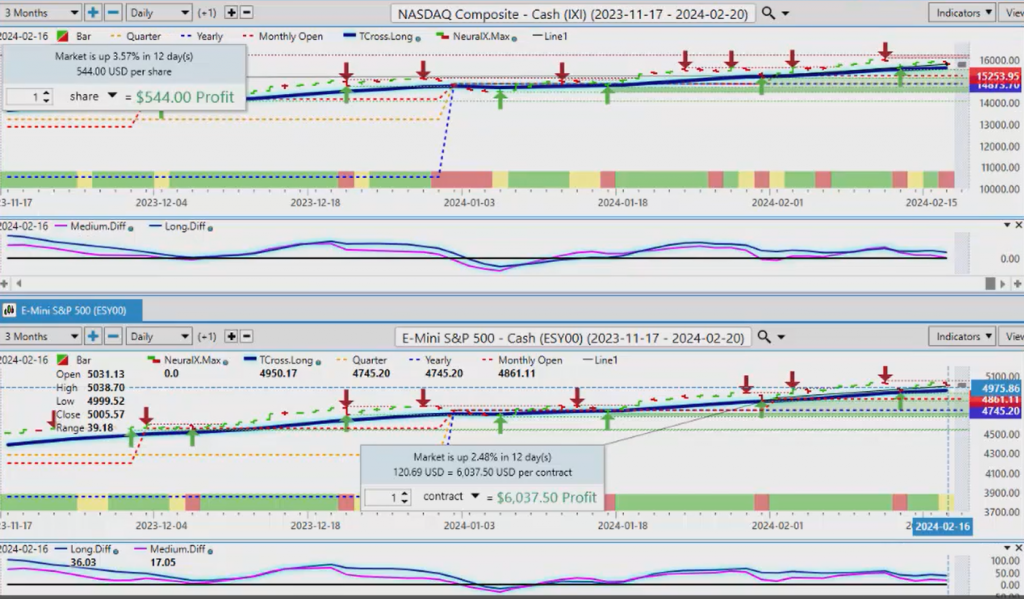
Now, when we look at the NASDAQ, the NASDAQ is still hanging in there, but again, a little bit of pressure coming in at the end of the week. But we’ve still managed to stay up 3.57%, so still one of the sT-Crossonger global indexes, I would argue. So, when we look at this, we can see that same stacked structure of support down here, with our monthly opening at 15,235, our yearly opening price at 14,870, and then we have our T-cross long at.
Nikkei
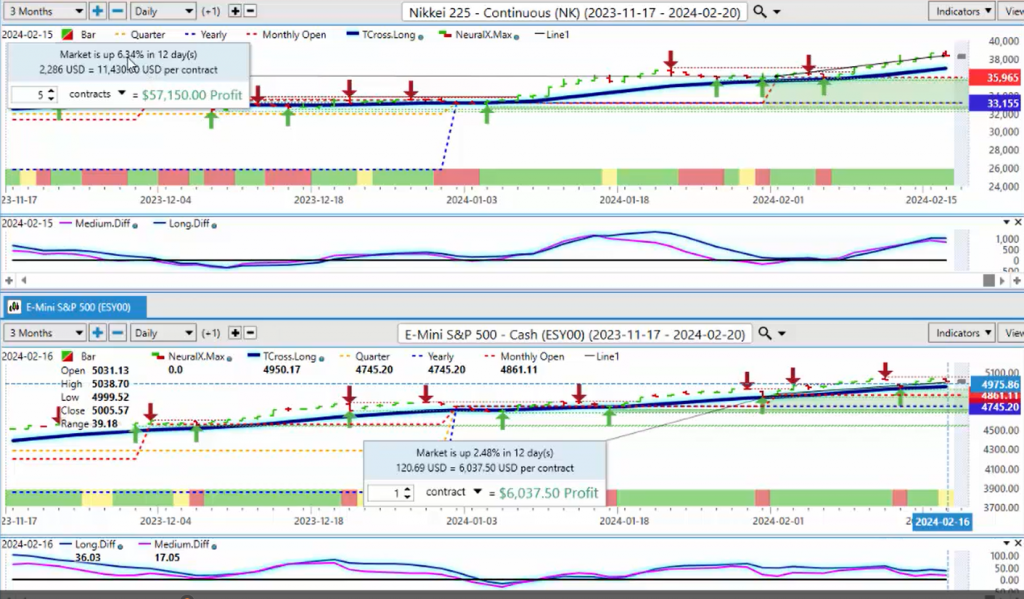
Looking at the global stock markets, the Nikkei up 6.34%, now this directly reflects the inverse correlation to the Japanese yen currency, the weakest currency in the Forex Market, that’s boosting their stock market significantly up 6.34% in just 12 Trading days. This is what we would look for, but again, if there is any interaction or intervention from the Bank of Japan, that could send the Nikkei lower very, very quickly. So always make sure that you understand that particular risk when it comes to Trading the Nikkei.
When we look at the Dow Jones Industrial, once again, we can see where this is actually, again, up about 1.26%, but we want to make sure we’re measuring that particular area. The T-cross long here is 38,389, then we have additional support at our monthly, current monthly opening, and yearly opening price down to 37,560. So the bulk of these global indexes are structurally strong on the global equities side. With all of the global events that are occuring, at any time this could change. As long as you know these key levels they are very tradeable.
Bitcoin
The real winner in February was Bitcoin. Bitcoin continues to shine here.
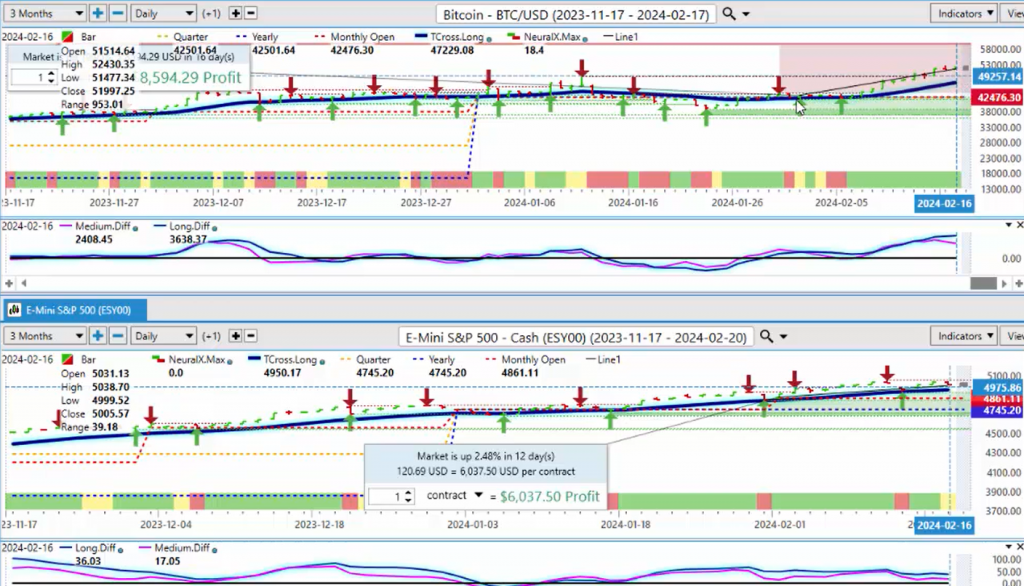
Bitcoin, on the month, up approximately, I’ll just move that over here, we’re up about 19%, I believe it is, on the month, and this is what we look for. Yeah, 19, almost 20% on the month, and with all the news of Bitcoin, Bitcoin ETFs, in my respectful opinion, this would likely have moved higher anyway. If we look at any calendar year where Bitcoin is down more than 50%, there has been a strong rally for the next three years. Last year we were up 155% approximately, so that pattern is already there. If we look back in time to 2004 approximately, when the market cap on gold was around 1 to 2 Trillion, and then gold ETFs came out, that increased market cap in gold to almost 16 Trillion. So, I suspect something similar will happen with Bitcoin, and that’s why Bitcoin has been so attractive, but there are very specific times of the year that Bitcoin goes up regardless of all of these other things. But for now, our T-cross long is coming in at 47,229, the approximate upside target for the month of February would be around the 56,000 mark. So, we’ll see if we can get there, but right now, it certainly is moving in that direction. But I will warn everybody that the medium-term predicted difference is breaking away from the long-term predicted difference. This measures the strength of that medium-term Trend and long-term Trend, so if the medium-term Trend is weakening against the longer-term Trend, we could see some retracement the other way. We would then look at that; we can see that our T-cross long is 47,229. If we click on our F8 in our VantagePoint software, then our long predicted is coming in at 50,439. That’s the level I would like to see hold, if at all possible.
Gold
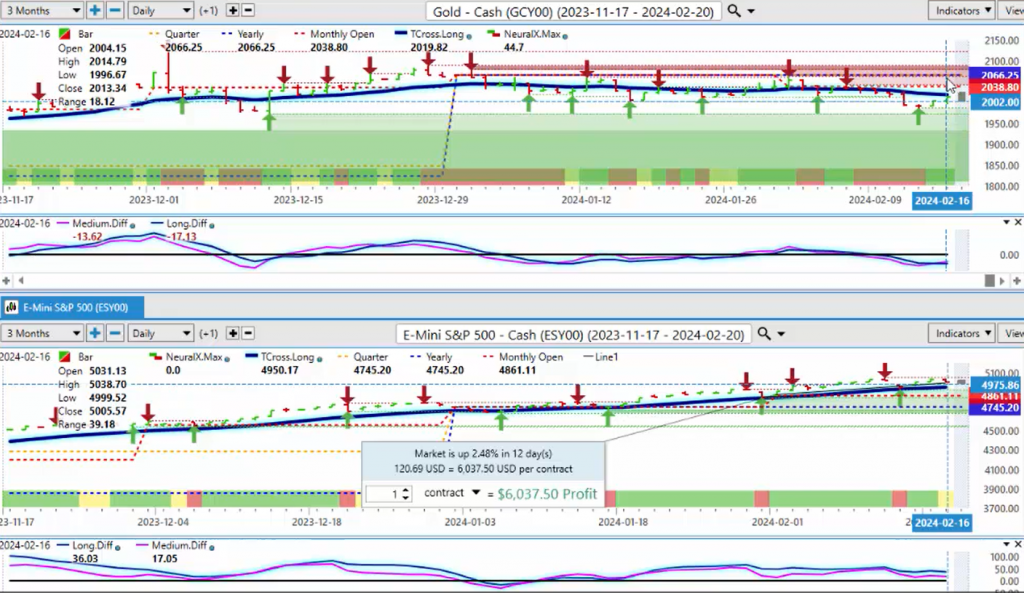
Now, when we look at gold in comparison to the stock market, we can see that we have an inverse structural bias to this market. Our yearly opening price at 2,066, excuse me, our monthly at 2,038, and this is, we have stacked resistance here, then we have our T-Cross cross long at 2,019. So again, in order for gold to turn bullish, we’ve got to retake that 2,066 mark. I believe we can; I just don’t believe it will be in the next month or so, barring another global war, another global catastrophe of some kind. But money appears to be moving more towards Bitcoin than gold, but that doesn’t put gold down and out by any means here. So right now, gold has retraced back up to our T-cross long at 2,019. That is our immediate resistance for next week, but be very careful with longs up here until we can clear that 2,066 mark and confirm that bullish sentiment going forward.
U.S. Dollar Index
Now again, when we look at the direct inverse correlation to the Dollar Index, it’s very important that we can see that there should normally be an inverse correlation. In my respectful opinion only, the dollar will likely remain strong in that seasonal pattern between mid-February and mid-March. But ultimately, stocks would be the one that would likely go higher based on what we’ve seen so far. But the first thing we want to do is make sure we’re identifying that predominantly there is an inverse correlation, but there the dollar also is a positive correlation to the VIX.
VIX
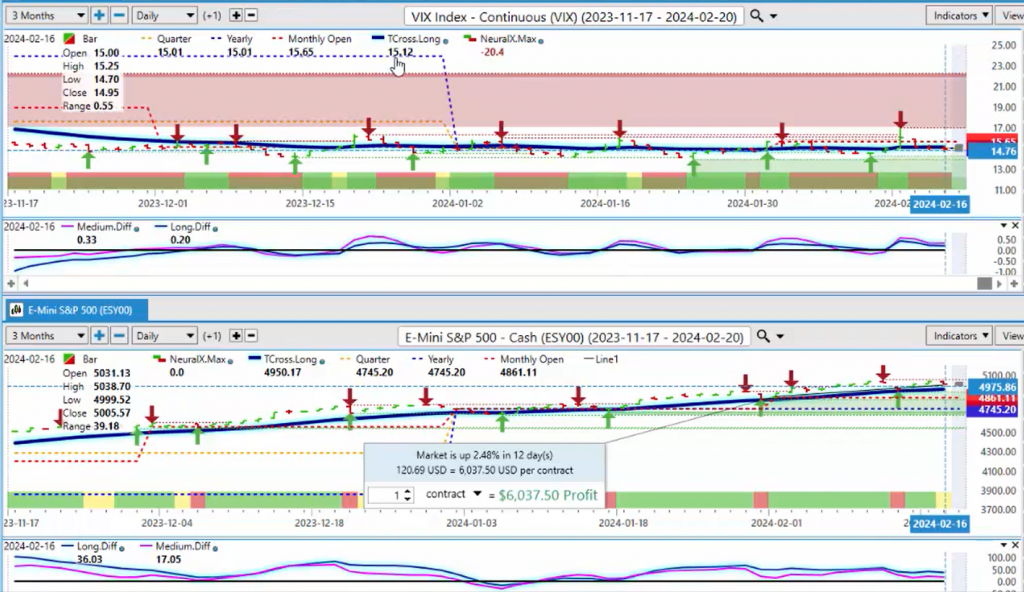
So the VIX remains sitting on the Vantage Point T-cross long at 15,12 on the VIX, still negative on the neural index, but the predicted differences remain above the zero line, and this is another strong factor. If we look at the pink line and the blue line, it’s measuring that strength. If we’re above the zero line, then a crossover is still in place, so the VIX is not overly bearish here at this particular time. And once again, when we look at the driving factors behind the scenes, the intermarkets that drive the VIX are identified on a yearly, a quarterly, and a monthly basis. If I take the top 10 positive and inversely correlated markets, then if that VIX goes up, then these markets will also go up potentially too. These are the things we want to make sure that we’re understanding. The yearly correlations are very heavily correlated on the yearly side to the stock market, but when we come back down here, we can see additional markets that are also correlated, using the neural networks to not only find these markets but actually put a percentage on how correlated they actually are, both positively correlated and inversely correlated. So if the VIX does slip and go down and equity shoots higher, then again, we would look at not just, we can look at the inverse markets like the S&P going up, S&P Global, the NASDAQ, you can see all these different markets that will go up if the VIX drops.
So, just a little peak into the behind the scenes of the Vantage Point software to identify what these neural networks are really doing and pointing out how powerful they actually are.
With that, now let’s look at some currencies.
Now, looking at the main currency market, once again, we would look at the inverse correlation between the dollar in the Forex Market. We’re either buying or selling US dollars; that is the main play, very similar to the stock market, the commodity markets.
If the S&P is healthy, we’re buying individual stocks; if it’s not, then we would step aside and be more particular in the stocks we buy. So, right now, with the Dollar Index, we can see that we’re above our T-cross long, that’s coming in at 103.83, but these indicators are a little bit soft here. Now, we have the FED minutes coming out, I believe, on Wednesday this coming week. The slightly hotter CPI number was balanced out by the retail sales number, and then the PPI number on Friday was very confusing. If I’m watching one of the key economists for CNBC looking at that and saying, “I don’t know how they got to that hotter number of 0.5,” I find that very interesting, guys, because I’m not sure how they got to that either.
So, only that for them to turn around and say the US has an inflation problem, well, that’s highly debatable. So, we go to the charts and look at this, and right now, the dollar is holding its gains, but the structural bias of this, 101.06 on the yearly opening, 103.38, this makes it very easy for me to have the proper anchor points. Again, rolling performance models 95% of the time lead to false price moves. They drag things over from the previous year, the previous month. We want to be very cautious with that; we need to stay current with our anchor points. So, right now, 103.38 is a very significant level of support on the monthly opening, but the T-cross long, 103.83, that is the one we want to watch to see if we can hold above that. And again, we can see that inverse correlation very, very strong inverse correlation.
Light Sweet Crude Oil
When we look at light sweet crude. When we split our charts like this, again, I can cover multiple markets all at once.
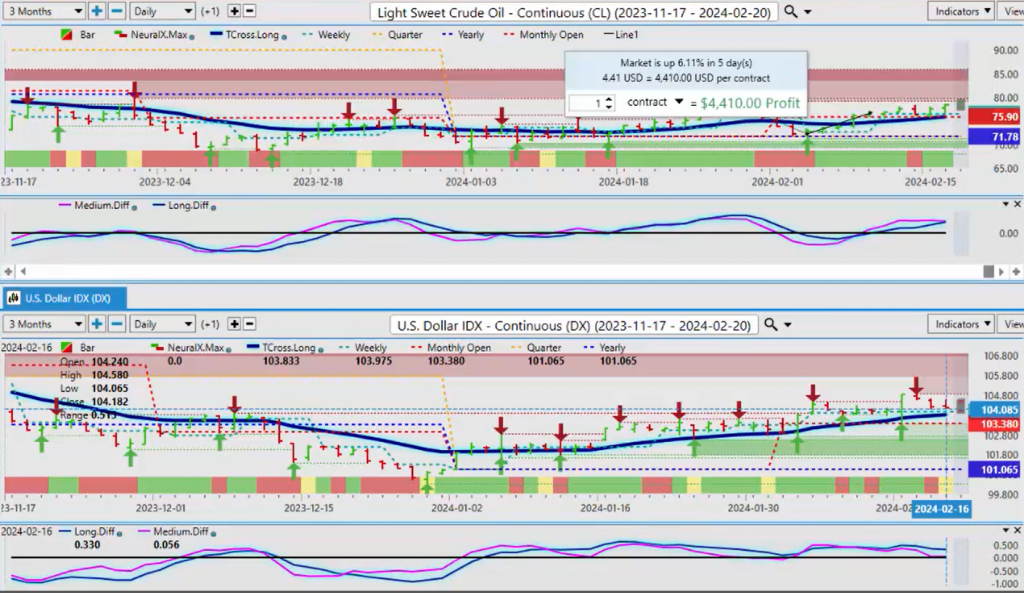
We can assess here, as I’ve warned, that there’s been a high correlation between oil and the US dollar. Oil is again, our yearly opening price, a fantastic Trade off there which we did in the Vantage Point live Training room. And on here, the yearly, current yearly opening price, again, if I took this number back and I didn’t use the current yearly opening price and I used a random 90 days, 300 days, 200 days, I wouldn’t have seen this, because again, the main thing to understand is when that neural index, based on the correlation to 31 other markets, turns, then we see this move up. So, once again, if oil is moving up, the probability is so is the dollar. So right now, covering two markets at once is much easier.
The light sweet crude oil, our T-cross long there, is coming in at 75.92.
But once again, here, guys, we’re not talking about just moving averages and certain things. If we look at oil, there is a science behind this. If we look at this and say, okay, if oil continues to go up, then these oil funds, United States Oil, the Commodity Index Trust, Ultra Oil and Gas, the Energy SPDRs, all of these have a high correlation. If it turns around and it goes lower, if oil goes lower, then these markets will go up from anywhere from 68 to 84%. So again, it’s important to see the power behind the tools of, because again, not only can we identify what the actual correlation is, but a percentage, 90%, 80%, 70%, which opens the doors to many other Trades.
So, right now, light sweet crude oil continues to advance. We have a verified resistance high that’s coming in at 79.24, and again, that is formed by two bars to the left and two bars to the right that are lower than this highest point, which created a failure point based on price action. So when we combine that with the VP indicators, we would look for this area to be taken out, or if you’re a short seller, that’s the area that potentially you may see work. And to that point, you can see that our MA diff cross is trying to turn back down to the downside, which could be an early warning sign of some dollar weakness.
Magna International ($MGA)
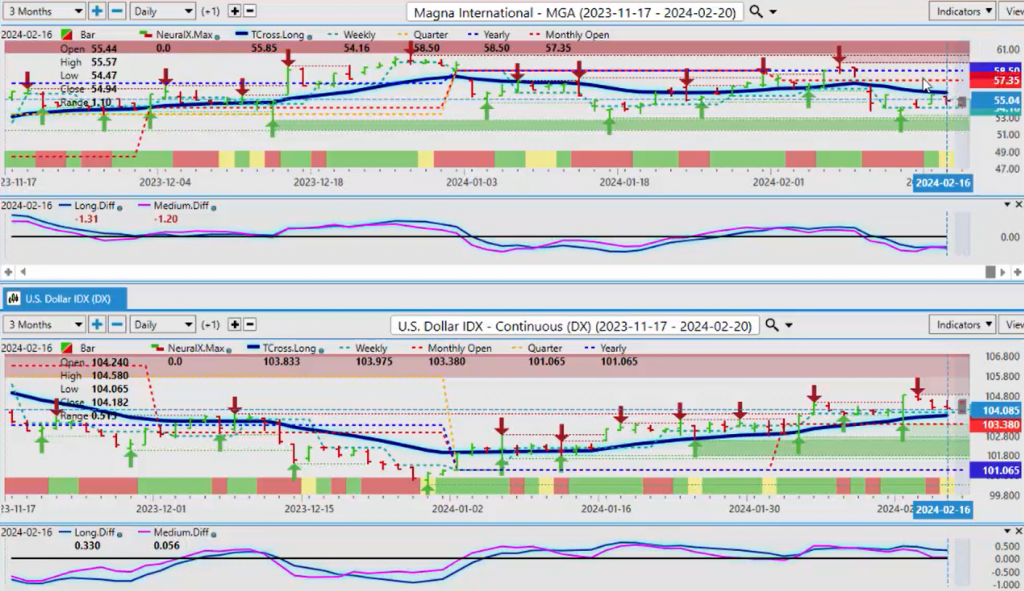
Now, another direct inverse correlation to the Dollar Index is your MGA stock. There’s about a 93% inverse correlation between this, meaning one up, one down. So, if MGA can move above the VantagePoint T-cross long, we could see some dollar weakness. But again, the proper structural bias, and this is easy to replicate, guys. The yearly opening price coming in at or about the 58.50 mark on this stock, the monthly opening 57.35, and we’re below the Vantage Point T-cross long. But as you can see, we did have some buyers coming in off the weekly opening price. So, unless there’s any real change in Magna getting over 58.50, then it still favors further dollar strength. That’s the way we would look at this. So again, we can cover multiple different markets all at once.
U.S. Dollar versus Swiss Franc
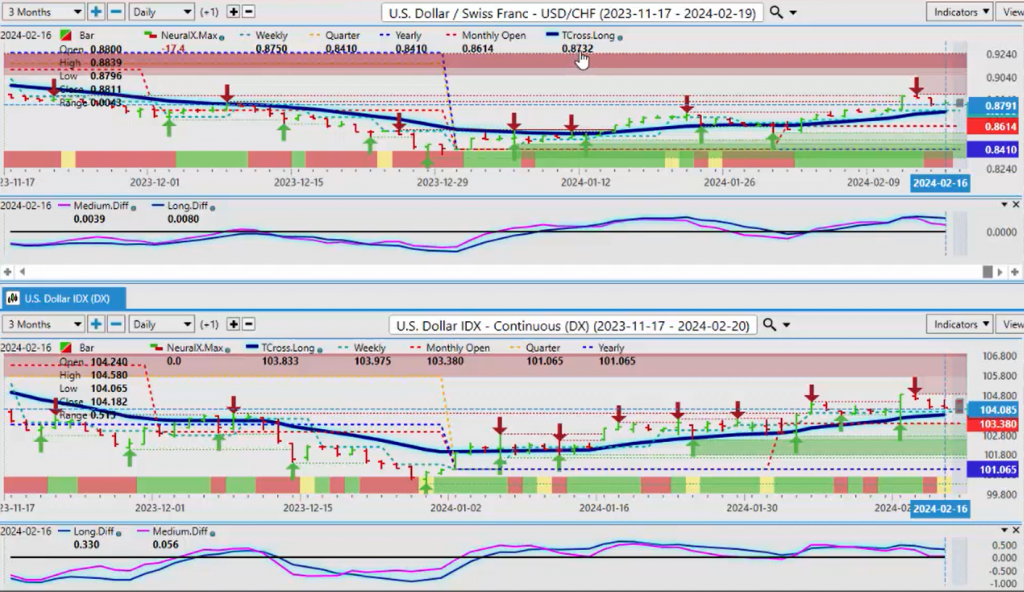
Now, when we look at some of our main Forex pairs, the US Swiss Franc is again about 98% positively correlated to the Dollar Index. So, if the Dollar Index slips and moves lower, then this pair will follow. So, the key level we want to understand there is 87.32. We remain long while we stay above that area. But again, looking at that structural, creating your own structural bias in the market with the current yearly opening 84.10, monthly 86.14, all of that structure is down here where, again, we want to make sure we’re looking at that with our stop placements, etc., or simply gauging from an objective standpoint that this is what the market is doing. We’re positive on the month, we’re positive on the year, we don’t want to complicate it with putting 50 indicators on here and getting all confused. We want to keep it simplistic, identify the intermarket correlation, identify where we are in the year, the month, and in relationship to the T-cross long and the neural index picks up the additional work for us, but with by using the correlation to 31 other markets.
British Pound versus U.S. Dollar
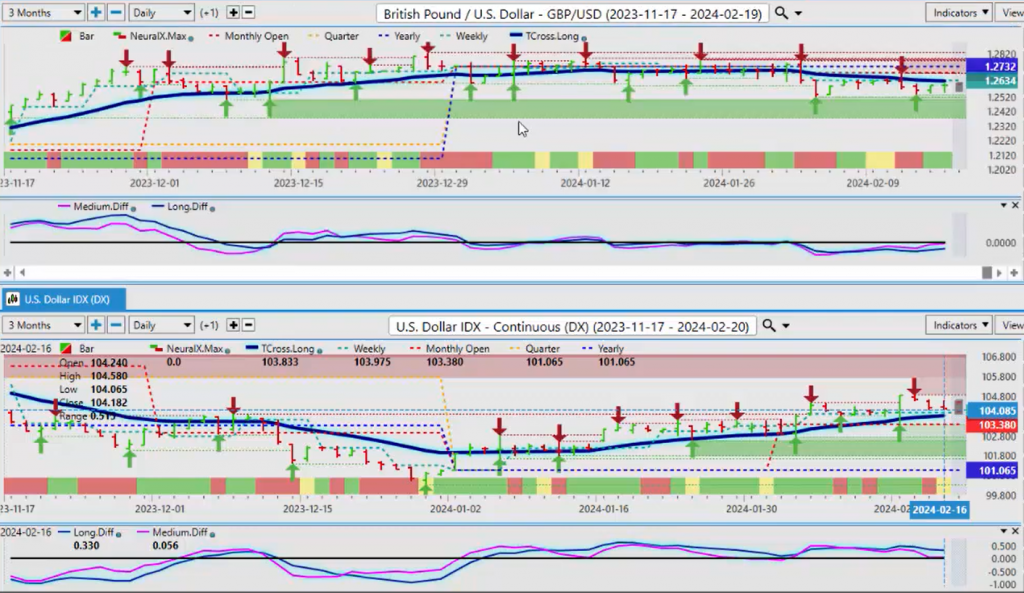
Now, when we look at some of the additional pairs here for next week, the Pound-Dollar is going to be an interesting one. Can it start to push higher? I think it’s going to be probably closer to mid-late March before the pound sees any relief here because again, the structure of this, we have to get above 1.2732 to turn positive on the year. At the very least, we’ve got to get above the monthly opening price at 1.2685. So, it is Trying, but again, constant failures this entire week into that Vantage Point T-cross long. And if you’re identifying that, you can Trade it. There is a little bit of strength coming on that medium-term predicted difference, but again, we’ve got to get through this wall of resistance before it sees any real buying on this particular pair.
Euro versus U.S. Dollar
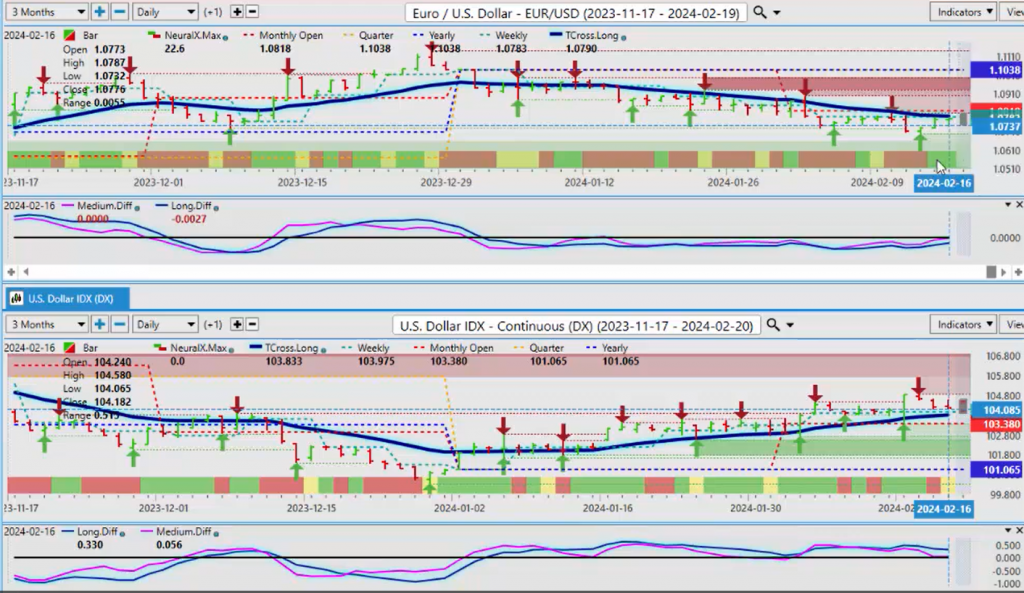
Now, the number one Traded Forex pair, of course, is the Euro-US. We remain structurally bearish on this. 1.1038, if you bought EUR the Euro-US pair on January 1, you have consistently been down money. If you sold it, you have been making money day after day, and using that Vantage Point T-cross long as a pivot area has been a fantastic entry point on a weekly basis. Again, guys, there’s a lot to the software, which I’ve shown you in this presentation, using the neural networks to identify correlated, inversely correlated markets, and just get that overall structural bias of whether something is bullish or bearish. So, there’s a little bit of bullishness with the neural index, but we’ve got to get positive on the month, we’ve got to get over the monthly opening, and more specifically, stay above the T-cross long at 1.0790. So, still a slight biased negative bias on the Euro, but those FED minutes on Wednesday could really shake things up.
U.S. Dollar versus Japanese Yen
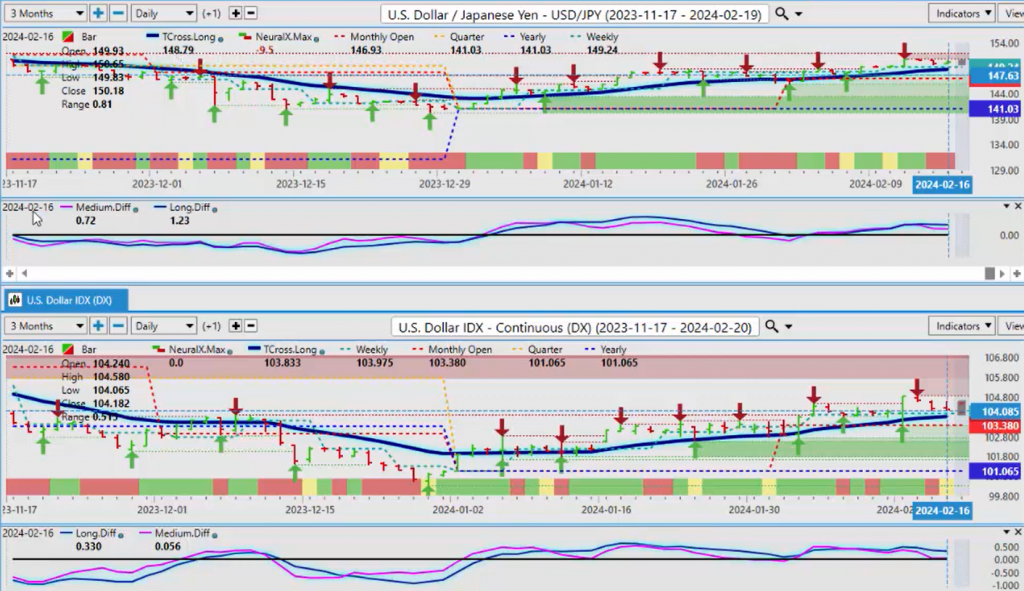
Now, when we look at the Dollar Yen, again, this is still a carry Trade, but we’re just, every week, we seem to make a new high. The question is, can we get any follow-throughs? So, 1.5088, still can’t believe that the dollar yen is at $150. I’ve never Traded this pair at these levels, guys, and the Bank of Japan only have themselves to blame for this with that verbal intervention prior to the FED starting to hike at an unprecedented rate. So, this can come unwound very quickly if the Bank of Japan steps in. So, I would warn everybody about that because there is some still some underlying weakness. But again, we’re holding above the yearly, the monthly opening, and the T-cross long are the two you want to watch 146.93 on the monthly and the T-cross long coming in at 148.79. If we lose the 148.79 area, we are likely to Trend lower.
U.S. Dollar versus Canadian Dollar
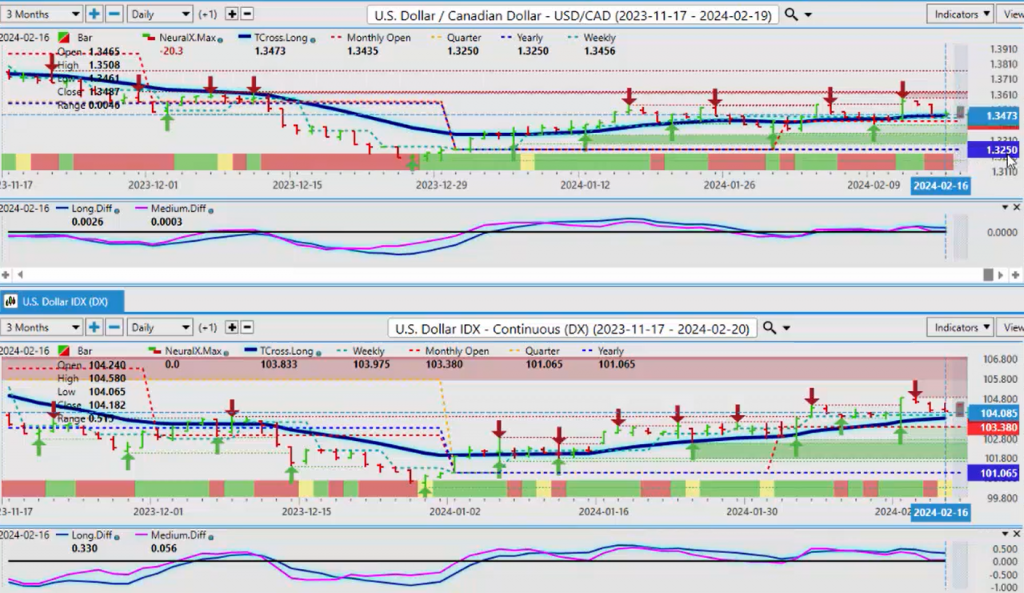
Now, when we look at the main equity-based currencies, the US-CAD, it’s basically the Canadian dollar survived this week based on oil prices alone, certainly not based on the Canadian economy, the Canadian jobs numbers. But there’s quite a bit of data coming out next week in Canada: CPI, I think, retail sales. So, it’s going to be a very active week for the Canadian dollar next week. But 1.3250, the yearly opening price, the monthly 1.3435, and then we have some verified zones running along there. So, we’ll keep an eye on the 1.34 level. We want to stay above that if we’re going to remain buying this pair.
Australian Dollar versus U.S. Dollar
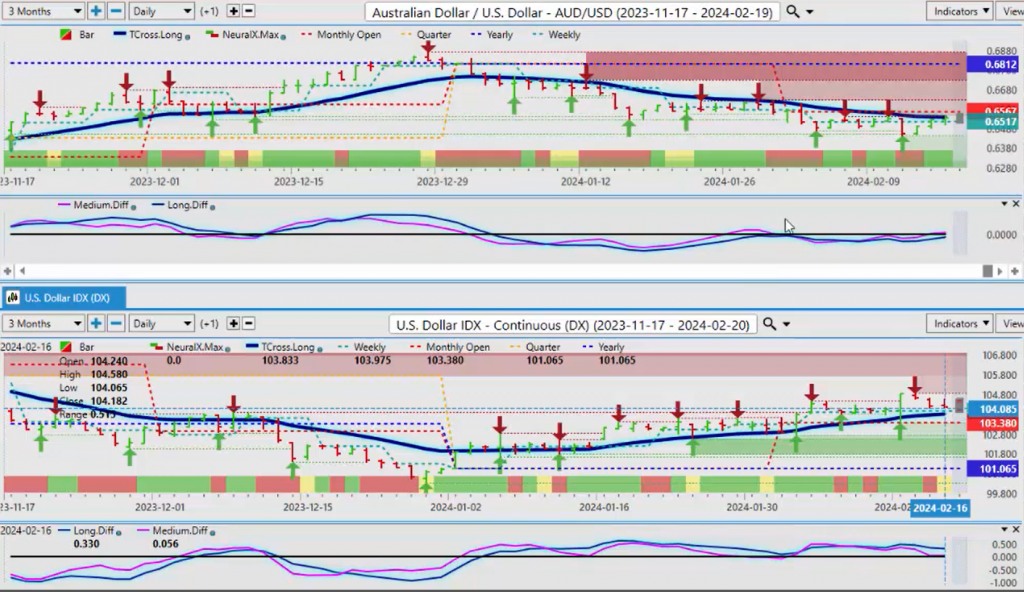
Now, when we look at our two, our Kiwi and our Aussie currency, basically a very similar Trade, and you can see that it’s pressuring the Vantage Point T-cross long. The monthly opening price coming in at .6567, providing that backup resistance. If the stocks slip and gold slips further, that will put pressure back on the Aussie. Ultimately, Aussie is likely to go higher this year, but probably not in the first quarter or part of the second quarter. We’ve got to get past this period of dollar strength. So, right now, the structural bias of this, .6812, clearly bearish on the year, but the further we move away from .6812, the more likely it is we’re going to retrace to it. And I would argue something very similar with the Kiwi.
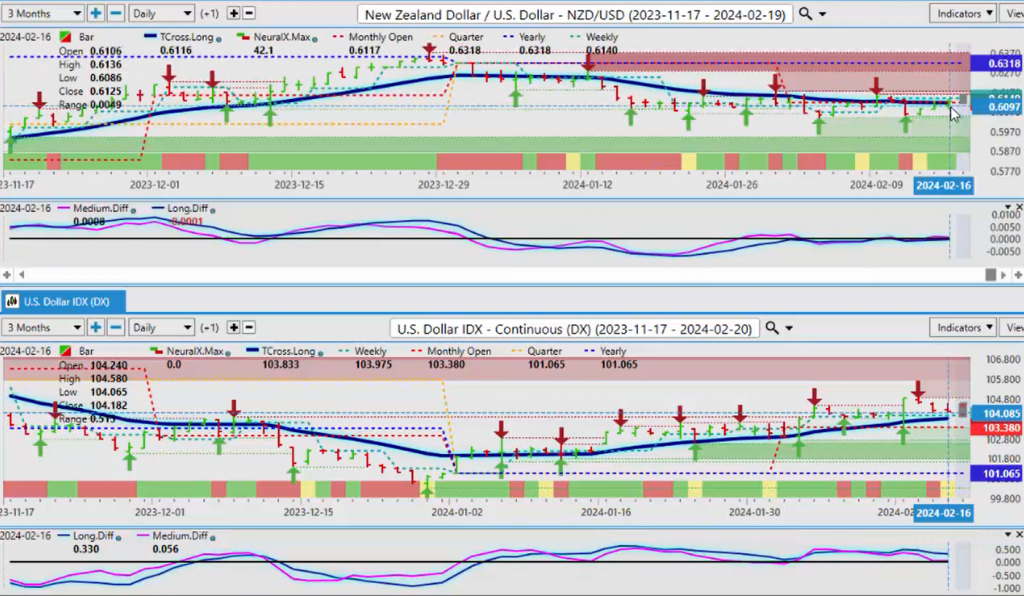
New Zealand versus U.S. Dollar
The Kiwi is really Trying to turn bullish here. We did close above our T-cross long and above the monthly opening, but you’ll notice we struggled right on the current weekly opening price. So, if we can break free and clear of this, we can target back towards the .6318 mark.
So, a very busy week next week, mainly, I would say, in some of the US data later in the week, and the Canadian dollar will be a lot of activity at the beginning of the week. But also remember, we’re in a holiday-short week: Family Day in Canada, I think President’s Day in the US, so the markets will be closed on Monday. So, expect the Monday-Tuesday reversal that we’ve discussed on here to shift to Tuesday to Wednesday. So, with that said, this is the VantagePoint AI Market Outlook for the week of February 19th, 2024.


