Register for a Free Live Training
The Hot Stocks Outlook uses VantagePoint’s market forecasts that are up to 87.4% accurate, demonstrating how traders can improve their timing and direction. In this week’s video, VantagePoint Software reviews forecasts for SPDR SPY($SPY), Tesla Motors ($TSLA) Marriott ($MAR). Microsoft ($MSFT), Spirit Airlines ($SAVE), Under Armour ($UAA) and, Pfizer ($PFE)
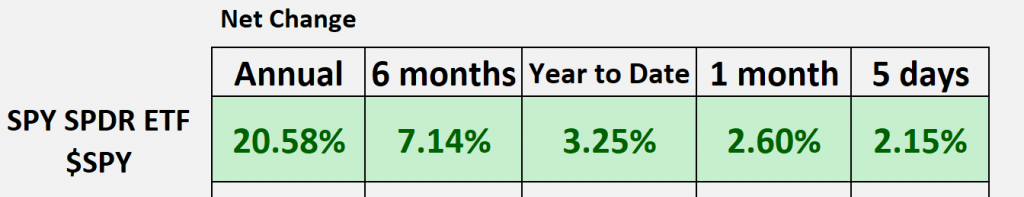
SPDR SPY ETF ($SPY)
“Hello again Traders and welcome back to the Hot Stocks Outlook for January 26, 2024. I hope you all are having an excellent week out there in the financial markets. As always, we’ve got plenty to cover here in our Outlook and if you haven’t already, go ahead and click on that link in the description below, and what you can do is get a live demonstration to learn all the specifics about how really the suite of predictive indicators can help you make much better trading decisions out there in the marketplace.
As we typically do, we like to take a look at the broader markets here via the Spy or that S&P 500 ETF, and so we can see that last week we started to talk about things are starting to skew a little bit higher. Here we looked at shares of Microsoft and you know really just looks like the market is really has a lot of momentum to the upside here, and so what that’s led to is a nice rally over this past week and past 30 days here we’re up about 2 and a half%.
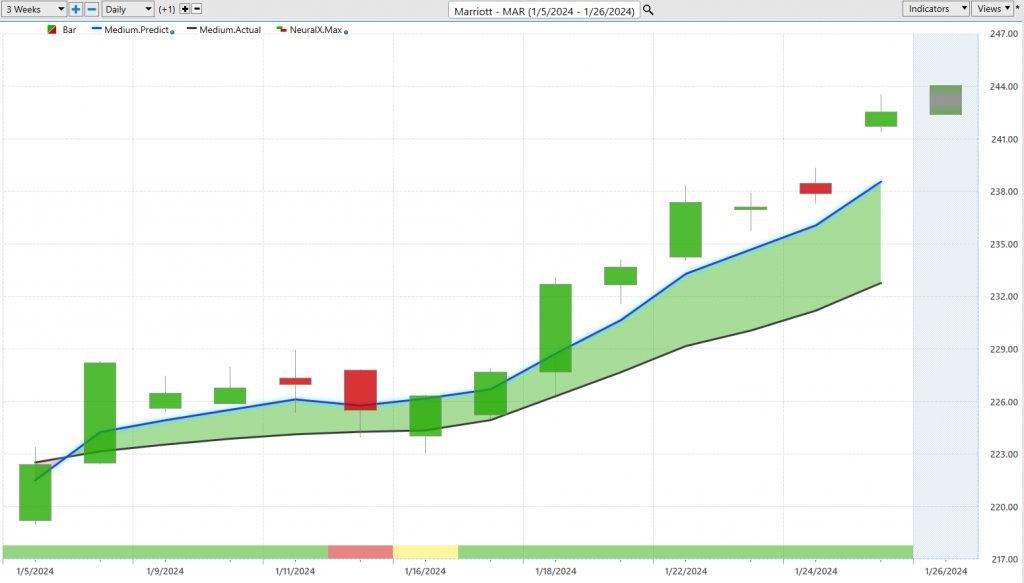
But what we want to really focus on is where are these opportunities and where can we really, you know, limit the risk based on our Marriott ($MAR) trading approach and style here.
So, I wanted to start out with here with shares of Marriott, and so this is really a good example of how all of these predictive indicators work together. What you’re seeing here with shares of Marriott is daily price action, right? So each one of the candles that you’re seeing represent a full and complete trading day, and it’s right up against all that price data that what you’ll notice is there is a black line and also a blue line value. So what that black line value on the chart is is a simple moving average, so this is a very common technical indicator. In this case, it’s referred to as the actual simple moving average and it’s really just a 10-period close simple moving average. It’ll take the last 10 closes, add them together, and then divide by 10, and so what it does is it smooths out the existing price action to let us know where the market has been over this given period of time. But Traders need to be ahead of the next move, and so what we’re able to do is compare what you might call that lagging moving average to this proprietary predicted moving average. For this price, essentially the forward-looking prediction of price for this to be calculated and plotted on the chart every evening. Well, this is where that technology of artificial neural networks comes into play, and what it’s doing is it’s analyzing the relationships that are known to drive and influence the future price of Marriott, and that can exist in really dozens of other markets. Now it can be things like the S&P 500, it can be things like the value of the dollar index, it can be things like the gold market, right, these big macro Giant Markets, things like interest rates and bonds. But it’s also going to look at certain ETF groups, and we know that these markets are highly correlated, and we can extract some of these important price clues that can help you when you’re trading that Target Market, in this case, Marriott, but it also goes down even to individual stocks. So potentially, other Hotel stocks that share some positive correlations or potentially the software even found some inverse relationships that are valuable to predict future price action in specifically Marriott here.
Whenever we see that Blue Line crossing above the black line, well, what’s happening is those predicted artificial neural networks are skewing the forecast more bullish, making this Price Forecast more bullish and letting us see, okay, well, there’s potentially an opportunity here where price is starting to advance. And as long as that blue line remains above the black line, well, we’d expect the trend to resume, and we can see that since that forecast came through we’ve had about 13 trading days. Market up about 8% or so, but this is really where all of these predictive indicators come together. Now if we look at the very bottom of the chart, what you’ll notice is there’s this bar that goes from Green, there’s one little red situation in here, and then it goes back to green, and this indicator is updated every single trading day, but it’s tuned to solve a different problem. Right, it’s not looking at average prices and cutting out the lag time as far as those signals. What it’s doing is really looking short term over a 48-hour period and is their strength or weakness over that subsequent 48-hour period. And so what we can see here is that you’ll get these situations where when that blue line crosses above the black line neural index bullish, it’s a good sign that this trend not only in the short term but potentially the longer-term trend is reversing, and what you’ll notice here is that neural index goes down to a red, and you see that you get a couple of days where those, you know, really those kind of Gap downs and lows are a little lower than the previous close, and that’s to be expected and can actually benefit traders to say, okay, well, maybe I want to be buying at lower levels here expecting this overall trend to resume. And so lastly, what you’re going to see here is you’ve got a predicted high and a predicted low, so now we’re really down to like intraday price action. We’ve got a 48-hour indicator that’s extremely accurate, I mean upwards of 80 plus percent accuracy across a wide range of markets, and a highly accurate Vantage Point predicted moving average that’ll help us identify these reversals and moves early.
And so when we look at, okay, well, let’s look at those predicted highs and lows against the actual price action, you can see how this works, you know, day traders can use these levels to set entries and identify profit targets with, you know, the predicted highs, or you can accumulate a position, right? If you’re a trend trader, you may want to accumulate a position, you can do some short-term trading but know hey, I want to be longer over the long term, and catch this move here. So you see that we start to see this volatility pick up, the market starts to advance, and it does a really great job of picking up on some of these levels even as that momentum is in the market here. So you see we get this predicted low again, all this momentum coming in, but just a tremendous amount of strength for swing traders to understand that look, this is bullish, hold on to your position until we see that neural index get bearish or potentially the blue line cross below the black line, well, there’s not much to say here as far as what the overall trend is.
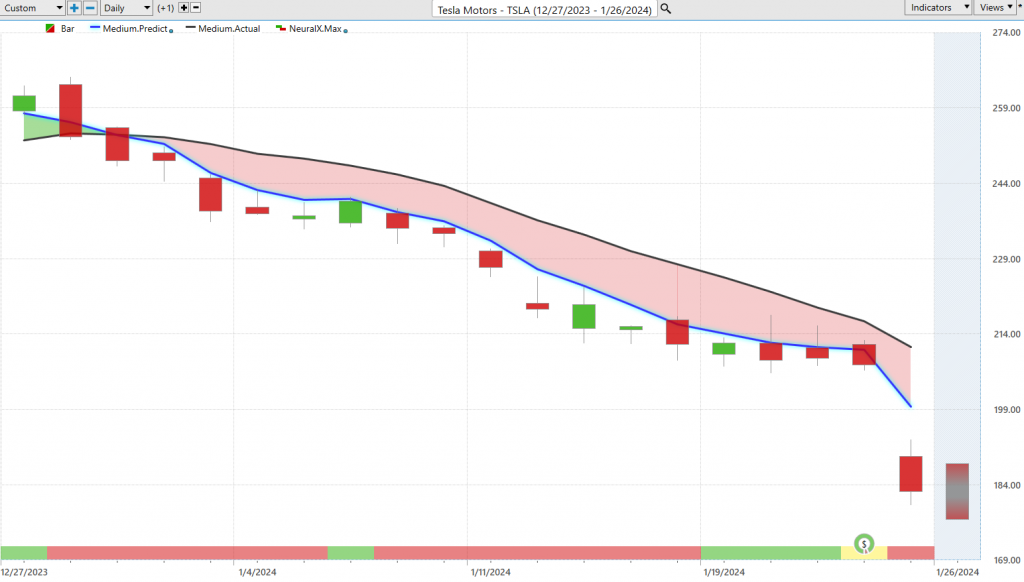
Now we talked quite a bit about Tesla ($TSLA), well, the strength in the market but also identifying that there are some potential trouble spots here. And so Tesla was really the leader on the weak side, right? We have Nvidia, AMD, Microsoft, everything straight up along with the indices, but something’s going on here with Tesla, and so what we see is that Blue Line crossing below the black line really at the beginning of the year, and what have you seen as far as the Vantage Point forecast? Well, we have one day where the
neural index goes bullish, we quickly go back to red, and we get this period leading right into earnings. But what has been the situation here is you do not want to be long Tesla, you don’t want to be looking at this like those other tech stocks in the NASDAQ, and use those predictive indicators accordingly. So if you want to establish a position potentially even before earnings, well, you have all of these levels to get a really nice cushion going into that volatility Catalyst. But we can see that yeah, the trend resumes, and Tesla shares go even lower here. So we can take a look at this overall move, but this is a really great place to hedge some of your positions, right? So if you’re long in the market, well, you can take those long positions but balance that out with potentially some shorts here on Tesla. You’ve seen about a 27% decline just in the past last 18 Trading days, obviously a lot of that coming after earnings here as this accelerates to the downside. And again, we can look at these predicted highs and lows even leading into earnings, look at these excellent levels that say look, you don’t want to be long up there, and then this thing snaps down, and then really starts to move away from, you know, the Longs here.
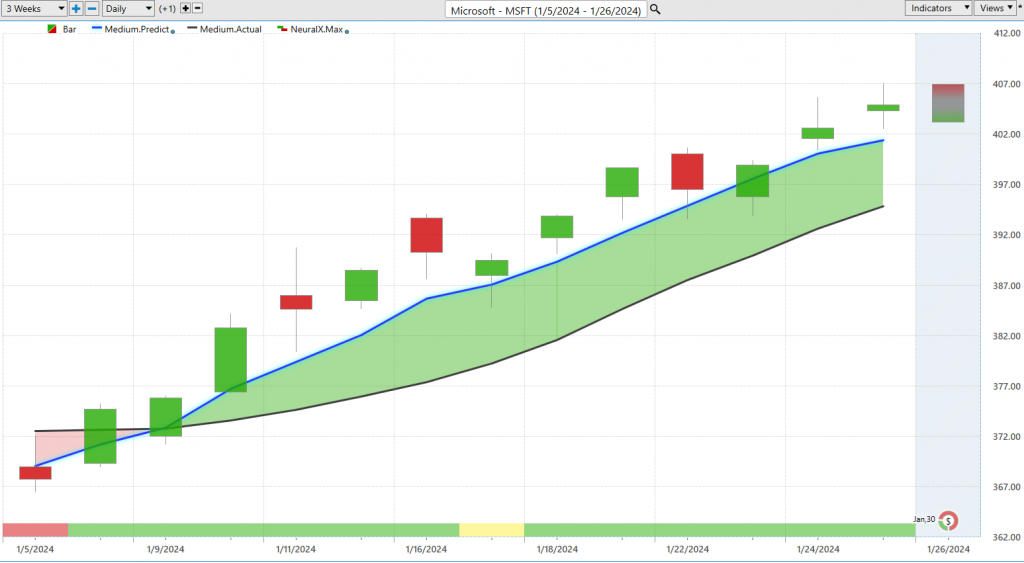
Here’s Microsoft ($MSFT), so you Microsoft know we keep talking about where the strength is, right, in these kind of obvious places, huge correlations with the S&P 500 Index, and so to get that sense of, you know, hey, there’s still a lot of strength in the market, what should we expect from the indexes? Well, with Microsoft going straight up here, blue line over black line, neural index has remained bullish the entire week, and even this week it was just about perfect here as far as these Vantage Point forecast. If you remember Monday here what happened was the market gapped up to about 400 and sold off and opened up some really great buying opportunities on the bullish side here. So just in the past week from those predicted highs to predicted lows, we got a nice move here of about 2 and a half%, just over the past again four trading days there. So 500 shares $5,000 even 100 shares there is going to have you up pretty solidly here.
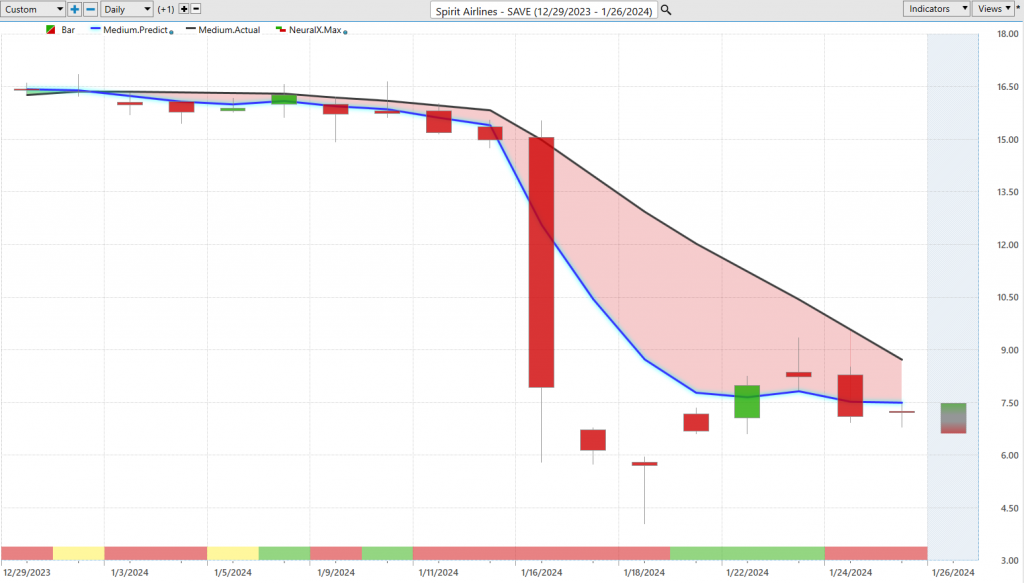
Lastly, here well not lastly we got Spirit Airlines ($SAVE) Airlines, maybe lastly is some of the bullish opportunities here. And so here’s Spirit Airlines, so you know there’s been a lot of news around some of these stocks but clearly this is not an area where you want to be messing around, right? We looked at Boeing, and so even before that, you know the door flew off one of the cabins it was already showing Boeing in a downtrend, and that’s only accelerated here with Spirit Airlines. We see that Blue Line crossing below the black line, you get a couple of blips here with that neural index getting bullish but what’s happening right you know some moves up to potentially some predicted Highs but the overall trend is bearish. And then you see when all of this comes together that momentum really really heats up and even here on the bullish side, right? So you see you get that neural index bullish a couple of bullish trading days but not an area where you want to be long and this has just been an absolute disaster for any Traders on the long side of this. So uh shows how important this is to you know make sure you’re not involved in things but potentially a really profitable opportunity here where you’re up about you know 55% 500 shares another about $5,000 move and this is again a much cheaper stock here. So even a small position can have you up pretty nicely here and also hedge you know some of those more exciting things in the market that are in a bullish Trend and are moving along with the indices and the S&P.
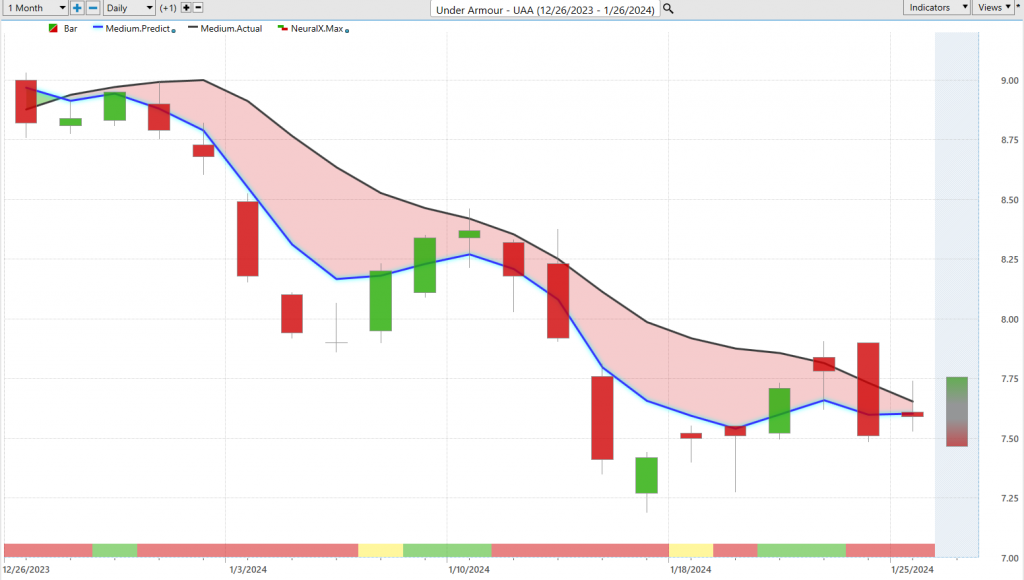
Here shares of Under Armour ($UAA) again a good example of just some of these areas that you potentially want to avoid or short so you get that Blue Line crossing below the black line um got a really nice run up to about $9 but this whole past month here is saying look all you want to be doing is short take profits on shorts and you you know don’t really get wrapped up in some of these stocks that are moving lower and so one of the situations that we have right now is just there’s you know a lot of those tech stocks like Microsoft, Nvidia you know Adobe started to do well. You know marvel they’re all extremely correlated and this really speaks to vantage point and how you can use these uh you know tools to say okay well you know if we need to find some areas to short. To really complement a lot of these things are just modeling the index and and really going straight up day after day here see about a 9% move here uh just over the past 12 trading days here in Microsoft.
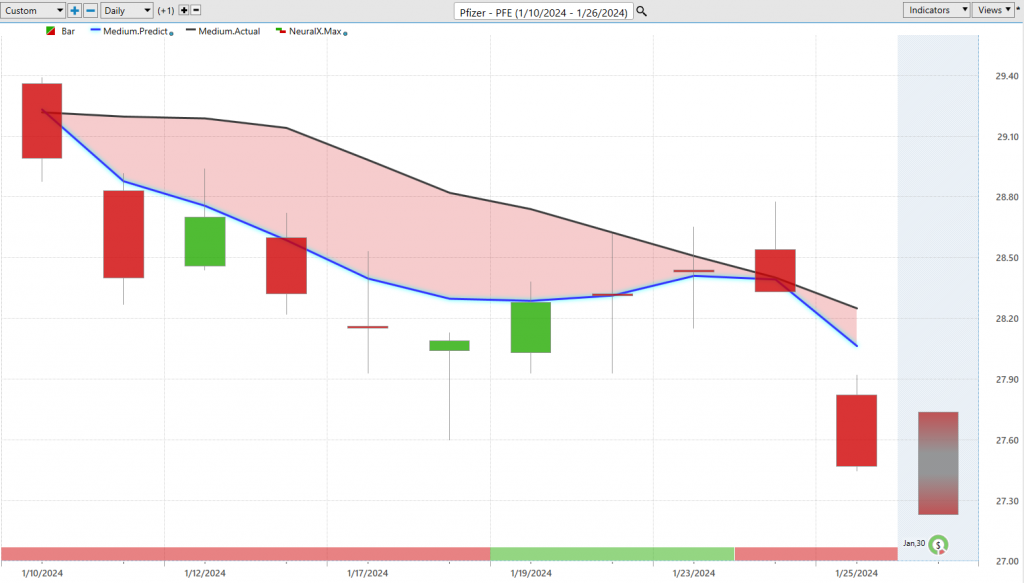
Lastly here are shares of Pfizer uh so crossover blue line over the black line or below the black line here a lot of weakness from the neural index pops up you get a couple days of strength but again these are not the areas where you want to be getting long um and really do a good job to complement some of those more bullish things in the portfolio that are holding up quite well so uh here shares of Pfizer again off let’s see about 5 point you almost 6% here um and it’s a really interesting Market here because we have these really obvious places just going straight up you know if you want to trade the indices a lot of these these tech stocks the forecasts have been very straightforward but when you start digging into the S&P 500 and looking at more broadly at stocks there are a lot of problem areas you know Tesla is a good example of this the Airlines Boeing so there’s many areas you know United Healthcare uh human a lot of big stocks selling off pretty viciously and the last thing you want to do is really not be prepared be positioned poorly really have you know poor entries potentially in those positions as well so uh we can see here that you know Vantage points just been doing an excellent job here you know highlighting these little adjustments that you can make to your positioning and make sure that you’re in the right spots to you know make some money I mean even here yesterday moving to the predicted low moving up to the predicted high and seeing a close right in the middle of that range so uh we’ll go ahead and leave it there not a whole lot has really shifted you got these big things going up and then Tesla going down and um that’s really about it and then it becomes a mixed bag of all these other things that are moving around but real obvious stuff seems to be here in Microsoft Nvidia AMD we looked at last week having a really nice week in the market so uh once again this has been our hot stocks outlook for January 26, 2024 thank you all for watching best of luck and bye for now.