


Register for a Free Live Training
The Hot Stocks Outlook uses VantagePoint’s market forecasts that are up to 87.4% accurate, demonstrating how traders can improve their timing and direction. In this week’s video, VantagePoint Software reviews forecasts for SPDR SPY($SPY), Pulte Homes ($PHM), Beacon Roofing Supply ($BECN), Thor Industries ($THO), Tesla ($TSLA). JABIL ($JBL), and AMDOCS ($DOX)
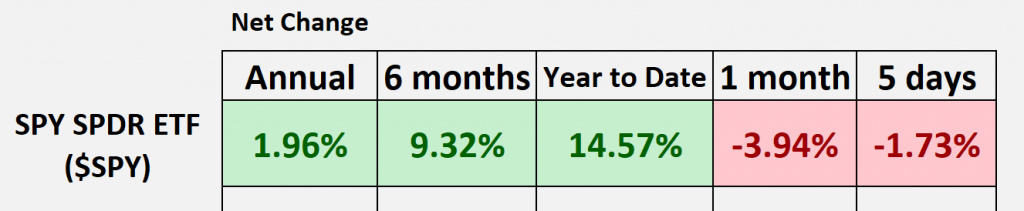
SPDR SPY ETF ($SPY)
Hello again, traders, and welcome back to the Hot Stocks Outlook for August 18th, 2023. Hope you all have had a excellent week out there in the financial markets. As always, we’ve really got a really ton of new opportunities opening up, a lot of volatility coming into the marketplace, so a lot of things to highlight here in this week’s Hot Stocks Outlook.
So, like we typically do, let’s just look back at some of this performance out of the SPY ETF, or essentially that S&P 500 Index. And we can see going back 12 months, well, we’re actually only up about 2% now. Still those year-to-date numbers starting in January looking pretty good. But what we’ve been highlighting over the past few weeks, really since the beginning of August, is weakness across the tech space, and then actually seeing more of that open up, that broad-based weakness in more sectors and areas of the marketplace.
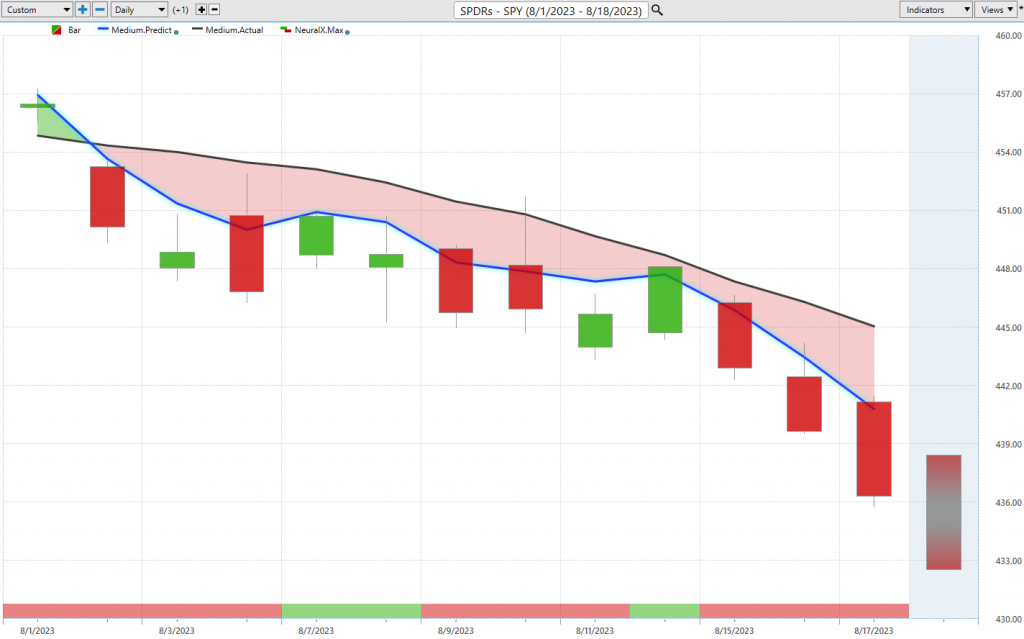
So, this is what I actually want to highlight here with some of these new opportunities we’ll take a look at, but then also some of those older opportunities really forewarned of some of this cracking, especially in some of the tech space here. So, what we can do is start out with the SPY ETF itself. And this is a really good example as we go ahead and look at these daily bars. So, each one of these candles on your screen represents a full and complete trading day, and it’s right up against all that price data. What you’re going to notice there is that there is a black line and blue line value right up against the price data. And so what that black line value is is actually a simple moving average, and in this case it’s a 10-period simple moving average. So, you just take the 10 closes, add those all together and then divide by 10, and what that does is smooths out the existing price action for traders.
But the problem with traditional technical analysis like this is that all the data generating that indicator comes from the past and it’s always going to be lagging the market. And so what we want to do is compare that black lagging moving average to this proprietary predicted moving average. And for this number, essentially this price value to get plotted and calculated on the chart every evening for traders, well, this is where the technology of artificial neural networks come into play and they’re performing what you would call intermarket analysis. So, for that value to get plotted on the chart and to see these fresh crossovers, well, this is where VantagePoint is performing that intermarket analysis. And so what that means is it’s going to be looking at other markets that are known to drive and influence the future price of the SPY ETF.
Well, that can be things like the other ETF markets, that can be things like the futures markets, things like the Dollar Index, global interest rates, as well as individual stocks which can share some important price clues as towards forewarning of where this particular target market, you might say, needs to move next. And so whenever we see that blue line, in this case cross below the black line, well, you’d expect those average prices to start slipping or moving lower over time and therefore the trader can come in and bring in their overall strategy.
Now, when you have an index like this, it’s going to move a little bit more slowly than individual stocks, but you see here over the past 12 days, we’re down about 3%, almost 4% out of the SPY ETF. And what’s more really exciting about this are some of the shorter-term tools that can help you as a trader when really jockeying for position in some of these shorter timeframes. So, if we look at the bottom of the chart, you’ll see this bar that goes from red to green back to red, and this is also driven via that neural network technology. So, it’s looking again through those price clues, looking at those intermarket relationships and then generating this highly accurate prediction of whether you’re going to see short-term strength or weakness over the next 48 hours. So, this is, again, tuned a little bit differently than something like this predicted moving average, but will warn you of short-term strength over that 48 or really two-candle period.
And lastly, every week we go ahead and we look at these predicted high and predicted low values, and so this again are these levels that are really advantageous for traders to have before the market opens, and this is where all this data is provided. 6:00 PM the night before, you’re getting that 9:30 open the next day. And so what we can do is take a look at all of these predicted high and low values as the SPY ETF starts to trade forward, and you see how it picks out these levels at the higher end. You see the futures actually probably traded a little higher overnight, but then that weakness sets in, and again, you see as the market accelerates to the downside, especially more recently as we’ve seen this weakness in the market, how excellent, even as volatility comes into the market, these levels are saying, Look, this is where the market’s likely to trade. You would only want to short, take profits on shorts.
And where this is really helpful is understanding that, hey, once the SPY ETF has already hit its predicted high, well, that’s likely where you’re going to see generalized weakness out of individual stocks. And so we can go ahead and take a look at some of these additional opportunities, and again, some of these shifts coming through in different areas throughout the marketplace. So, when we look at the home builders, we’ve seen a lot of weakness as far as fresh crossovers, right? Tech was showing some problems going back really in July.
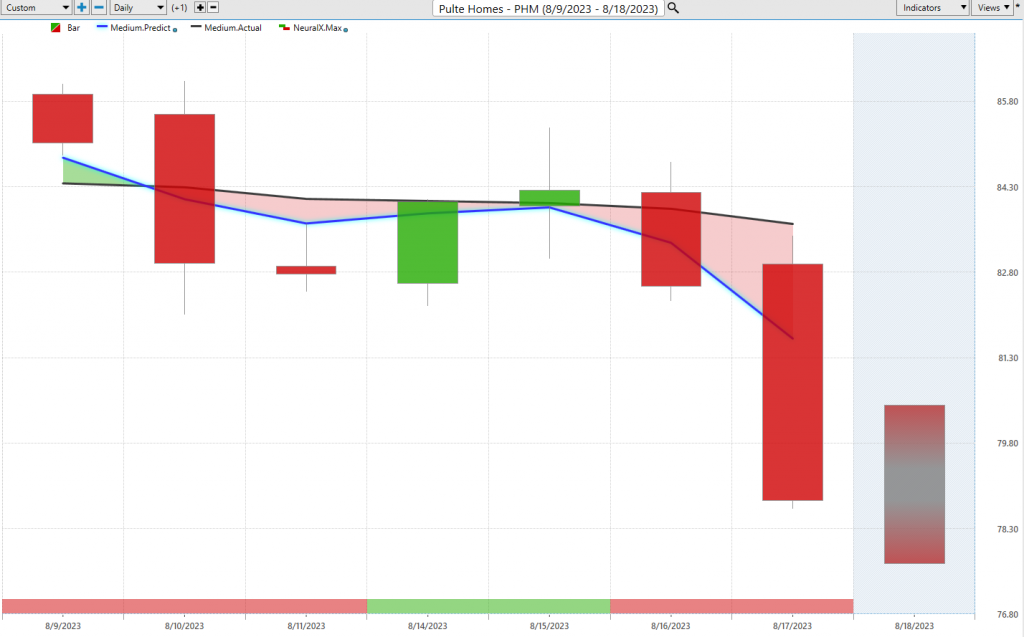
Here we see with Pulte Homes, you see a much more recent crossover with that blue line crossing below the black line. Now, the Neural Index, that 48-hour forecast is going to let you know, hey, there’s some higher highs over the next couple of trading days. You may want to be warned of that. Make sure your stops aren’t sitting really close to the price action, and then use those predicted highs and lows to fine-tune a entry or even take some profit along the way here.
And so we see as the market trades forward, you have these levels constantly provided that say, Hey, look towards the upper end of the range here to go ahead and set these short positions as we recognize that the markets are shifting here. So, if you want to go ahead and if you’re only on the long side, well you can certainly realize that look, you need to take your profit, there’s very likely to be some weaker prices over the next few trading days at the very least, but we’ve seen just a lot of the market turn and a lot of this weakness persist. So, here we see again in the home builders off 6.5% over the last four trading days, and there’s many areas where you can see really this weakness playing out.
Beacon Roofing Supply ($BECN),
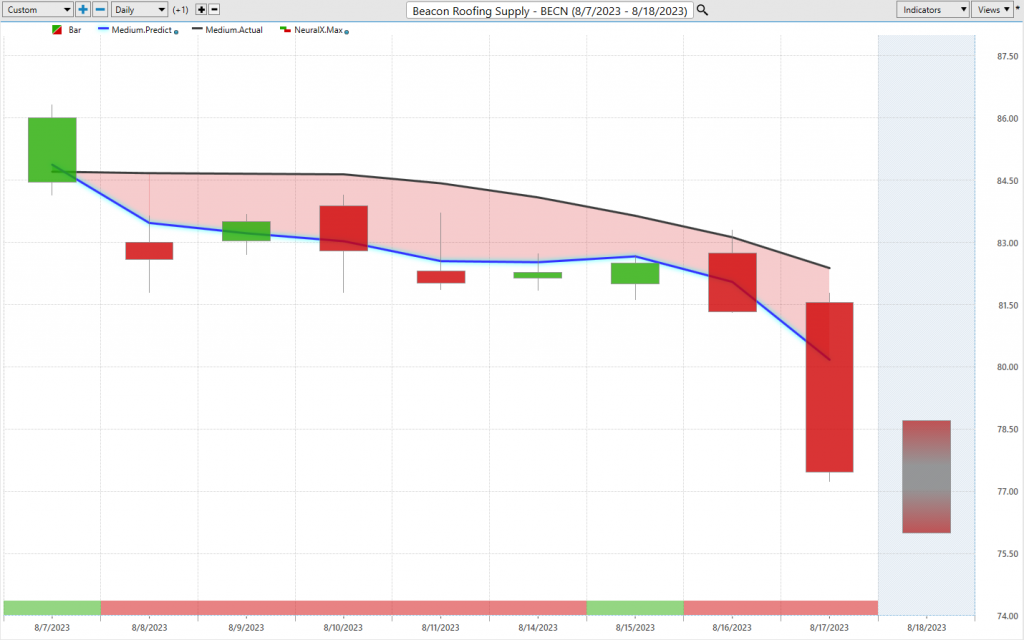
Here’s in Beacon Roofing Supply. Again, we see this pretty strong crossover with that blue line crossing below the black line, but what’s really exciting here are these predicted high and low levels. So, as the market starts to trade sideways, and again those traders are really jockeying for position, getting the best price possible, we see about five entries at the really extremes of the upper side of the range, and then that broad-based weakness really starts to set in and we see shares falling. Again, some of this driven by news, but news added inside of a generally weak environment and seeing a lot of these shifts, again, being predicted fairly early, and a lot of this short-term weakness also predicted that, Hey, you don’t want to be long in these areas. You see about a 7% decline in just the past seven trading days.
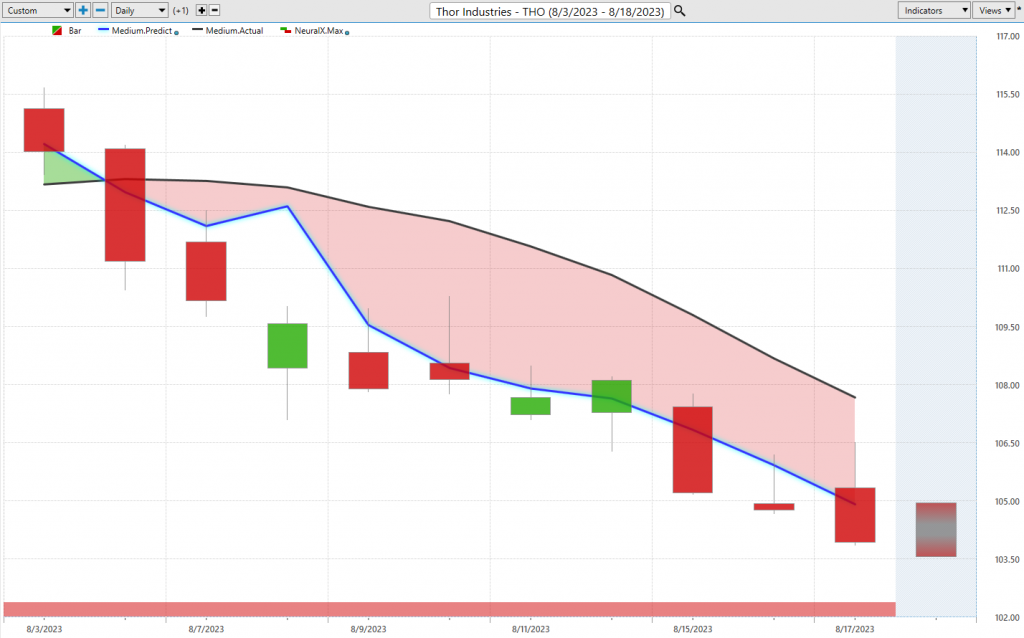
A good example here of Thor, I think they make motor coaches and things like this, but here crossover to the downside you see how weak the Neural Index remains over the course of this move, highlighting that there’s likely really not even some short-term strength in this market. And again, you see these predicted highs and lows acting as excellent guides to say, look, you want to short at the upper side of this range, you only want to really be on the bearish side. Really not even some blips of strength here coming out of that Neural Index. So, again, we can look at the overall duration of the move here, but a lot of this stuff, maybe not over yet. We see the Neural Index very weak. A lot of these trends still positioned to the downside. Here you see a 7.5% move just over the last nine trading days.
So, regardless of if you’re on the long side, if you do short stocks, this has been pretty clear that we’re seeing a lot of weakness, that weakness opening up not just in the tech space but in different sectors throughout the market, and it doesn’t seem to be quite over yet here.
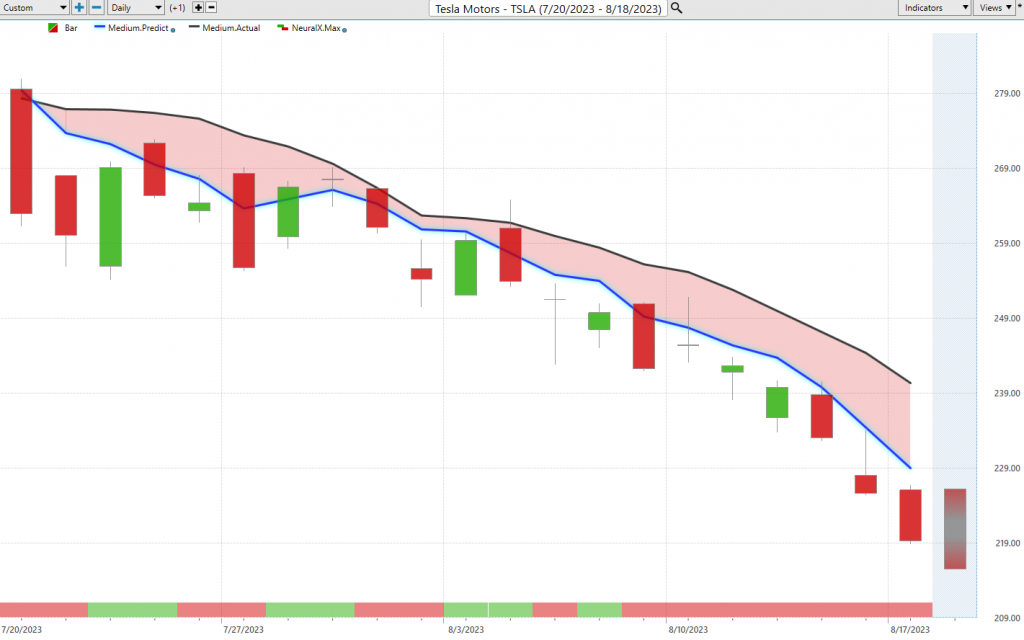
So, here’s shares of Tesla. This we actually brought through in late July here. So, as these crossovers came through warning that, Okay, well be careful out there, it’s not like this straight writeup that we’d seen in so many individual markets. And so you see, as you get that sideways price action, that Neural Index will pop to that bullish side and things run fairly sideways. But as the weakness sets in, you get that very clear forecast that, expect those prices to be lower over the next 48 hours. And of course, we can take a look at the accuracy of these predicted high and low ranges.
So, we had these excellent predicted highs hit early really before that momentum picked up to the downside. But additionally, as the market runs sideways, you’re getting really nice levels to short, take profits on shorts. You see on the lower end here, you get some bounces, but you want to really remain short, right? Those bounces are not bouncing all that high before we’re seeing more weakness come into the market. So, again, we can see that this is going all the way back to again that last week in July, and we haven’t seen again the blue line cross above the black line, right? At some point, a lot of these tech stocks will start to see those shifts and strength come back into the marketplace, but you don’t want to be on the wrong side of a 19% decline over essentially 18 trading days, right? It’s almost more than 1% a day clicking lower as shares of Tesla and the NASDAQ and the S&P start to move lower as well.
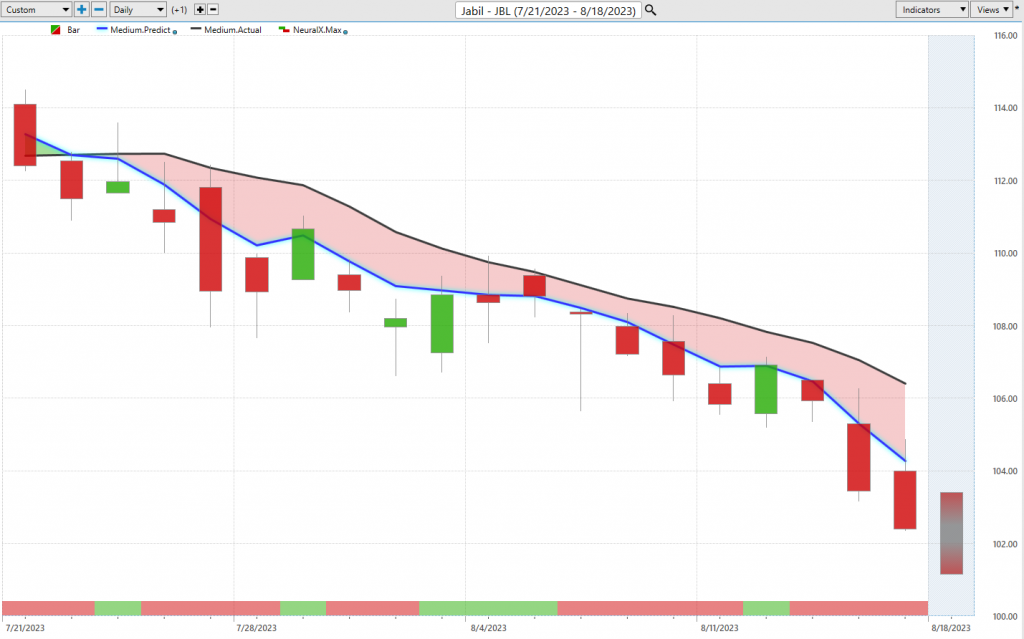
Here’s shares of Jabil, this being pretty linked to things like Apple stock, but again, seeing some of this weakness in the tech space going all the way back to the beginning of July. And so this being a stock we brought in over the past couple of weeks here, and again, we can say, okay, well, where have these predicted highs and lows been highlighting that, Okay, where do you want to short? Take profits on shorts. Readjust that position. Here you see again, just in the past few weeks, about four entries as the market precipitously really starts to move lower here, and all of these predictive indicators, again, being very weak when you need that information, when you need to understand that there’s a lot more weakness in the market, you don’t want to get on the wrong side of these things and really be caught offside of a lot of these really aggressive declines. So, here you see share’s off about 8%, almost 9% in the past 18 trading days in shares of Jabil.
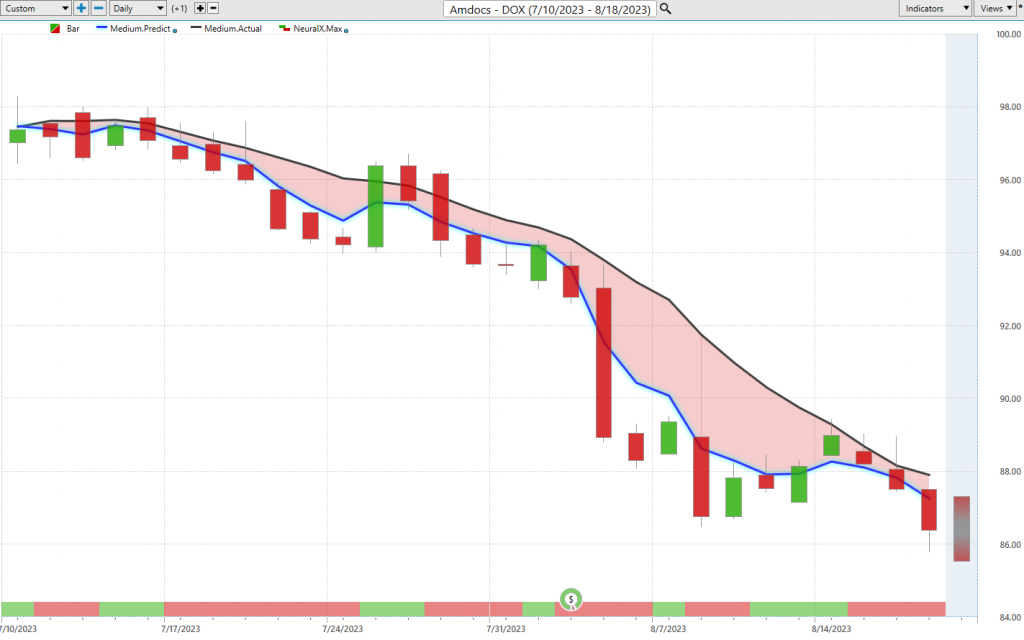
And lastly here, shares of Amdocs. This was another one of these opportunities early on, seeing a lot of this weakness come in and definitely highlighting some of the warning areas to stay short, maybe take profits on some of those shorts or balance out the portfolio if you still have things on the bullish side. But even more recently, you see that we got this bounce at the beginning of the week, but still very much seeing that blue line below the black line, and so on these moves up towards these predicted highs, still wanting to be a short, take profits on shorts. You see as the SPY and the NASDAQ starts to move up towards those predicted highs, well, these individual stocks have very similar price action, and that’s where you can expect in the very short term that weakness to kick into the marketplace. So, shares of Amdocs now off quite a bit, and again, not an area where you want to have position in the portfolio, as you see again the share’s off about 11%, almost 12% in just 27 trading days here.
So, we’ll go ahead and leave it there. Really nice opportunities on the bearish side, and kind of talked about this a lot over the past few weeks, that there’s been great opportunities in oil and energies, but when the broader market starts to turn, even those areas will start to run sideways or even move lower. And a lot of that has to do with the value of the Dollar Index. The dollar starts moving higher, it drags risk assets lower, and that’s where these neural network indicators are doing their work behind the scenes measuring those things. So, all of that really factors into your daily trading and daily analysis.
So, once again, this has been our Hot Stocks Outlook for August 18th, 2023. Thank you all for watching. Best of luck out there, and bye for now.


