


Register for a Free Live Training
The Hot Stocks Outlook uses VantagePoint’s market forecasts that are up to 87.4% accurate, demonstrating how traders can improve their timing and direction. In this week’s video, VantagePoint Software reviews forecasts for Apple ($AAPL), Activision($ATVI), Splunk($SPLK), Salesforce.com ($CRM), Waste Management ($WM), Hess ($HES) and Schlumberger ($SLB)
Hello again, traders and welcome back to the Hot Stocks Outlook for August 26th, 2022. Hope y’all are having a excellent week out there in the financial markets. And as always, plenty to cover here in today’s Outlook. And if you haven’t already, make sure you sign up for a live demonstration. Click on the link in the description below and learn more specifics of how this technology is going to help you make better trading decisions day in and day out.
Now, we’re going to start out with shares of Apple, which Apple’s really been the star of the broader markets here. And we really brought this through all the way back in mid-June. So I encourage you to go back and watch all those videos going back several, several weeks here. But this is very important to understand how we can recognize these shifts in the marketplace.
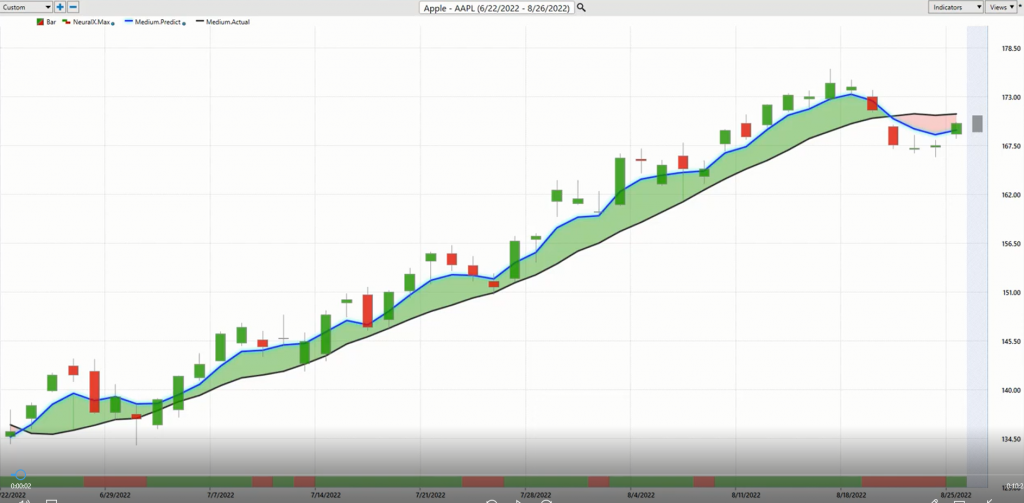
Now here in shares of Apple, what we have is daily price action, and all the charts work the same. So every time we’re going to have these bars and each one of those bars is representing a full and complete trading date. But right up against that daily price action, what you’re going to notice is there is a black line there and also a blue line. So the black line that you’re seeing on the chart, that is a simple moving average. It’s a very common technical indicator. And in this case, what it does is it just looks back over the previous 10 closes. It’ll add those all together and divide by 10. And so that level, that black line, acts as a very good measure of where market prices have been. And that’s why we use it as a baseline to really let us know, okay, well, where has this market been. But we need to actually compare that to this value that’s generated via this technology of artificial neural networks.
And for this number to get calculated and plotted against the chart, this is where the technology of artificial neural networks are performing that intermarket analysis. And so rather than just looking back at past prices and sort of plotting the closes along and getting dragged around, what the technology is doing is understanding how other markets are driving and influencing the target market. So in this case, Apple.
Now that’s going to be things like the NASDAQ and the S&P. But what a lot of traders don’t really account for, and this week has been a very good example of how things like the Dollar Index or crude oil prices or interest rates or other commodity markets can ripple through the stocks and markets that you are trading.
But it gets more subtle. It gets down to individual stocks, whether they be other tech stocks in the space. But what they can do is offer extremely valuable insights into future price direction of that target market that you’re trading. So this is very important because Apple is really the star. It gets on your radar as far as one of the strongest things coming through over this time period. And we can see that over the past couple weeks, the markets have been weak. And so the forecasts are going to pick up on that. You see the neural index getting bearish, some weakness coming through. And these short-term forecasts perking up here on the neural index side. And so what I just want to do is highlight that, well, how can you understand that there’s likely to be some weakness and there’s a very good opportunity to take some profits and look for these lower levels and then let the forecast guide your trading decisions again.
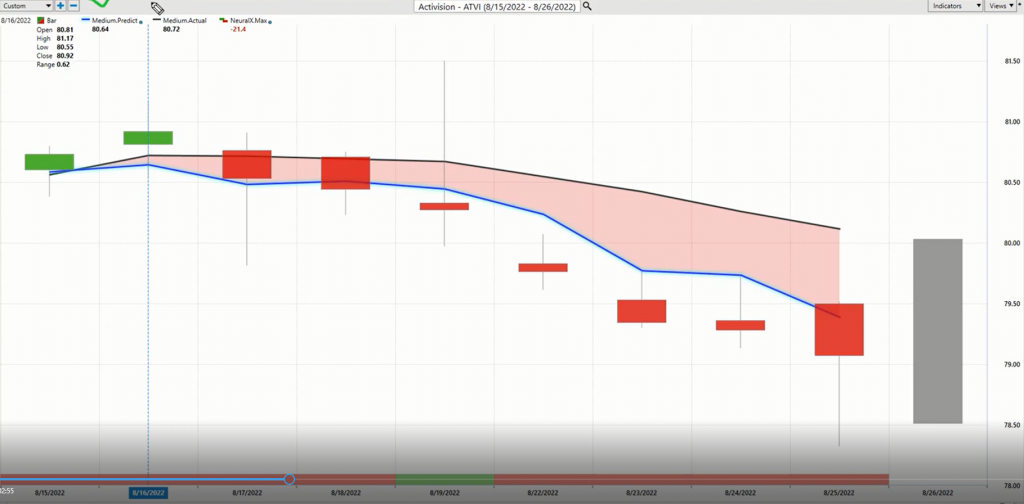
Well, let’s look at what these scans were yielding a couple weeks ago. Well, here’s the tech space. We’ve got Activision, Splunk, and Salesforce. And so when you’re setting up your process and setting up scans to actually identify when these big shifts are happening in the markets that you’re trading, well, you’re going to be getting these signals all the way back on August 16th. You have Activision, blue line crossing below the black line, neural index bearish. And this is really helpful with the neural index. So aside from that predicted moving average, which is going to let you know the overall trend direction, the neural index is a very short-term forecaster. And it’s accurate with levels up to 80 plus percent accuracy over a large range of markets. So I think of this as you get this right four out of five times, and it’s letting you know short-term strength or weakness over the next 48 hour period. Or you can think of it as about two candles.
So when you understand, look, over the next 48 hours, what should I be looking at? Looking for strength or weakness, strength or weakness, strength or weakness, strength or weakness. Now here you have one day where the neural index goes bullish, but the trend is very much still on the bear side. That blue line still below the black line. And then again, you see that expression of all that weakness coming into the market as those forecasts accommodate there. But this is so important to recognize that shares of Activision here have slipped, take a look at the overall percentage, but just about 2%. But let’s go ahead and look at these other markets. And why I’m bringing this through is to highlight that there’s been very important shifts in the marketplace. And we saw that dollar rally, and it just pushed down a lot of stocks.
Now that doesn’t mean that you have to get out of stocks completely. What it means is there may potentially be some other areas in the market that are going to clue in and let you know that there’s some opportunity opening up. But this is how the trader needs to utilize these tools to recognize these important shifts in the market where they happen all the way back in June so you can get a good opportunity to get long Apple. But recognizing that over the past couple weeks, you want to look for lower prices throughout the tech space. So let’s just continue on here.
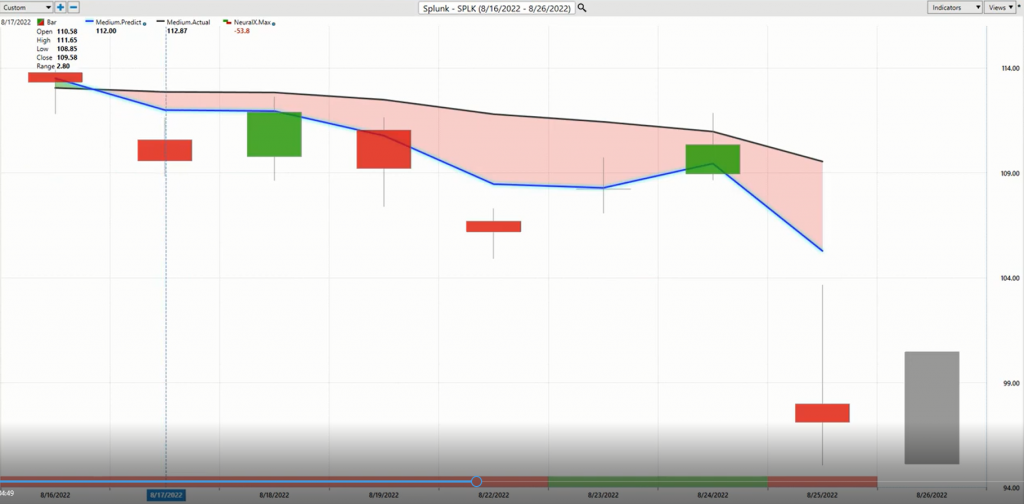
Here are shares of Splunk. So if we’re running that in Telescan feature, which will bring in these blue line crossovers, whether they’re the upside, downside, however you want to set things up, well, there’s that blue line crossing the downside. Neural index, so your short-term forecast, bearish. You see that it pops up bullish here and you get some higher highs over the next 48-hour period there. But the bigger move is to the downside. And there’s a lot of dangers throughout the tech space here, as we see two weeks ago, the forecast moving to the downside. And then a lot of information and news coming in and now shares off about 12%.
But again, I really encourage you go back and watch the beginning of June or the mid period of June, how are we feeling about markets moving higher. And then go back and watch last week and this week. And it’s so important to make those trading adjustments so that regardless of what happens throughout the broader markets, you’re making money on the right side of things.
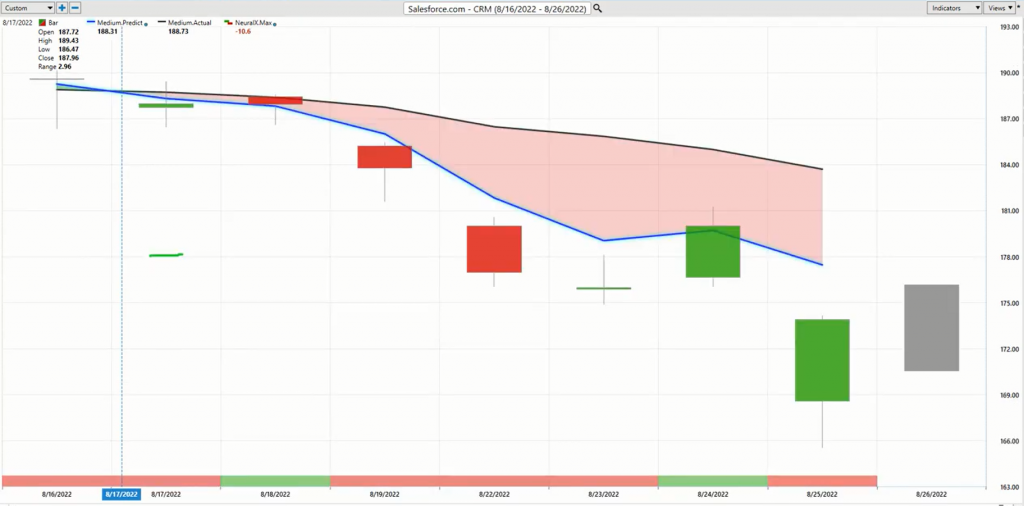
Here’s shares of Salesforce. Blue line crossing below the black line. Neural index bearish here. And again, just the weakness of these forecasts, as far as the distance between that blue line moving below the black line. And it became very apparent that you need to hedge your long positions in the tech space or potentially look to short the market. There’s a lot of ways that the individual trader may approach it. But then you can come in with these shorter term tools within VantagePoint as far as predicted high and low levels. So here’s the chart for Salesforce. And what I’ve done is we’re kind of sort of moving down the line. You’ve got your predicted moving average creating the crossovers. You’ve got your neural index at the bottom for a 48-hour forecast. But we’re actually provided a predicted high and a predicted low for each and every trading day.
So we could see in this example volatility’s really heated up, but certainly you want to be shorting up at these levels and looking to exploit the bearish side of things. And so it’s these updated forecasts that every single day before the trading day even occurs is going to give you some very important levels to help you make better trading decisions, whether they be entries, profit targets, adding back into the market, whatever it is for you and your trading style.
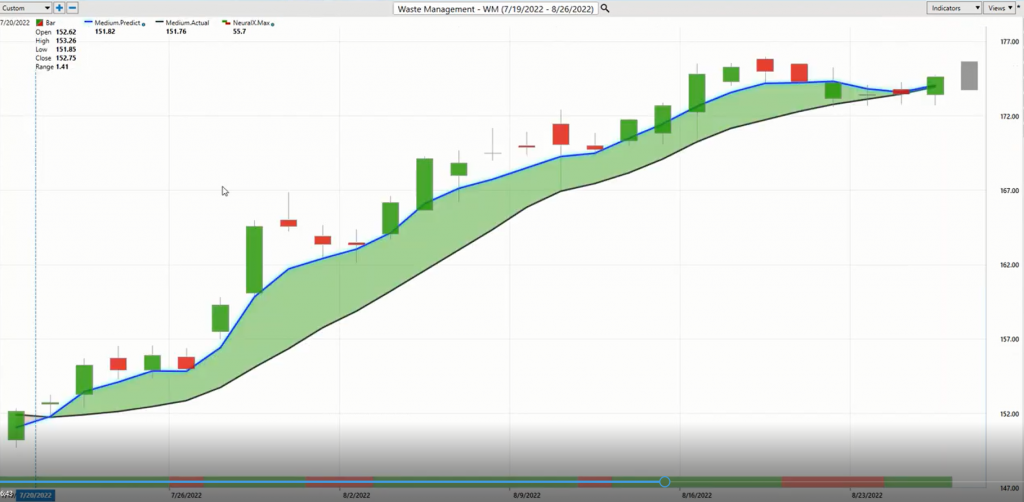
Now this is a little bit more straightforward. Here’s waste management. And you see you have that blue line crossing above the black line all the way back here on 720. And you’ve seen just as far as that blue line and the distance between the black line, it’s telling you average prices are expected to remain higher than that lagging moving average, that black line on the chart. And then you bring in that other piece of the neural index to help you with very short-term forecasting. Let you know when some potential sideways periods are going to come into the marketplace and you can be prepared for that. But as long as that blue line remains above the black line, and you can see in this case that waste management has been fairly bullish here, and you haven’t actually gotten that crossover to the downside. And so as we enter into a period of a lot of uncertainty, well, you want to be in those things that are working.
And so we see neural index and Apple has moved higher there. Waste management here, at least you have that crossover to the upside and again, the neural index bullish. But clearly some of these areas are not where you want to be and you should make those accommodations. Now this last week, though, if we’re saying, okay, well, tech’s week, we already knew that last week that you may want to take some profits here and look for lower levels, well, where might be an area where some strength is coming in?
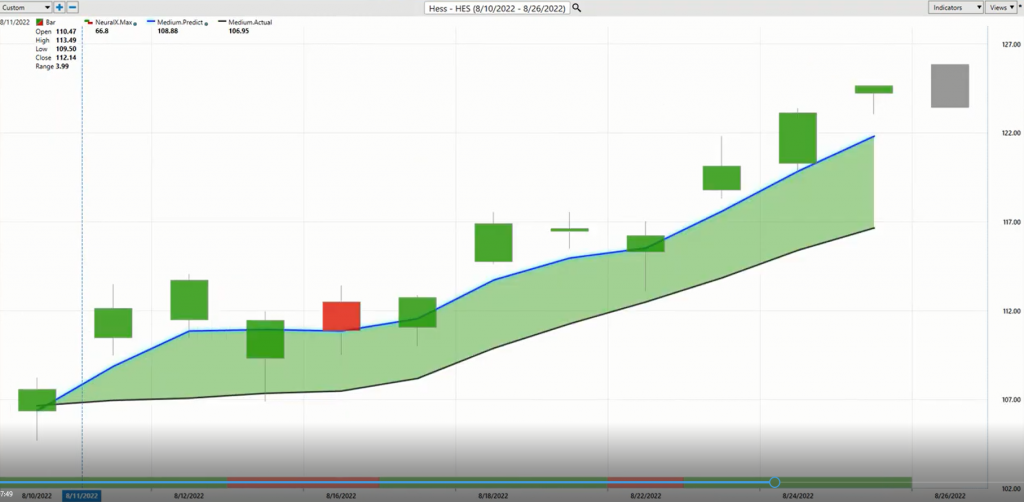
Now here’s Hess and Schlumberger. And here again, this crossover blue line over black line, very, very bullish here. Notice the neural index as we run a little bit sideways. But a huge amount of separation between those predicted values for the overall trend.
And of course, your predicted highs and lows coming in to let you know that, okay, well, if you’re looking to take a position within the energy space, well, we had a little bit of volatility earlier on, but this week here doesn’t get much better than that. Look for this dip, buy here. And we’ve seen oil do very well. And it’s all going to come down to a lot of this news. The news often is going to drive these things. But if you can get a position ahead of time and recognize these very important shifts, well, you see shares of Hess here and many of the energy spaces and we’ve seen crude will make about a $6 move in a week, well, 15, 16% rally in just the past 12 trading days. And maybe more importantly, just the past three trading days. Recognizing these predictive levels that have come through, recognizing the markets where that strength is happening. And almost a 10% rally here just in the past four trading days.
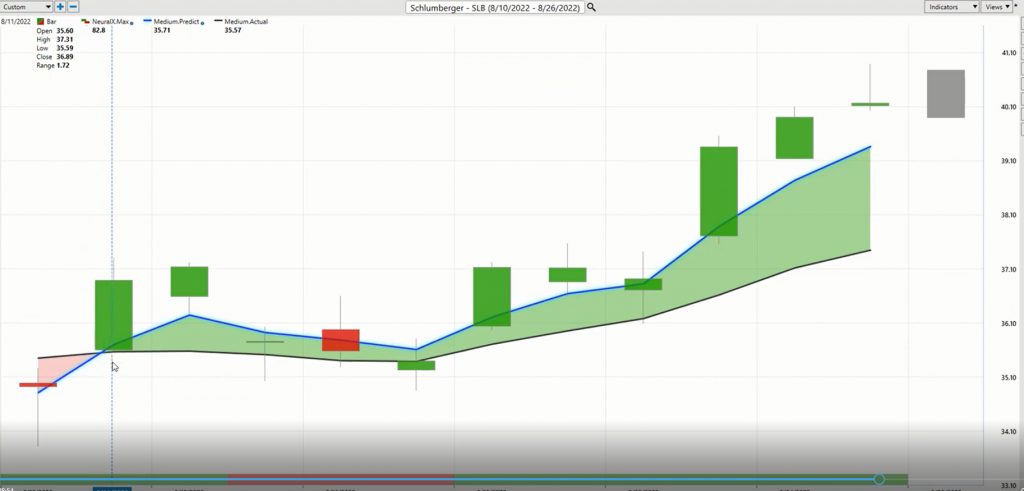
Here, shares of Schlumberger. And same thing, connecting all of these pieces. Predicted moving average, neural index and your predicted highs and lows. Well, here’s Schlumberger. So while the tech space is all moving to the downside and you’re seeing these crossovers and weakness come in, you’re actually seeing the energy space starts to perk up and crossovers move to the upside, and you can see how we can manage this. If you want to get long, neural index goes bearish here, we get a little bit of sideways action, but a lot of strength coming into this week and highlighting that, hey, if you want to be doing anything here, we’ve got crude oil prices, energy stocks. Well, these are the levels that you really want to be looking towards if you’re looking to take that position and you see already that’s where the trade is. That’s where the real benefit is this week throughout the markets. Stocks have sort of run sideways, not done much. Commodities have sort of been pressured by dollar. Well, here’s crude oil and energy stocks moving up about 10% in the last four trading days.
So it’s all about setting up the tools that really match your trading style. And then you’ve got this forecasting device that consistently is updating those forecasts, benefiting off of those intermarket relationships, off of that valuable information that can be really extracted via this technology. And then you can incorporate those data points into your trading and your analysis, and so that you can identify not only these intraday levels of value, but the longer term areas of focus where real opportunity is potentially going to open up here. So we’ll go ahead and leave it there for today. Once again, this has been the Hot Stocks Outlook for August 26th, 2022. Thank you all for watching. Best of luck and bye for now.


