


Welcome to the Artificial Intelligence Outlook for Forex trading.
VIDEO TRANSCRIPT
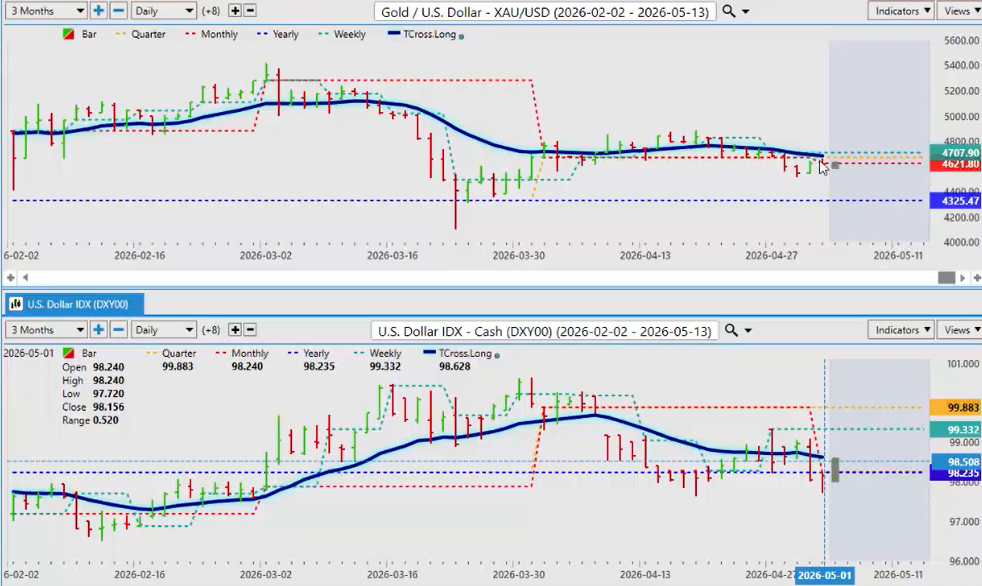
US DOLLAR
Okay, hello everyone and welcome back. My name is Greg Ferman, and this is the Vantage Point AI market outlook for the week of May the 4th, 2026. Now, to get started this week, we’re going to do things a little bit differently here. We’re going to strip down VantagePoint to its core tools here. Now, in most cases, you’ll hear different analysis. Well, something went up because of it was a candlestick pattern or a Fibonacci or there was an announcement. But when we look at this, the dollar is the main driver of our core market. So when we look at this very closely using the VantagePoint Tcross long with the yearly opening, the monthly, the quarterly opening, we get a a very clear picture as to what is going on here. So right now the dollar is slipped below the tcross long and the calendar yearly opening price. But this is strictly based around what the Fed was talking about on Wednesday. 80 to 90% of the time the US dollar is strong the week of the non-farm payroll number which is next week. So very often this is what they will do. They will try and run stops create the illusion of something only to see the exact opposite happen on Tuesday or Wednesday.
BITCOIN
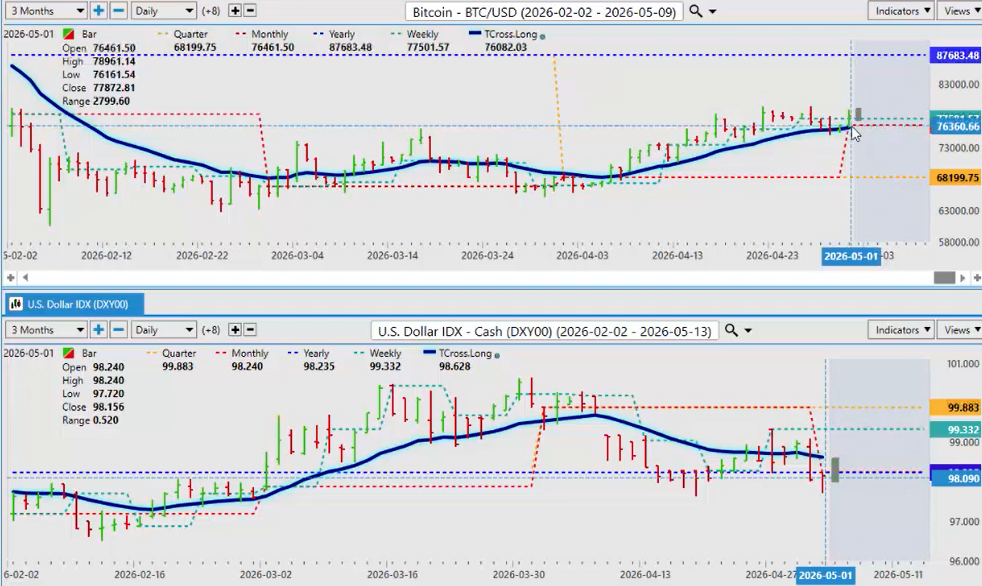
So we can see when the dollar started pulling lower after the Fed, gold started to rise. When we do a comparative analysis to Bitcoin, Bitcoin also was in significant trouble here going into that announcement. But coming out of it, we can assess that Bitcoin is now above its tross long 76,082 as the dollar slips.
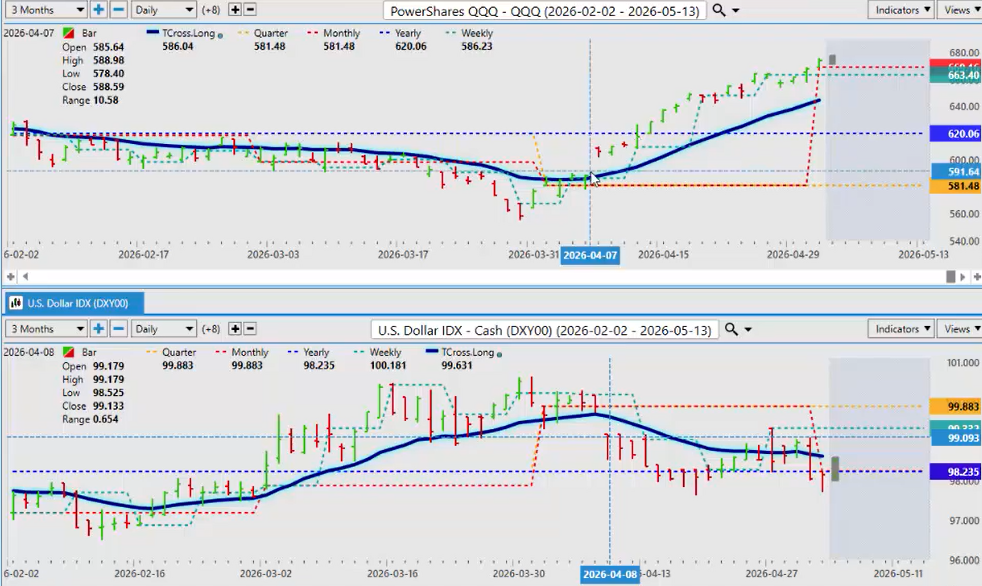
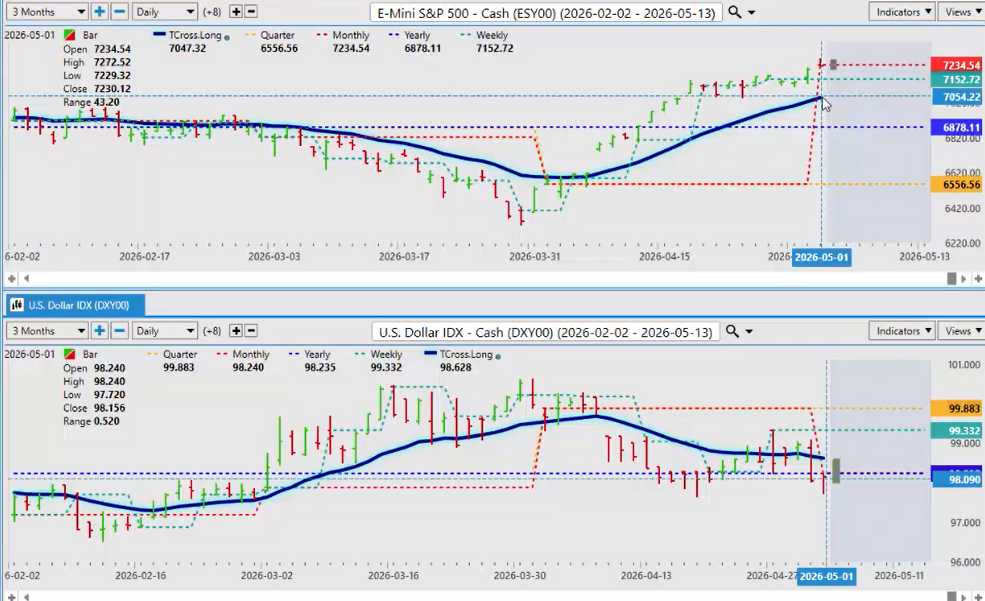
S&P 500 Cash versus U.S. Dollar
When we look at one of the main equities here, we can look at the S&P 500 on the cash side. The S&P 500, as you can see, as soon as the S&P 500 breaks higher, the dollar was actually the driver of pushing those equity markets higher, the Q’s, S&P 500, the Russell, the the entire lot of them.

If we look at the Q’s, we can see the exact same thing on virtually the exact same day. We closed above the VantagePoint tcross long on April the 7th and soon as that occurred it immediately broke higher as the dollar broke down. But the driver of this is highly questionable whether it had anything to do with the stock market. It was more related to that dollar weakness.
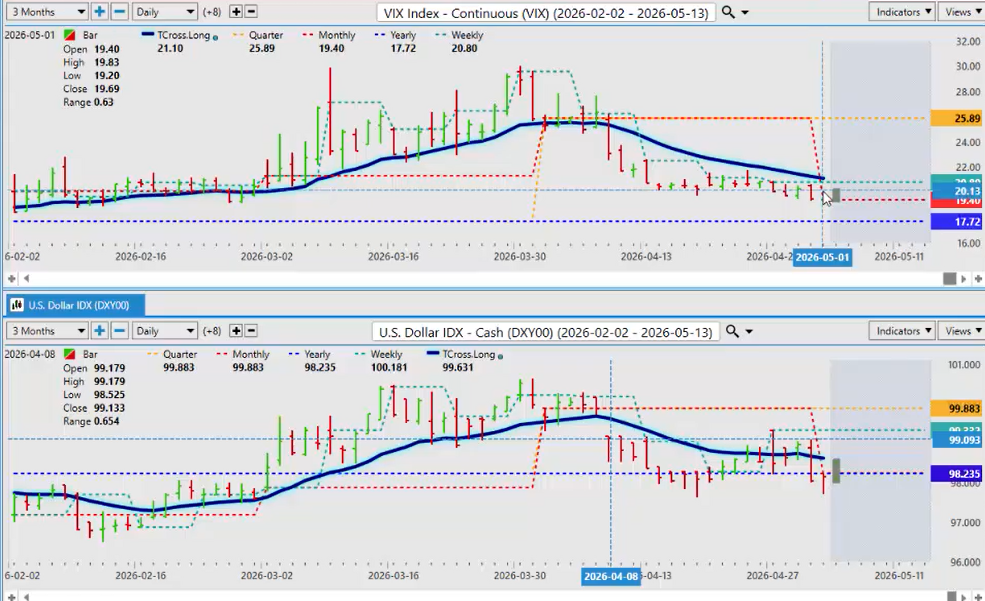
VIX
So again, when we look at the VIX, the VIX has basically a 99.99% positive correlation to the dollar index. And again, using those core VP levels, the TCross long, without causing a great deal of confusion on the screen, we can see that basically these charts are exactly the same. And that’s what we want to make sure we’re understanding.
USDU (Wisdom Tree Bloomberg U.S. Dollar Bullish Fund)
Now, if I go a little bit further with this and I look at the wisdom tree USDU, you can see the variation here between the actual dollar index on the cash side where the USDU came down to the yearly opening price, hit that to the number and then turned around and that actually happened on Friday also. You can see we came right down hit the yearly opening price while the dollar index and the futures and the cash side may be giving us a misleading price. So what I suspect may happen here is that you will see that dollar weakness continue for Monday only. Then midday Monday or early Tuesday the dollar violently reverses and most participants will not see it coming. But using inner market technical analysis, we can take a very different perspective of this. And again, looking at these ETFs versus the futures in the cash, there is definitely something to this guys. And as you can see, the last time that this occurred on the 17th, the dollar index was falling here, but in actual fact, the USDU was saying, “Well, wait a minute. I think the market is going to turn around.” Then several days later the the dollar index cash and futures they turned around and started going back up but the leading indicator was that USDU combining it with the T cross long and of course that calendar yearly opening price. So now we have a a structure of understanding that if that dollar goes up, gold will go down, uh bitcoin will go down, spy’s in the qqq’s will go down, all of these things will be affected and the VIX will actually turn up.
Dax
So again, changing our screens over to now. Now we start bringing in the VP predictive indicators once we have an understanding of what’s really driving these markets.
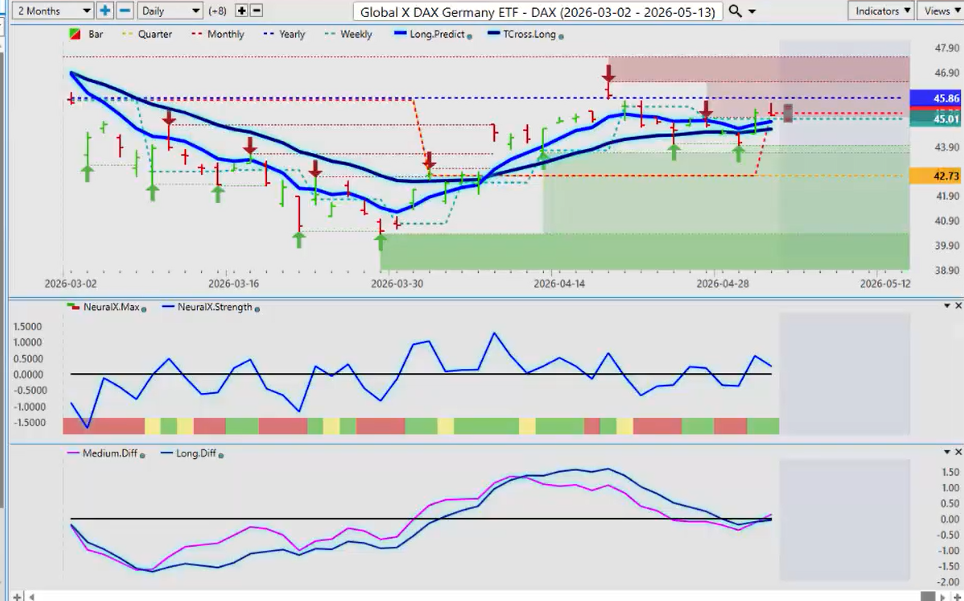
So again when I look at the global X from my good friends in Germany we can see that the DAX is actually holding in there but again can we move higher is the main question. Now we’ve got an MA diff cross that’s coming in right now. Uh we’ve bounced off of this, but the yearly opening price on the DAX 45.86. Watch this area very very closely, guys, because again, what you’re going to need, in my respectful opinion only, is I need to see some euro buying. And I’m not convinced that we’re going to see that next week.
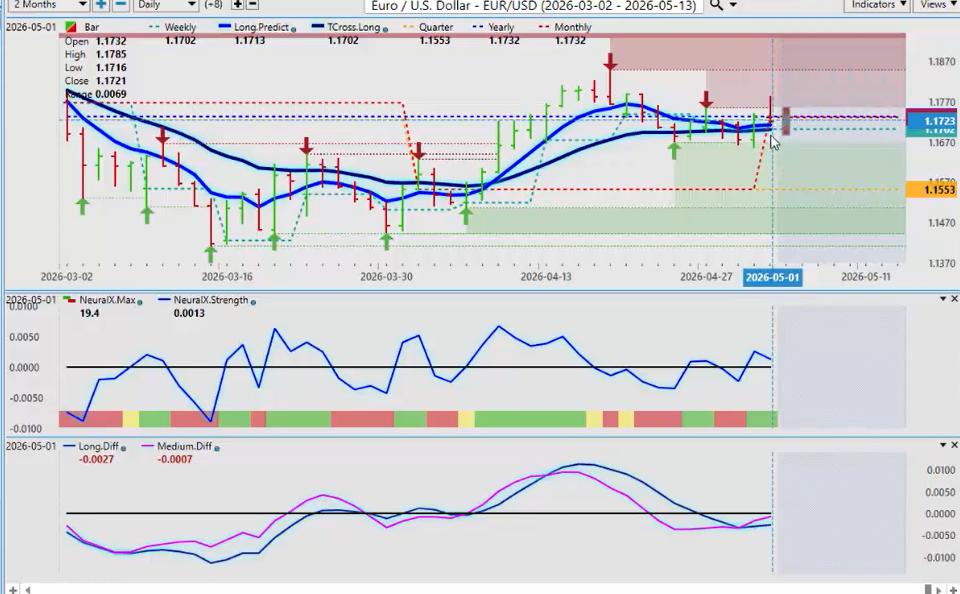
There’s been a very high correlation between the DAX 30 and the or the DAX 40, excuse me, or the DAX in general and the Euro US pair. So, we want to check that correlation to say to see if there’s something to that. And as you can see, these two charts between the DAX and the Euro US is virtually the same uh virtually the same. And we also have an MA diff corrective move here on the MA diff cross. So in my respectful opinion there isn’t one trade here guys there’s actually two. If the DAX moves higher then the probability is the Euro US is going to follow it higher.
US SWISS FRANC / BRITISH POUND US DOLLAR
So for next week because again this is an outlook guys not a recap of things that have already happened in the previous week. We’re looking at next week. I’m giving everybody that warning of dollar potential dollar strength despite what the Fed has tried to twist around on Wednesday. So again, watch our TCROSS long that’s coming in at 11702, but we must break through that yearly opening price at 11732. If this is going to go higher,
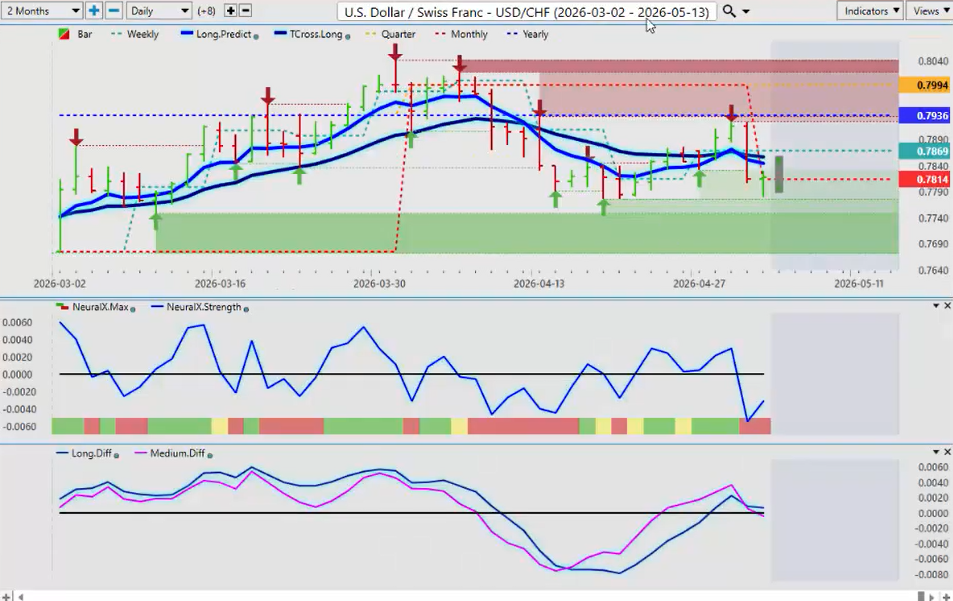
I would also keep a very close eye on the US Swiss Franc. Now, we saw some pretty good buying on this until the Fed then the Fed has pushed it lower with this big down bar on Thursday. But is this just a trick to get us going the wrong way? What I can tell you again, uh, even if I went on the low percentage side, 70% of the time the dollar moves higher in the first in the week of the non-farm payroll number until the Tuesday after said payroll number. So again, watch for a fake move on this Monday only uh to reverse on Tuesday back to the upside. The ADP report will help guide us along the way.
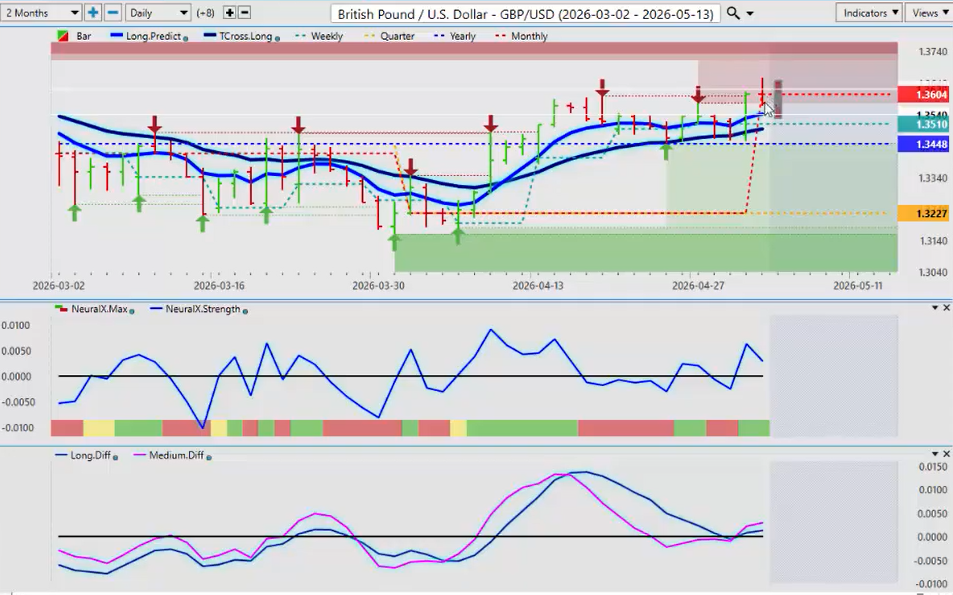
The British pound, US dollar also seeing something very similar, but the pound is doing far better than the euro. We also have an MA diff cross here. Your major supports for next week, guys. Just count them down. Uh because again, this is not based around a moving average crossover, but rather a hard pivot line. The long predicted 13542 tcross long 134.95. The yearly coming in at 13448. As long as we’re holding above 13448, there is still a long trade here, but it will be shaky until we get that US payroll number. So again, if we get another weak payroll number, that basically is going to take any chance of the Fed staying on hold or cutting or hiking, excuse me, off the table, and that would bring rate cuts back into the fold.
USDJPY
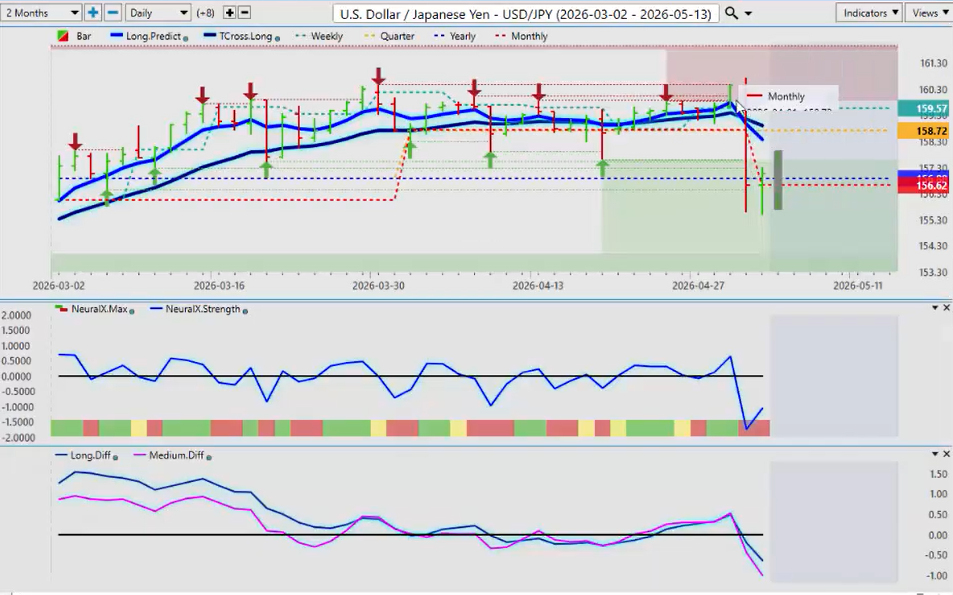
So, we’ll see how this one plays out uh for dollar yen traders next week. Again, the carry trade is in a little bit of trouble here. As you can see that big down bar on Thursday as the market was shocked somewhat by by Powell pretty much expected here but the level for next week the yearly opening price that level 156.88 . If we can hold above that, I believe the dollar yen will retrace next week back to the vantage point like a moth to a flame back to the tross long at 158.90.
US Dollar versus Canadian Dollar ($USD/$CAD)
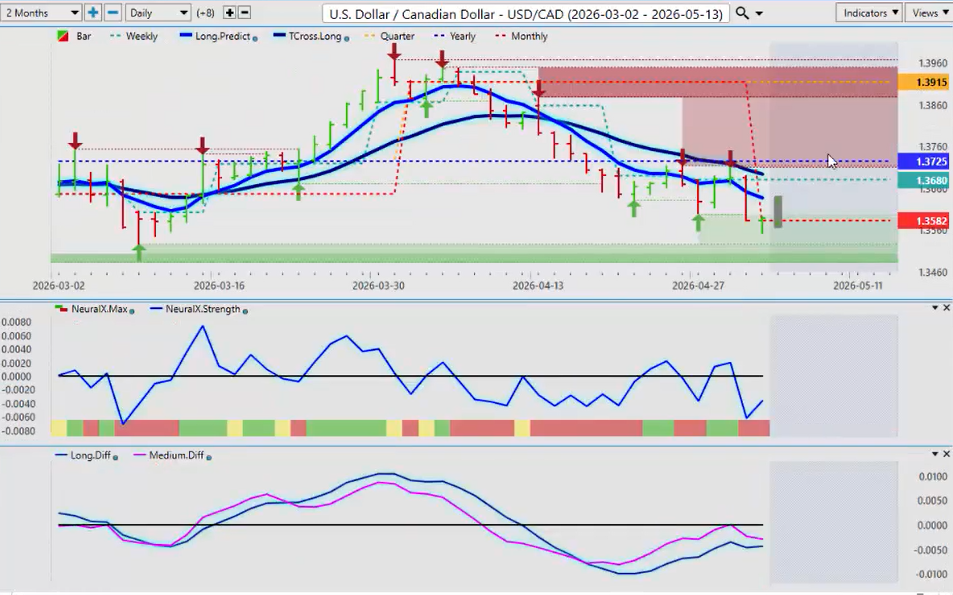
Now when I look at the US Canadian pair uh a very difficult trade on Friday even for me uh buying the Canadian dollar and I’m doiciled in Canada to clarify but again with uh things economically that are going on on in Canada the North American Free Trade Agreement up for renewal uh it really doesn’t look that great for Canada but uh again an excellent way to look at this using the vantage point T cross long as an entry point or a pivot area or even a straddle point. What I mean by straddle point is that as long as we’re below the T cross long and the yearly opening price, I still have a short trade here. But I can also I have buy limit orders sitting above 13725 ready to go long because ultimately I believe this pair will break higher. Uh, and I don’t believe there will be a North American uh much of a I don’t believe that any real deal is going to come out of this unless it’s what is what Trump wants and right now he’s signaling he doesn’t want to deal with Canada. Doesn’t need our oil. Doesn’t need any of these things. So again, that makes it very difficult to uh short this pair or buy the Canadian dollar under these circumstances. But again, I very often see this leading into the week of the non-farm payroll number and then a violent reversal for no apparent reason. So for now, guys, 13725 and the VPT cross long at 13706.
If you’re going to short, that is the level. If you’re going to buy respectfully, I think I would stick with a straddle uh situation and keep your buy stops above the yearly opening price or above the 13729 area.
AUDUSD / NZDUSD (AUSSIE / KIWI)
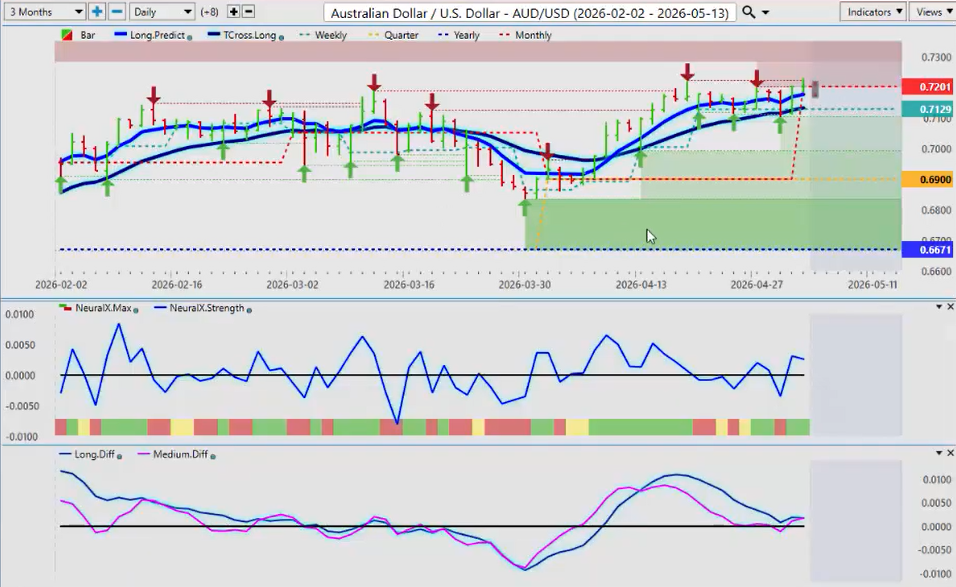
Now, the Kiwi going into next week and the Aussie, both of these are still holding in there. We’ve had multiple tests of the Tcross long providing a rock solid entry point for longs. But again, can we get above and stay positive on the month? That level is 7201 and I think that is unlikely unless we can get these stocks advancing. And again, in most cases, I’ll keep repeating this, stocks don’t do that well in the week of the non-farm payroll number. It’s a period of known dollar buying. Uh but for now again uh the Aussie has been a very very good long trade this cal the entire calendar year staying on the long side is very reasonable the structural bias of this market with limited indicators the tcross long the quarterly opening at 69 and the yearly opening price at 6671 there again a pullback would be perfectly normal this coming week but use that to reset your longs if you haven’t or if you’re not already long or haven’t enjoyed longs in 2026.
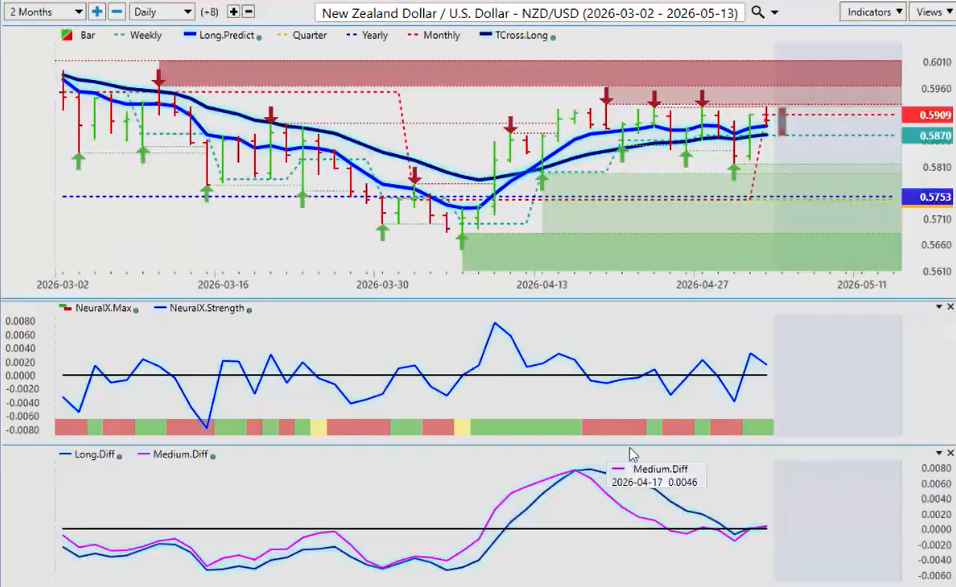
The Kiwi is likely to follow the same path. As you can see, we’re above the the quarterly and yearly opening. So, the primary trend in most cases, again, in my respectful opinion, most people don’t know how to identify what the primary trend is. And if we’re positive on the year and we’ve been positive the bulk of the year, the trend is clearly up why we’re positive on the year. Meaning that if I bought this pair on January 1st and I’m still on this pair, then as of Friday with all the volatility, this pair still remains up 2.53%. Or 146 pips from the calendar yearly opening. So it’s difficult to say it’s bearish when again uh it remains net positive on the calendar year. So next week there will be no shortage of volatility but if you know your levels you can use that volatility to your advantage. So with that said, this is the VantagePoint AI market outlook for the week of May the 4th,


