


Register for a Free Live Training
The Hot Stocks Outlook uses VantagePoint’s market forecasts that are up to 87.4% accurate, demonstrating how traders can improve their timing and direction. In this week’s video, VantagePoint Software reviews forecasts for Reliance Steel ($RS), John Deere ($DE), Iac/Interactive ($IAC), Robinhood Markets ($HOOD), SNAP ($SNAP)
VantagePoint A.I. Hot Stocks Outlook for February 13, 2026
Hello again, traders, and welcome back to the Hot Stocks Outlook for February 13, 2026. I hope you all are having an excellent week out there in the financial markets. And as always, we’re here to highlight the most recent Vantage Point predictive forecast. So, if you haven’t already, be sure to go ahead and click the link down in the description below. You can get signed up for a live demonstration and learn all the specifics about how these predictive indicators and AI technologies are helping traders navigate the markets and make much better trading decisions.
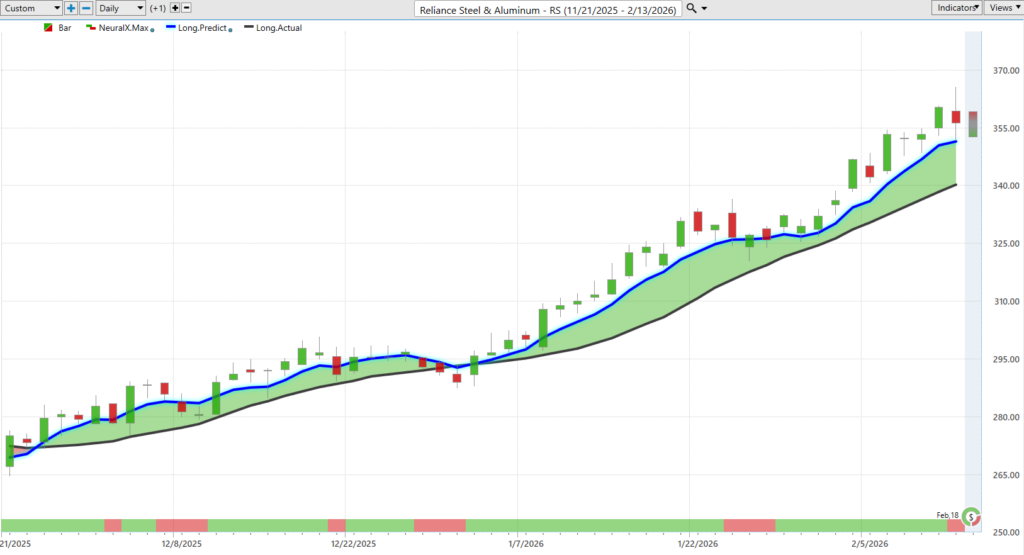
And so what we’ll do is start out with shares of Reliance Steel and Reliance Steel and Aluminum ($RS), aluminum. And this has been an area of the market that we’ve been focusing on for quite a bit, looking at steel, aluminum stocks like Alcoa, Reliance Steel here. And it’s a really great example of how all of these predictive indicators work together.
And so what we’re looking at, as with all of our VantagePoint charts, is end-of-day data, where each one of the candles on the chart is going to represent a full and complete trading day. And so what you’re first going to notice is that right up against all of those individual candles is that there is a black line and also a blue line value.
And so what the black line that you’re seeing on the chart is, is actually a simple moving average. So this is a very common technical analysis indicator. In this instance, it’s a 10-period. So that just means it looks at the previous 10 close prices, adds them all together, and then divides by 10.
And traditional technical analysis like this really has a lot of drawbacks. And the major ones, when comparing that to the technology within Vantage Point, is that all the data comes from the past, right? It’s really just reconfiguring what’s already occurred in the market and has no predictive capability. And additionally, it’s only looking at one market in isolation. So it has no way to account for how other markets drive and influence the future price of Reliant Steel, which, when you have a stock like this that’s linked to a particular commodity or asset, well, certainly those other markets provide some very valuable clues as to what’s going on and where prices are headed next.
And so what Vantage Point traders are able to do is compare that black line value, which in this case is going to act as a baseline, and we’ll compare that to this blue line value. And for this number to get generated and plotted on the chart every evening, well, this is where that technology of artificial neural networks comes into play, and they’re performing what we would call intermarket analysis.
And so what that means is that, rather than just looking at the past prices of a single market, running some simple math, and plotting that forward, Vantage Point’s technology of artificial neural networks, and really artificial intelligence, is taking into account how all of these other markets, and this can be things like individual stocks, this can be ETF groups. So when we’re talking about the data that’s used to generate these predictions, well, those data sets are relevant markets to the target market in question.
And so this really goes global, like I said, to individual stocks, ETF groups. This can be global currencies or global interest rates, and then even potentially global commodities where applicable. So it’s really looking at the global breadth of all the markets, how these things can affect the individual markets and trades that you’re navigating or participating in. And then it uses that information and all of that data to generate highly accurate predictive tools.
And so the predictive tool of the Vantage Point predicted moving average. Well, whenever we see that blue line cross above the black line, well, it’s suggesting that these average prices are going to start going higher, and traders can look to take a long position. And so whether you’re a swing trader or a day trader, you understand, look, directionally we want to look to trade this market on the bullish side.
Now, that helps traders with the overall direction and really understand where things are headed next. But that’s only one of the tools here. And we have really an assortment of tools to really round out the forecast here. So if you look at the very bottom of the chart, you’ll see this bar that’s going from green to red, back to green. Well, this gets updated every evening as well, actually at 6 p.m., the night before the next trading day. And this is a highly accurate indicator that’s predicting short-term strength or weakness over the next 48 hours.
So really, it’s just only looking ahead two days at a time and forecasting short-term strength or weakness within the overall trend. And so what we notice here is, when we have that trend on the bullish side and the neural index bullish, you see there’s a lot of momentum in the market. We get a really strong push as prices go higher. You see in the first, you know, let’s see, about 15 days of the trade here, the market just marches up day after day about 11%.
But notice, as the neural index goes bearish here and you end up getting a consolidation in the market, right? You end up seeing the market run sideways for a couple of trading days. Neural index stays bearish again. You’re still running sideways 48 hours from that prediction. But as the neural index flips bullish, it’s telling you, well, next 48 hours expect this market to move higher. Expect that momentum to kick back in. And we see shares go higher, and it’s taking us where we are to present day here, going into the end of the week after this 20% rally.
Now, we can take that same approach and apply it to all the markets. So if you’re trading ETFs or stocks, you really know how to utilize all of these predictive indicators once you understand one of the charts here.
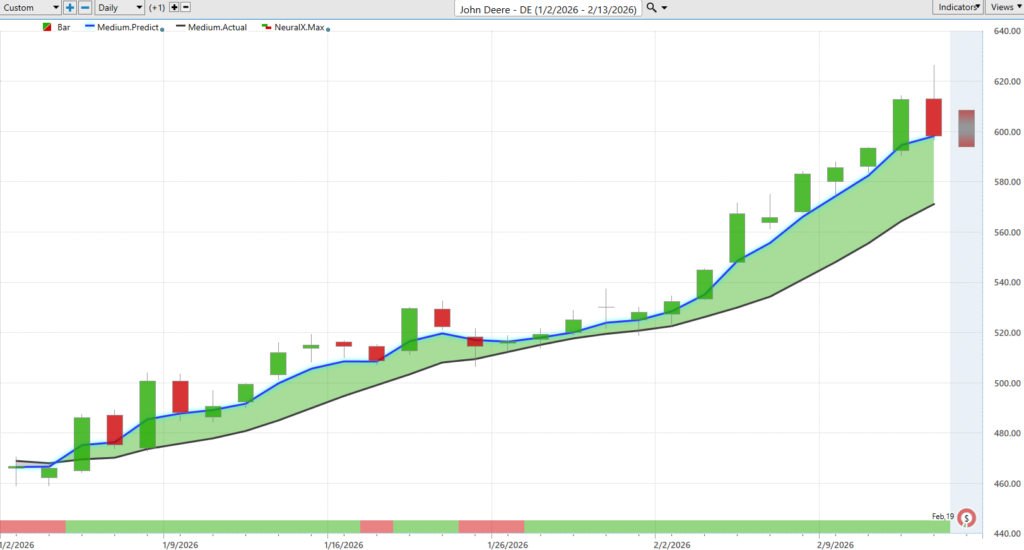
Now, here’s John Deere Interactive and same thing. We have this blue line crossing above the black line. Neural index very bullish going into that move. We get a really strong push as shares move higher. Now, we’ll notice again that, as the market neural index goes bearish here, you get a little bit of sideways price action over those subsequent 48-hour periods.
But what’s beautiful about this is Vantage Point traders are also provided an intraday predicted high and predicted low. So as we get the overall trend direction, short-term strength or weakness, you’re also provided an estimation of what the daily high and the daily low is likely to be for that next trading day.
And again, we see how this works as that crossover moves to the bullish side. You have all this information that says, “Hey, look to buy down at these Vantage Point predicted lows if you want to accumulate a position or potentially take a day trade participating in this market.” And you see here about 3, 4, 5, 6, 7, 8, 9, 10 entries where, within 48 hours, you have the market moving higher and continuing on with that uptrend. So really nice opportunity here in shares of John Deere. Again, overall about a 27% rally over 27 trading days. Not a bad move there.
Now, you know we’ve talked about actually last week the consumer staples, right? Proctor and Gamble, Coca-Cola, a lot of these defensive stocks doing quite well. And a lot of these other software stocks, media companies, in this case not doing well at all. And you really want to be aware of that, right? What sectors are doing and performing well, and what sectors you really need to get away from or potentially short and hedge the portfolio.
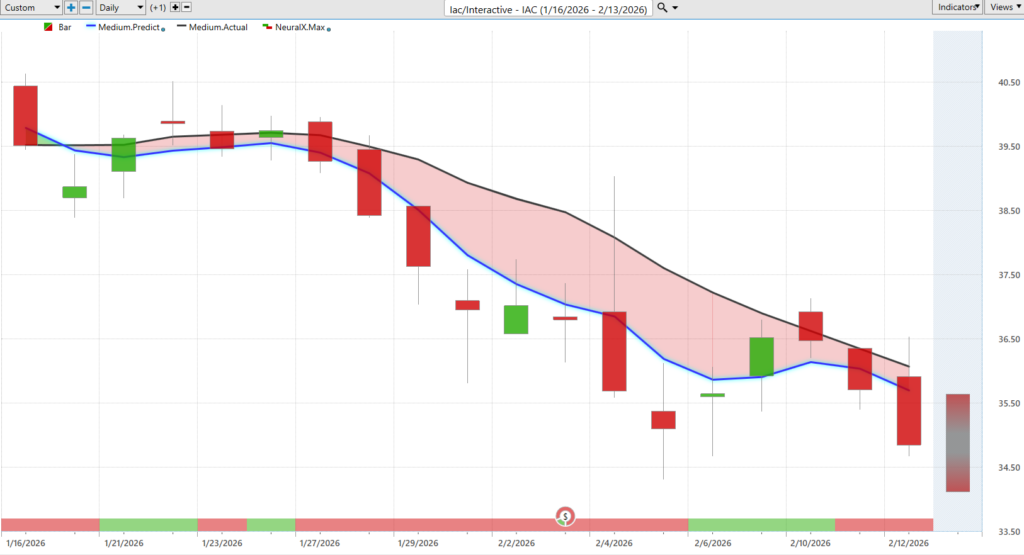
So here we have IAC Interactive very clearly here taking the same approach. It says, look, blue line in this case has crossed below the black line. And this is pretty interesting here, where you see the neural index goes bullish but the trend is down. And notice the price action here, right? We don’t just immediately start, in this case, declining very quickly after that crossover comes through. It says, hey, expect prices to be higher over these 48-hour periods. You get some sideways price action before the bottom really drops out here. We see the neural index goes bearish, and all that momentum really kicks into the downside. A lot of noise here around earnings going into the next trading day.
But very clearly here, look at the separation between that predicted moving average and the actual moving average. It’s clearly a market where you’d only want to go short, take profits on shorts, and really be ahead of the move here. Shares off about 12% just in the past 17 trading days.
Again, you see just this past week telling you, hey, look for a bounce here actually going into the beginning of the week, but you want to go ahead and actually short, take profits on short positions. And of course we can look at those Vantage Point predicted highs and lows.
And so this is where things get pretty exciting, where you have this adaptive technology. So what the software is really great at is understanding, hey, the market’s closed here. Let’s analyze those intermarket relationships that are affecting the future price of IA. And now let’s forecast out what’s likely to occur the next day. So again, before this trading day occurs, it’s telling you, hey, expect the daily range to actually move higher here. You likely want to go ahead and actually still be short as the trend is bearish.
And you see you get a little bit of noise here, but you’re actually closing right at that predicted high before we start seeing the downtrend kick off and things go lower here with earnings. Look at this. Even with the earnings report, you have a predicted low the day before earnings. Next day, it’s telling you, hey, expect prices to move up towards these predicted highs, and that’s exactly where price goes before the market drops out and the bottom drops out and shares go lower.
And even here yesterday, not a bad opportunity for a day trade, where we move up to the predicted high, go lower. It’s about a 3% move by the end of the day, about four and a half or so.
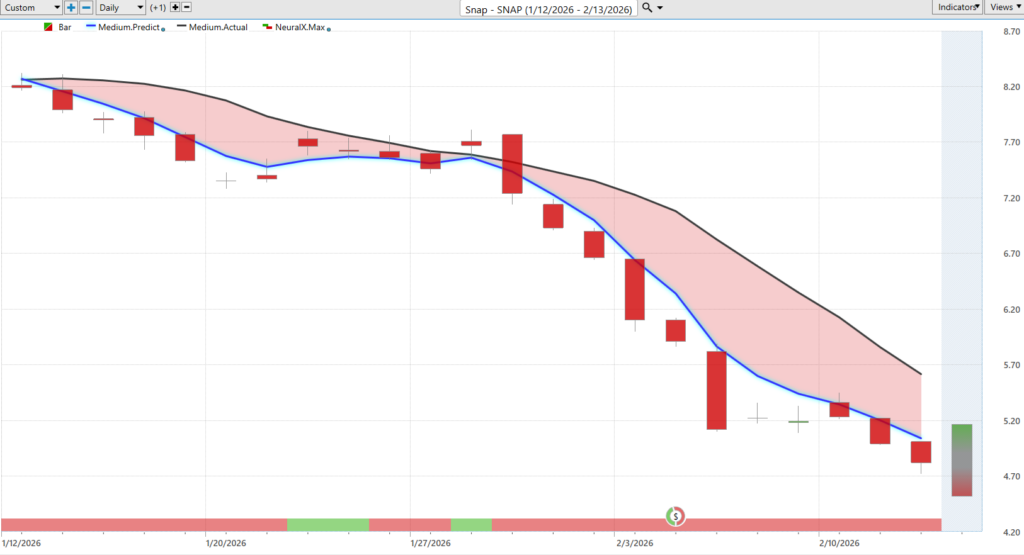
Here’s shares of Snap. So this is a Snap ($SNAP) market that we looked at last week. And again, just speaks to the weakness in technology and, in this case, software stocks. Here’s Snap with a blue line crossing below the black line. Much like those bullish markets we looked at earlier, sort of in the middle of the trend, hey, expect things to level out here, right? You don’t want to be in a mode where you’re expecting the market to go lower and it just keeps kind of grinding a little bit higher day after day. Don’t want to sort of become impatient there.
But the overall trend very much bearish. So the predicted highs and lows give you a good opportunity to short up near these predicted highs and really take advantage before that momentum really kicks in to the downside in this case. And just the last week we see, well, what’s occurred here? Well, it said, look, this is still a very weak market. The past four trading days going into Monday, stay short, take profits on shorts, and potentially try to short if you move up to these predicted highs to get a nice intraday level and short position. So again, overall now down about 40% just in the past 22 trading days. So clearly not a place where you want to be positioned in the market.
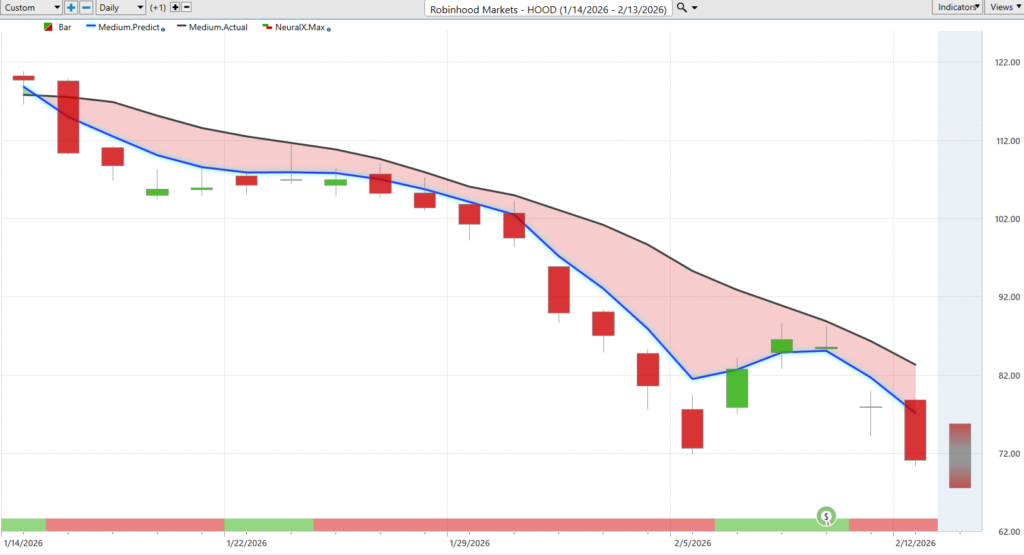
And lastly, Robin Hood. So this has been Robinhood Markets ($HOOD), an extremely strong stock, really last year one of the great performers throughout the market. But here we see having some real trouble in shares of Robin Hood with the blue line crossing below the black line.
And notice these two periods where neural index goes bullish, neural index goes bullish moving into earnings here. But very clearly, once that neural index again flips bearish, that’s where we see that momentum really start to kick in. Shares go lower. And of course we can look at those Vantage Point predicted highs and lows.
And again, you see how this works here, right? Expect the market to level out, probably move again towards these predicted highs within that downtrend, and sure enough shares going lower. You see coming into earnings here, you always want to be a little bit careful of previous day’s predicted lows. So when you have all the volume is very bearish, sometimes you get that move where you just often times just go to that previous predicted high level. But of course traders have all of these levels ahead of time. So you’re really prepared to know, hey, where is this market likely to trade? How am I going to deal with volatility within the downtrend? And very clearly here, a very weak market in shares of Robin Hood.
Really exciting stuff here with Reliant Steel. Of course, I think we didn’t look at the predicted highs and lows, but it’s really all the same thing here, right? Look how close this is as far as blue line above black line. Numerous entries here where the market just scoots down to the predicted low and offers up numerous opportunities to be a buyer in a very strong sector of the marketplace.
So we’ll go ahead and leave it there for today. But once again, this has been the Hot Stocks Outlook for February 13, 2026. Thank you all for watching. Best of luck out there, and bye for now.


