


Register for a Free Live Training
The Hot Stocks Outlook uses VantagePoint’s market forecasts that are up to 87.4% accurate, demonstrating how traders can improve their timing and direction. In this week’s video, VantagePoint Software reviews forecasts for Coca-Cola ($KO), Tanger Factory Outlet Centers ($SKT), Teekay Tankers ($TNK), Zoom Video Communications($ZM), Adobe ($ADBE)
VantagePoint A.I. Hot Stocks Outlook for February 27, 2026
Hello again, traders, and welcome back to the hot stocks outlook for February 27th, 2026. Hope you all have had an excellent week out there in the financial markets. As always, we’re here to take a look at the most recent Vantage Point AI predictive forecast. So, if you haven’t already, be sure to go ahead and click the link down in the description below. Get yourself signed up for a live demonstration. You can learn all the specifics about how these predictive indicators and technologies are going to help traders make better trading decisions out in the marketplace. Uh, and so we’ll go ahead and actually revisit CocaCola here. Seen a lot of strength in consumer staples.
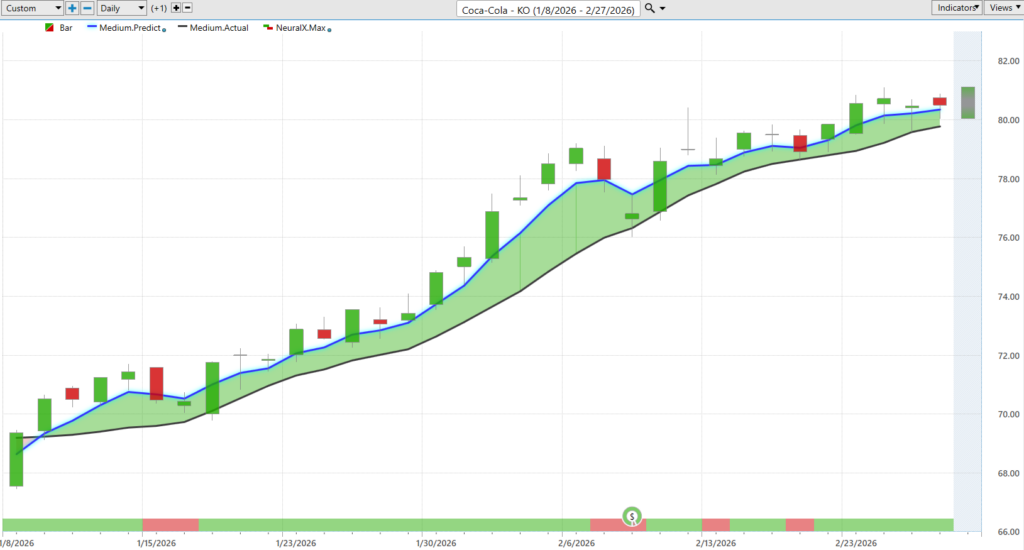
So, Proctor and Gamble, Coca-Cola has done very well. Uh, and we have a really nice example how all of these predictive indicators and tools work together. And so, what we’re looking at here is daily price action. So, this all works off of end-of-day data, where each one of these candles will represent a full and complete trading day. Uh, and so, against all that daily price action, the first thing that’ll jump out at you is that we have a black line and also a blue line value against those candles. And so, what the black line is is actually a simple moving average. So, this is a very common, uh, technical analysis indicator. In this case, it is a 10 period. So, it just looks at the previous 10 close prices, adds them all together, and then divides by that value. And that’s great to really smooth out the data and give us a rolling metric of where prices have been. But the weakness here is that all the price data to generate those values comes from the past. It’s really lagging the market. Uh, and it’s also only looking at one market in isolation. So, not able to account for how other markets may drive and affect future prices. And so, what vantage point traders are able to do is compare that black line value to the vantage point proprietary predicted moving average. Uh, and so, for this number, essentially a price that’ll get calculated and plotted on the chart every evening. Well, this is where the technology of artificial neural networks come into play, uh, and are performing what we would call intermarket analysis. And so, what that means is, rather than just looking at past prices of a single market, really just dragging that data along, uh, what Vantage Point’s technology is doing is looking at different ETF groups, uh, potentially individual stocks. Uh, it can look at global interest rates, currencies, even global commodities where applicable. Uh, we have energy stocks performing well, and that get driven by crude oil and natural gas prices. So, this really gives traders an edge as far as identifying where things are likely to move next. I can really use this suite of predictive indicators to get ahead of those market moves. So, as we’ve seen that blue line cross above the black line, really since those values have come through, we’re up about 15%, uh, in shares of Coca-Cola over the past 33 trading days. So, very large stock, slow mover, but still a very healthy move just over the past month of trading.
Now, that’s not the entirety of the forecast. Uh, what Vantage Point’s technology has been tuned to do is solve different problems for traders. And so, when we’re trying to identify the overall trend direction, well, that’s those predicted moving averages are valuable. But, if we look at the bottom of the chart, you’ll see this bar that goes from green to red. This also is going to get updated every single trading day before the open, uh, the next morning at 9:30 in the morning. And so, what this neural index is able to do is anticipate short-term strength or weakness over the next 48-hour period. So, we can really use this to anticipate, again, just short-term blips, uh, within the uptrend. You see how the neural index goes bearish here. You get some gap downs, but the overall trend, that blue line still healthfully above the black line. Neural index gets bullish. That’s where momentum starts to kick back into shares here going into earnings. Get a little bit of noise and froth around those earnings reports. But, you see things leveling off just a little bit, uh, until things get bullish and that momentum picks up. So, this really helps traders, again, just understand what’s likely to happen over the next 48 hours of trading, and we incorporate that into their overall approach. Uh, and of course, lastly, we have the vantage point predicted highs and predicted lows. And this is where we really get down to intraday prices. Uh, and what’s happening is you’ve really got these separate set of neural networks solving these different problems. You know, what is that predicted moving average value? Uh, how is this neural index configured, bullish or bearish? Uh, and are these predicted highs and lows likely to move higher or lower, uh, day-to-day? And so, this is what really acts as a road map for traders to say, okay, well, where do I want to be a buyer if I want to share trade shares of Coca-Cola? And see how you get a lot of opportunities at the lower part of this range. And again, still that blue line very much above the black line. So, you got about 5, 6, 7, 8, 9, 10, 11 entries here as the market keeps going higher after that very healthy move.
So, let’s take this same approach, same logic, and we can apply this to really any market that Vantage Point forecast for.
Tanger Factory Outlet Centers ($SKT)
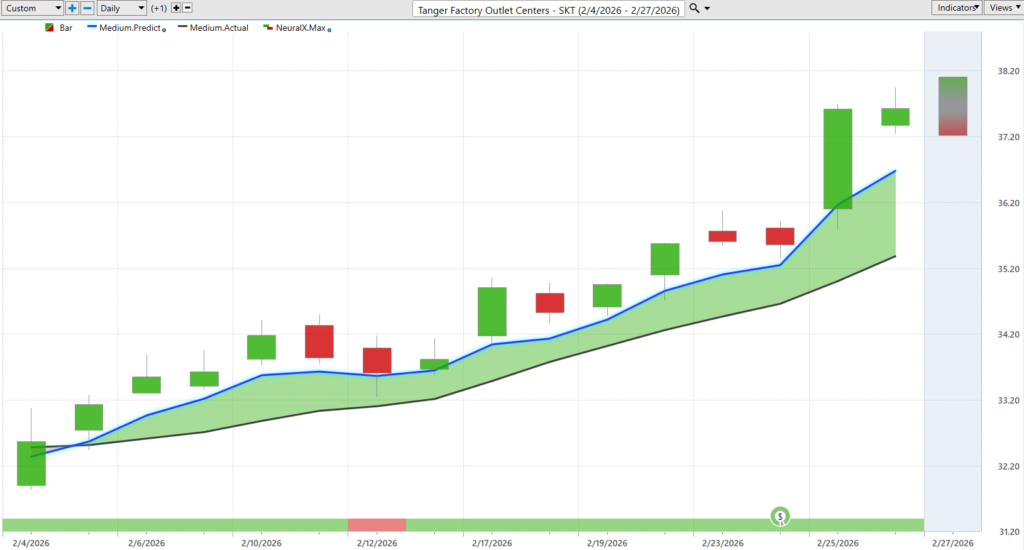
So, here we have Tanganger Factory Outlets. Again, another example of blue line over the black line. Neural index very bullish until we get here, but it very quickly becomes bullish, you know, from that bearish configuration. And we see that momentum picking up in the market going into earnings. Uh, and again, we have these values of the vantage point predicted highs and lows. So, even here, it’s telling you, okay, well, we move down to this predicted low. Expect the low to move a little bit lower tomorrow. Be prepared to go a little bit lower here tomorrow. Uh, but obviously, the overall trend very bullish. You want to keep exploiting the bullish side of the market here in Tanganger. Uh, and it’s been a highly volatile market. You want to be very careful, uh, in identifying where the best opportunities are. Again, about a 15% push in about half the time, about 15 trading days.
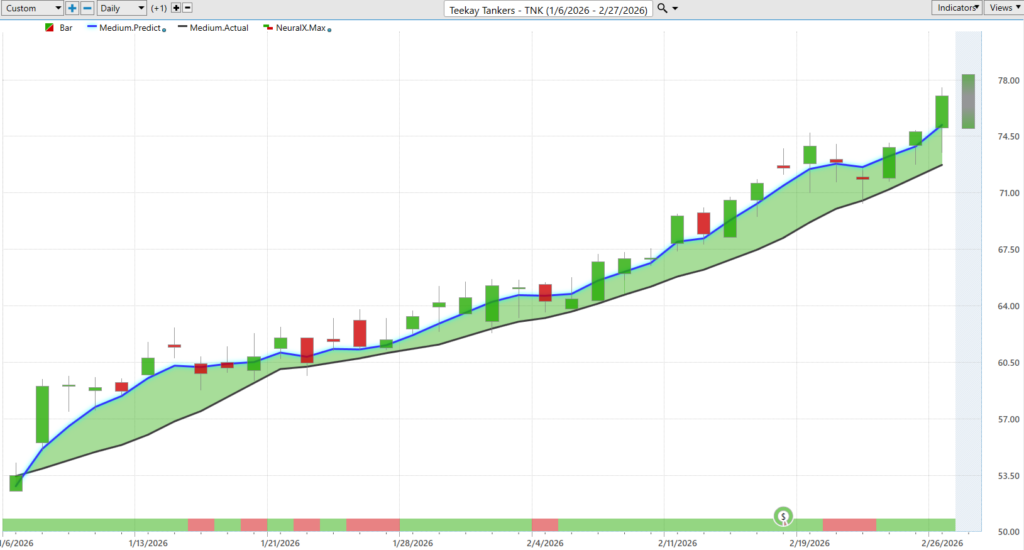
Energies have performed very well. So, actually, last week, I believe, we looked at TK here, uh, and a great example of blue line over the black line. You get these periods where the neural index goes, you know, give you that mixed signal, and you’re seeing the market grind a little bit higher, but some down days, things leveling off, but the overall trend very much bullish, right, that predicted moving average very healthy above the, uh, actual moving average. Uh, and of course, we can just look back at Vantage Point predicted highs and lows. So, even just this last week from looking at TK, here’s Monday’s, uh, uh, predicted range. We move down to the predicted low. You know, you close, you’re in profit by the end of the trading day. Uh, and then you’re seeing about a 9% move, uh, just here over the past, you know, four trading days, just this week from the last forecast here, about seven, uh, and a half percent higher there. So, very exciting move there in shares of TK and really a lot of energy stocks performing well here. So, you see about a 34% move, uh, over these past 33 trading days since this forecast got bullish.
Zoom Video Communications($ZM)
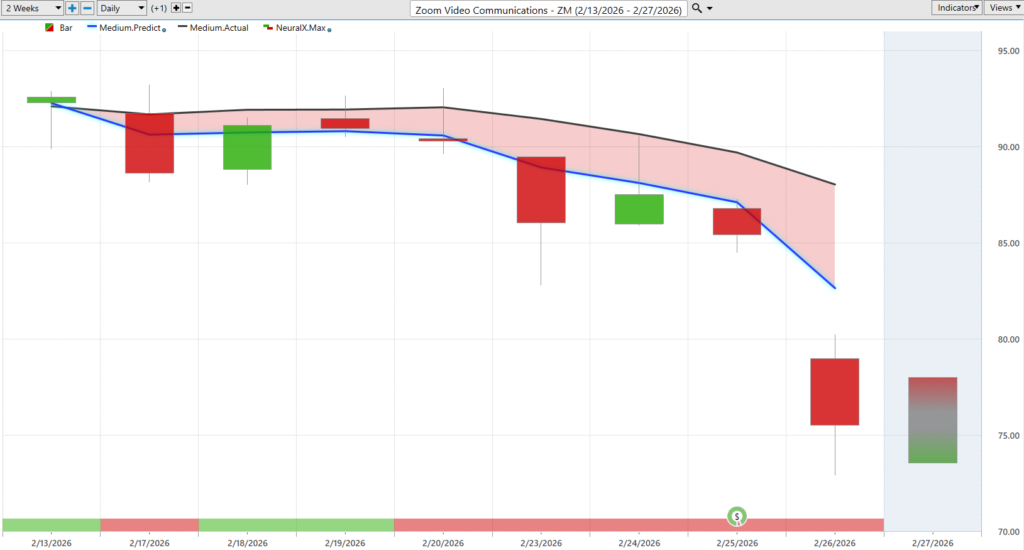
Of course, we’ve seen some volatility in the market. So, here’s some of the tech side of things. Here’s Zoom video. Uh, blue line crossing below the black line. Look at the neural index here. Just letting you know, hey, we’re likely to go sideways. Expect those higher highs over the subsequent price action. But, you’re actually getting more separation with that predicted moving average and the actual moving average. Uh, and of course, as we look at those predicted highs and lows, well, these act as excellent levels to short, take profits on short positions, uh, and we see the market really responding poorly there to earnings, but really nice opportunity to really get ahead of the earnings report potentially, uh, and capitalize on a lot of this bearish volatility we’ve been seeing across, uh, technology stocks and the, the NASDAQ. Uh, here shares down about 17% just over the past eight trading days. Uh, and of course, uh, that story about software stocks being weak.
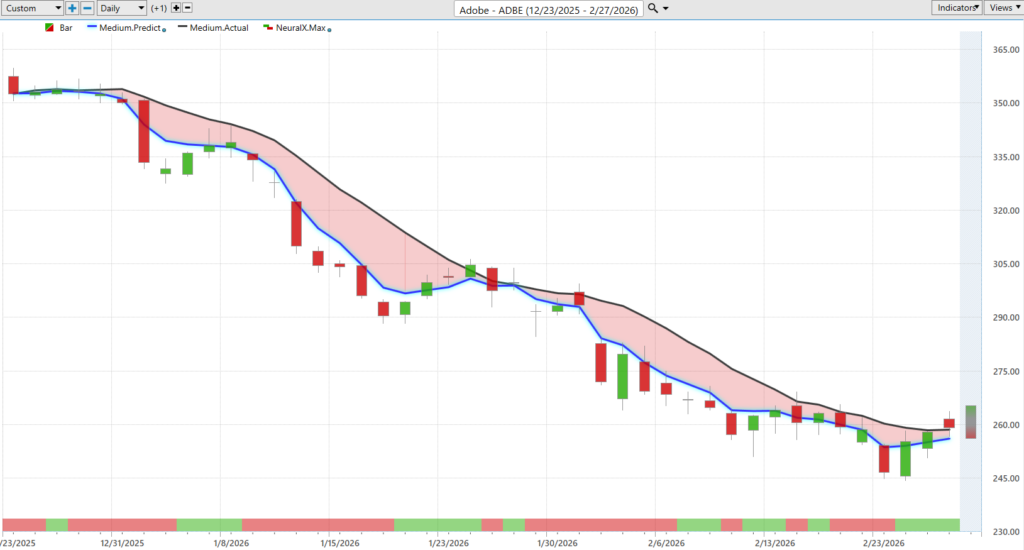
Well, here’s Adobe. So, I think we looked at this several weeks ago. We see that blue line below the black line. Neural index very bearish here. You’ll see we get these blips where we get little consolidations and sideways price action. Uh, but this is what’s really exciting about Vantage Point, is you’re getting a updated forecast every single trading day. So, as the market moves in a downtrend, uh, you’ve really got all of these levels to go ahead and potentially set short positions or certainly get out of any long positions in the portfolio. Uh, and you see just over the past couple of weeks just a good road map here that says, okay, prepare for the range to go a little bit higher tomorrow, go a little bit higher the next trading day, uh, but still not quite in an uptrend and a very vulnerable to a downward movement in price. Uh, and so, overall here in shares of Adobe, off about 26% now just in the past 41 trading days. So, really want to avoid, uh, some of these stocks like Adobe, Zoom, but there are some bright spots in the market. You’re seeing things rotate, um, quite well, you know, out of Nvidia and some of the high-flying tech stuff, but still finding its way into other areas of the market.
So, uh, with that, we’ll go ahead and leave it there. Once again, this has been the hot stocks outlook for February 27th, 2026. Thank you all for watching. Best of luck out there, and bye for now.”


