


Register for a Free Live Training
The Hot Stocks Outlook uses VantagePoint’s market forecasts that are up to 87.4% accurate, demonstrating how traders can improve their timing and direction. In this week’s video, VantagePoint Software reviews forecasts for Adobe ($ADBE), Coca-Cola ($KO), Carrier Global ($CARR), Procter&Gamble ($PG), Rivian Automotive ($RIVN), SNAP ($SNAP)
VantagePoint A.I. Hot Stocks Outlook for February 6, 2026
Hello again, traders, and welcome back to the hot stocks outlook for February 6, 2026. Hope you all are having an excellent week out there in the financial markets. As always, we’re here to take a look at the most recent VantagePoint A.I. predictive forecast.
So, if you haven’t already, be sure to go ahead and click the link down in the description below. Uh, and you get signed up for a live demonstration and learn all the specifics about how these predictive indicators and technologies are helping traders navigate the financial markets, really make better trading decisions day to day.
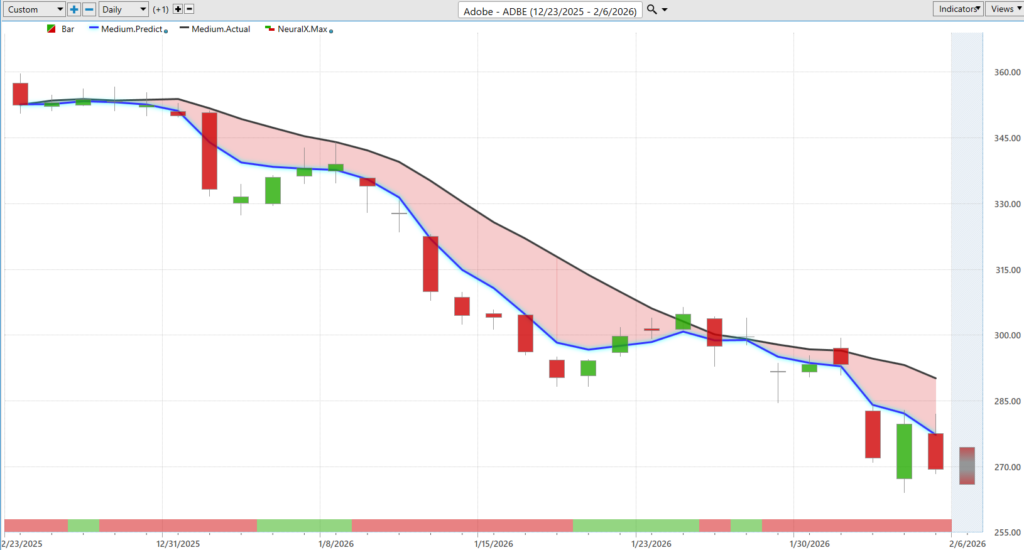
So we can start out here with shares of Adobe ($ADBE), seen a lot of weakness across the Adobe markets and specifically, uh, these software stocks. Uh, and a really great example how all of these predictive tools work together.
So here in Adobe ($ADBE), what we’re looking at here is daily price action. So daily bars and candles, where each one of these candles on the screen is going to represent a full and complete trading day. Uh, and we see that it’s right up against all that price data that you’re first going to notice here is a black line and also a blue line value. And so the black line that you’re seeing there, that is actually a simple moving average. This is a very common technical analysis tool. Uh, in this case, it would just be a 10 period.
So it just looks at the previous 10 closes, adds them all together, and then divides by that number. Uh, and that really acts as a rolling baseline, right, letting us know where market prices have been over a given period of time. But what VantagePoint traders are able to do is compare that value to this proprietary predicted moving average. And so for this number essentially a price for it to get calculated and plotted on the chart every evening, well, this is where the technology of artificial neural networks come into play and are performing what we would call intermarket analysis.
So this is very important. And so rather than just looking at past prices, what VantagePoint’s technology is doing is looking at dozens of markets that are known to drive and influence future prices, specifically of shares of Adobe ($ADBE). Uh, and so this can be things like other individual stocks. It can be ETF sectors that wrap up a lot of software stocks. It can be a lot of counterintuitive examples where a valuable relationship has been, uh, understood there and utilized into the forecast.
But this really goes all the way down the line. So this will go to things like global currencies, like the value of the dollar index, global interest rates, uh, and even potentially global commodities, uh, where applicable. And so it’s taking all of that information and utilizing that, running that through those artificial intelligence neural networks, and then generating highly accurate price prediction.
So whenever we see this blue line, in this case, cross below the black line, well, it’s suggesting those average prices are going to start moving lower in this case. Now, that’s not the entirety of the forecast here. Of course, if you look at the bottom of the chart, you see this bar that goes from green to red, back to green. Well, this is another indicator that’s also utilizing that approach of artificial neural networks, but it’s solving a different problem for traders, and that is just short-term strength or weakness over the next 48-hour window.
So we can think of that as a couple of candles at a time moving forward through time here. Uh, and so we see that as long as that blue line remains below the black line, the overall market continues to trend lower. Now, what’s interesting about this is you don’t just see this on shares of Adobe ($ADBE)
We’ll take a look at Snap ($SNAP) here. Uh, we can run a lot of these markets just through VantagePoint’s Intelliscan and determine, hey, which stocks are in downtrend, which stocks are in uptrend, uh, which stocks are, you know, transitioning as far as shifting their trends from bullish to bearish. Uh, and clearly here this has been an area of weakness along with the broader market, where we see a lot of volatility and really want to figure out, hey, what’s selling off and what’s actually, uh, looking fairly bullish here.
So huge move lower there in shares of Adobe ($ADBE). Um, and just lastly, with these overall forecasts, you’re provided a predicted high and a predicted low range. So you’re getting the overall trend direction, short-term strength or weakness over those 48-hour windows, then also a prediction of the high and low for the next trading day.
And we see how this all works is once we understand that the overall trend is lower, well, we’d want to be shorting at these predicted highs, targeting predicted lows, uh, or adding to a trending or swing position here. So you have a really solid road map, uh, for traders to navigate the markets and really know, hey, what decisions should we be making at these particular price levels.
And again, really nice movement lower here, uh, in shares of Adobe ($ADBE) overall, here about a 23–24% decline in just the past 29 trading days.
Now, where has there been strength in the market? Well, it’s a lot of the, uh, non-cyclical stocks, a lot of the consumer staples. Here’s shares of Coca-Cola ($KO). You see very clearly that predicted moving average getting solidly above the actual moving average, and over the past couple of weeks here, I mean, this has just been a very strong forecast one day to the next, indicating that, look, you know, there may be some weakness across the major indices and software stocks, but we are in a very strong uptrend, uh, in a lot of these consumer staples.
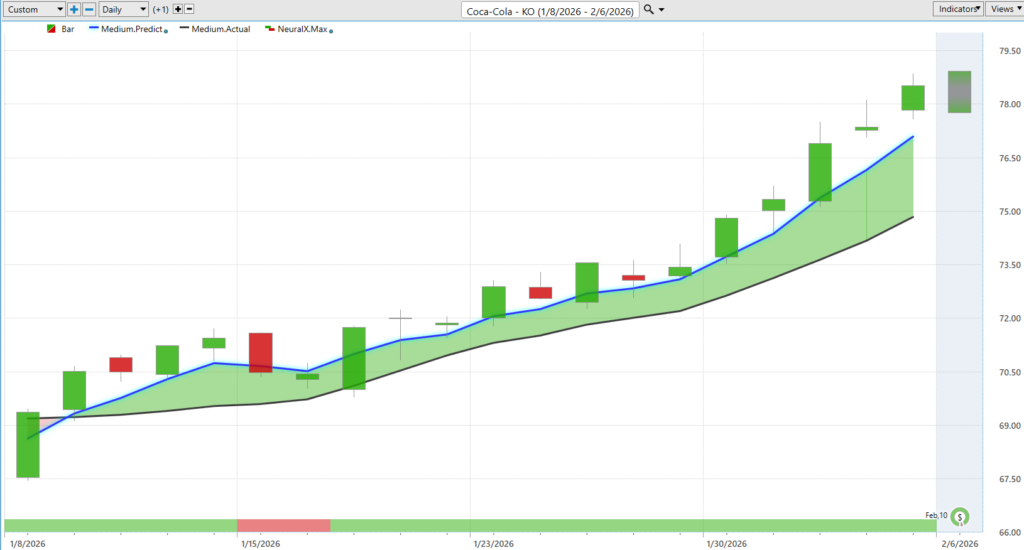
Here’s Coca-Cola ($KO). We’ll look at Procter and Gamble ($PG) here. Uh, but really nice move here on the bullish side. We see since those predictions got bullish all the way at the beginning of January here, up about 12, almost 13%, shares of Coca-Cola ($KO) over the past 19 trading days.
We’ve seen things like Walmart do very well, uh, and again we can say, well, okay, well how have those predictions looked even down to those predicted high and low and those intraday levels? You see how this works again. That neural index gets bullish, couple days of weakness, we got a perfect road map as far as where’s the daily low likely to come in, or should we be looking to accumulate a position.
So really nice opportunity there. Again, shares about 12–13%.
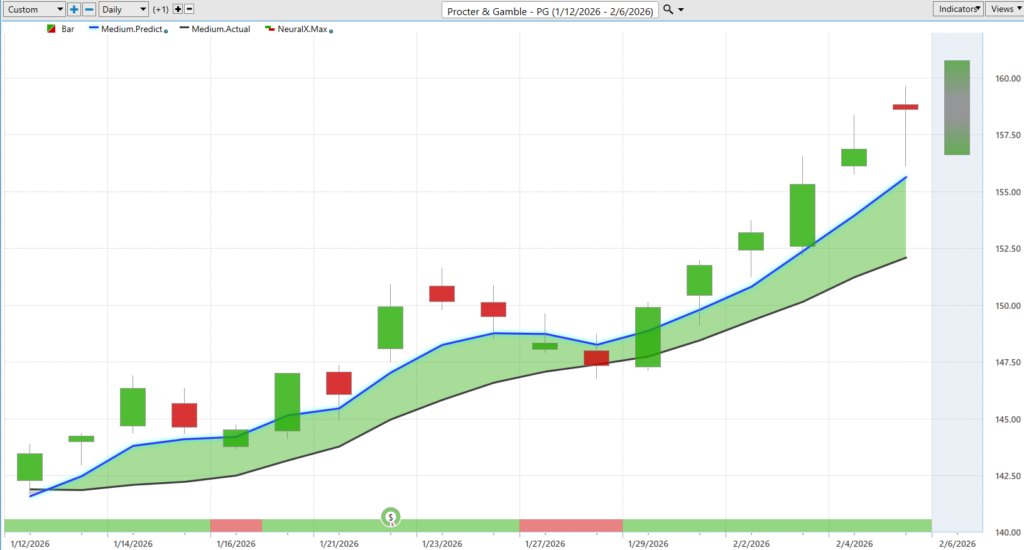
Here’s Procter and Gamble ($PG). So very similar story. And again, we really see that a lot of these stocks started to turn up towards the midpoint in January. So you see Coca-Cola ($KO), Procter and Gamble ($PG), very strong bullish forecast here.
And again, you’ll see these periods where Neuralytics goes bearish for a day here, pretty quickly gets bullish. That’s where we see this momentum, uh, really start to kick up in the market. We can, of course, look at those VantagePoint predicted highs and lows, and a very solid road map if you’re going to be a buyer. Well, where do you want to scoop up shares? We see intraday down at these lower price levels as far as the, uh, lower range for the day and week there.
Uh, again, overall here about a 10, almost 11% rally over those 17 trading days. Uh, here’s Carrier Global ($CARR). So, uh, some of these air conditioning stocks actually performed quite well. Blue line over black line, neural index bullish. We get a little bit of sideways price action just as those neural indexes blip down to a zero.
Uh, but overall you’re getting a very consistent forecast. So this indicator is right up to 85–86% of the time on whether we’re likely to see that strength over the subsequent 48-hour period. Uh, and you see when you get the overall trend and that neural index bullish, well, you tend to see that that’s where you get that momentum in the market. Uh, shares of about 13%. I think we’re bouncing a little bit higher here, uh, seeing a lot of separation between that predicted moving average and the actual moving average.
Uh, and again, just a very strong movement here. Uh, and we see this correlation of look at these stocks that started to turn up in the midpoint of, oh, January. That’s probably where you want to focus on those markets that are still in uptrend, uh, and really avoid some of these markets where those predicted moving averages are bearish.
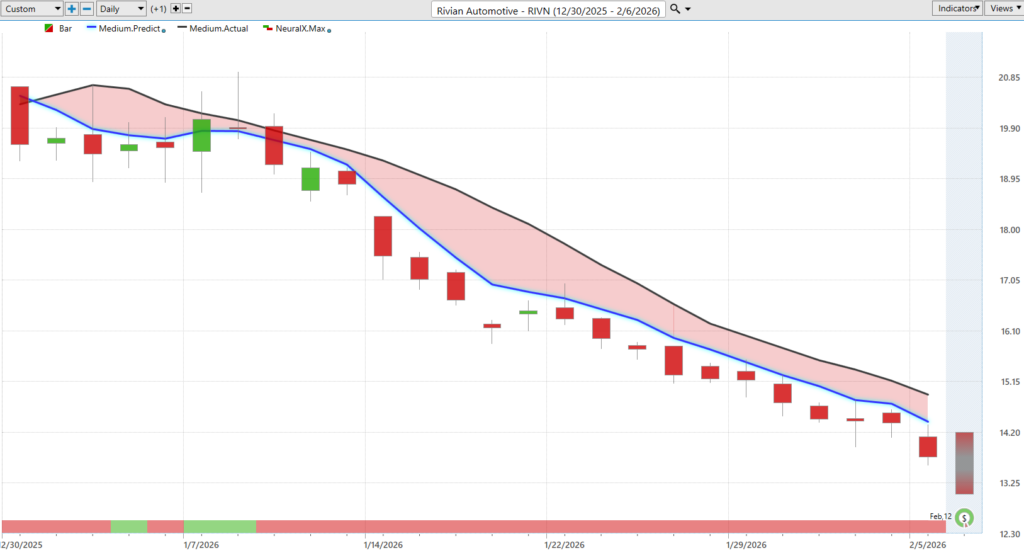
Rivian Automotive ($RIVN). So here’s Rivian Automotive ($RIVN). Uh, blue line below the black line. You see this neuroindex getting bullish, and you get a little sideways price action. But very clearly this market is in a strong downtrend, and traders are going to get that road map every single day that says, look up towards these predicted highs if you want to trade at all, be on the short side.
Uh, and we see the market just continuing to decline day after day here, uh, and, uh, uh, just, you know, remaining in a fairly strong downtrend here, about a 30% decline here over that similar period of time where we’ve seen again those consumer staple stocks start to turn up. Well, here we see over the same period of time Rivian Automotive ($RIVN) down about 30% over the past 25 trading days.
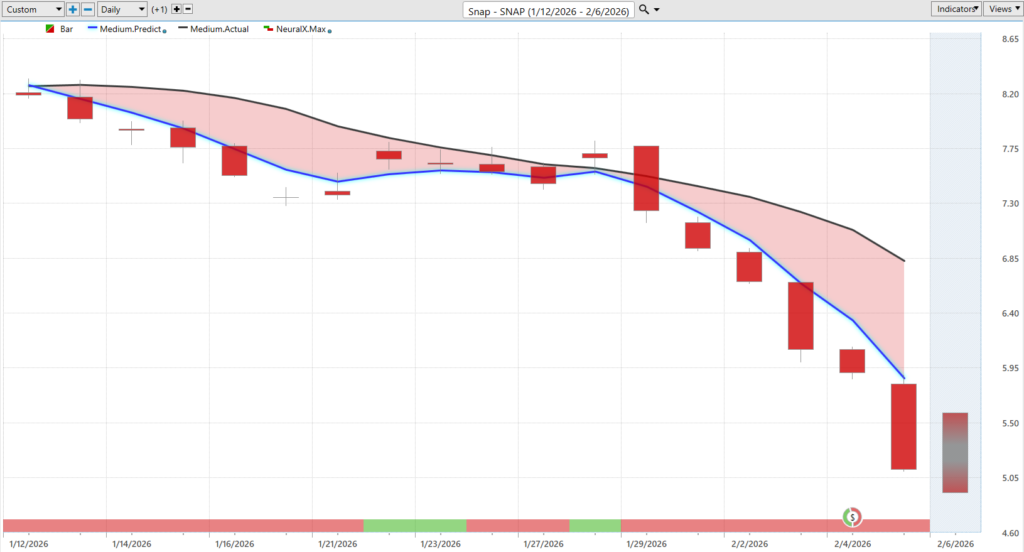
We can return to some of these software stocks. And so this has been Snap ($SNAP) sort of the bigger story in the market as far as weakness here. We’re just seeing a lot of rotation, and that’s leading to a lot of volatility in markets.
So here you see Snap ($SNAP), blue line below the black line. Neural index gets bullish, and you get that sideways price action. But very clearly market is in a downtrend, uh, and you want to be again shorting, taking profits on shorts if doing anything, uh, in a market where you get these forecasts from VantagePoint.
So again, you see this movement higher, movement higher here, uh, and very clearly a, uh, pretty weak situation here, uh, going on in shares of Snap ($SNAP).
So we’ll go ahead and leave it there for today. Um, there’s again been a lot of volatility in markets, right? These software stocks moving down 30-plus percent, uh, some markets starting to perk up, but, uh, sort of few and far between. And you want to focus on, again, those sectors that are strong and showing a lot of correlation as far as, hey, which stocks are in these strong uptrends, uh, and which stocks are, uh, you know, you know, you know, vulnerable, uh, to some strong weakness here, and just get out of the way.
So, once again, this has been the Hot Stocks Outlook for February 6, 2026. Thank you all for watching. Best of luck out there, and bye for now.


