


Register for a Free Live Training
The Hot Stocks Outlook uses VantagePoint’s market forecasts that are up to 87.4% accurate, demonstrating how traders can improve their timing and direction. In this week’s video, VantagePoint Software reviews forecasts for Archer Daniels Midland ($ADM), Boeing ($BA), Cameco ($CCJ), Uranium Energy Corporation ($UEC), Costco Wholesale ($COST), Micron Technology ($MU)
VantagePoint A.I. Hot Stocks Outlook for January 23, 2026
Hello again, traders, and welcome back to the Hot Stocks Outlook for January 23rd, 2026. Hope you all have had an excellent week out there in the financial markets. And as always, we are here to take a look at the most recent VantagePoint A.I. predictive forecast.
So, if you have not already, be sure to go ahead and click the link down in the description below, and you can get signed up for a live demonstration and learn all the specifics about how these predictive indicators and technologies are helping traders navigate the financial markets and really make better trading decisions day in and day out.
And so, we have a lot of opportunities to cover here. Many of these we have looked at in previous Hot Stocks Outlook videos, really updating these forecasts. And that is really what it is about, having this adaptive technology to manage opportunities and really make the most of your trades.
And so, we will start out here with shares of Archer Daniels Midland ($ADM).
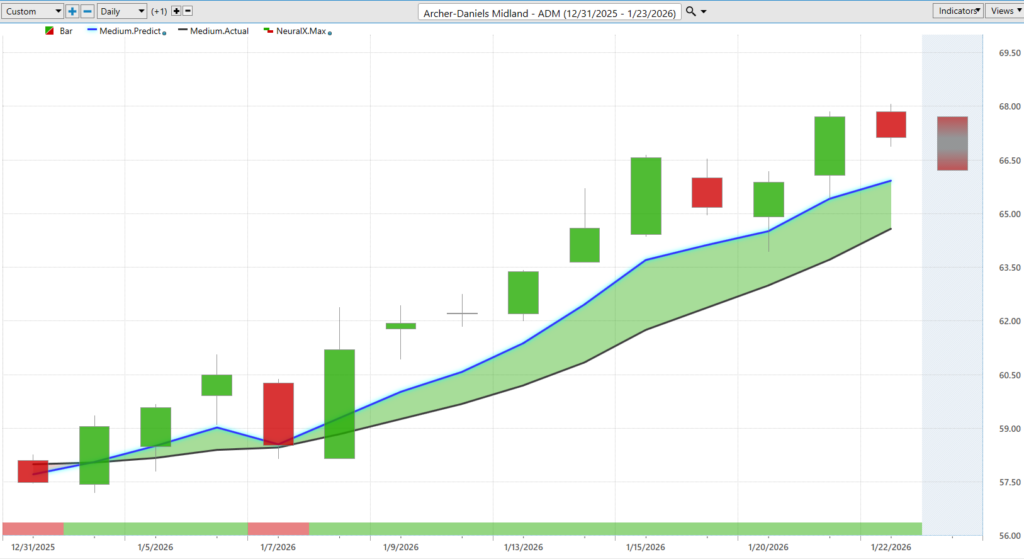
ADM. And what we are looking at here is daily price action. And as always, all of this data works off of end-of-day data. And right up against those candles, what you are going to notice is there is a black line and there is also a blue line value.
Now, the black line that you see there is an actual simple moving average, or what we refer to as the actual moving average. It is a 10-day simple moving average, which just means that it looks at the previous 10 closed prices, adds them all together, and then divides by that number.
Now, the weakness with traditional technical analysis like this is that all the data just comes from the past. So it is really just reconfiguring what has already occurred, and there is no predictive capability there. It is really just a summary, again, of what has already happened in the market.
And so, what VantagePoint’s technology is able to do is generate this blue line value. And for this number, essentially, this price gets plotted and then calculated on the chart every evening. Well, this is where that technology of artificial neural networks comes into play, and they are performing what we would call intermarket analysis.
And so, what that means is that rather than just reconfiguring the past prices of a single market one at a time, what VantagePoint’s technology is doing is looking at dozens of other markets that are known to drive and influence future price.
And this is very important because within those intermarket relationships are valuable price clues as to where things are headed next, and that can be used to produce a reliable prediction.
So, this can be things like other individual stocks. It can be ETF groups that wrap up a lot of sectors within the marketplace. But this really goes global. It looks at things like global currencies, global interest rates, and even global commodities where applicable to a particular asset or stock.
And so, it really takes these dozens of markets, all this information, and then generates predictions based off of those relationships.
And so, whenever we see this blue line cross above the black line, that is VantagePoint’s tool suggesting that average prices are going to start going higher, and traders may want to look to take a long position.
Now, as long as that blue line remains above the black line, the overall trend is still expected to go higher. And we see here in ADM, really just this month over the past 14 trading days, shares up over 15%.
Now, that is a very useful tool to really help trend traders identify these shifts in market direction. But there is really more to round out the forecast from a day-to-day basis.
And so, if you look at the bottom of the chart here, we have this bar that you will see goes from green to red and back to green. Well, this gets updated every single trading day on the right-hand side of the chart here. And what it is doing is forecasting short-term strength or weakness over the next 48 hours.
So, we can think of that as really just a couple of candles at a time, looking forward into the future and adjusting that prediction every single trading day.
And so, how this works is that when the neural index is green, you should expect strength over the next 48 hours. Oftentimes, within an uptrend, when we see the neural index go bearish, you can expect some weakness again within those next couple of trading days.
And so, you see actually price data on this gap down here moves below this average before the trend continues and the market moves higher. But once it gets green again, we see that consistent couple of days of strength in and out of the market.
Now, additionally, we are even provided a predicted high and a predicted low. And so, this really rounds out the entirety of these forecasts. You get the overall trend direction. You get that neural index short-term prediction of strength or weakness. And then we are down to intraday prices of what is likely to be the high or the low of the next trading day.
And these levels are very useful for traders if they want to add to positions, maybe take a day trade, and again really make the most of their trading strategies.
And so, we see how this works day to day. As we see that market go into an uptrend, we move down to this predicted low. You will see this from time to time where the market does not hit that predicted low, and then within the next trading day, you are moving right down to that level.
So, this is where, when you understand the technology, you really become aware of these levels and execute your strategy. You know, once you identify, “Hey, I want to be a buyer. I want to be a seller,” and what you want to do.
Now, we see the market trades higher. Again, one of these situations where after this trading day, what the market is telling you, or what the VantagePoint software is telling you, is expect the trading range to go lower.
You actually have this predicted high and predicted low before that trading day occurs. And so, you really understand what to expect. Okay, well, now we should expect some weakness tomorrow. But overall, expect over the next 48 hours to see that strength.
We see the market goes higher still here towards the end of the month.
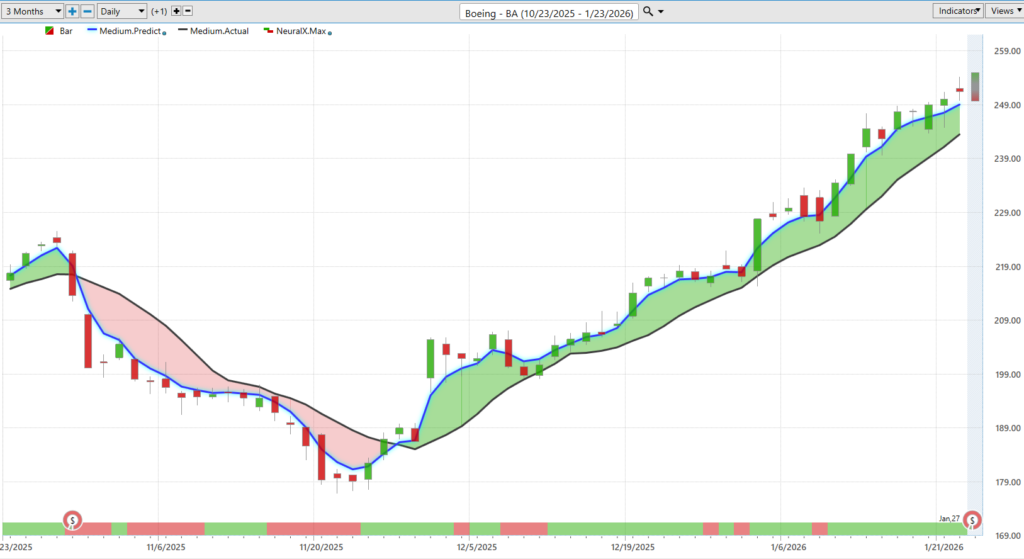
Now, we have also taken a look at Boeing ($BA).
We have taken a look at Boeing, and this is a market that I think we first brought through somewhere around here. And I want to go ahead and update some of these forecasts because we have seen Lockheed Martin and Boeing actually perform very well here.
And so, once you identify that trend and can get an entry and an early position onto a particular opportunity, well, you of course want to manage that opportunity as effectively as possible, whether that means adding to the position or taking some profits.
And so again, we see as these forecasts move forward, you are moving down to these predicted lows within the week and seeing very strong uplifts in the market. And this is actually Monday here and Tuesday here.
So again, when you have identified, “Hey, this market is in an uptrend,” where do I want to be buying the market for the week to do some day trades or potentially adding to this swing position with profits?
Well, here we see the market making a nice swing higher, about 3% just this week. So, a really nice opportunity there in Boeing overall.
Now, shares have moved up about 35% in just the past 36 trading days. Really exciting move there out of Boeing.
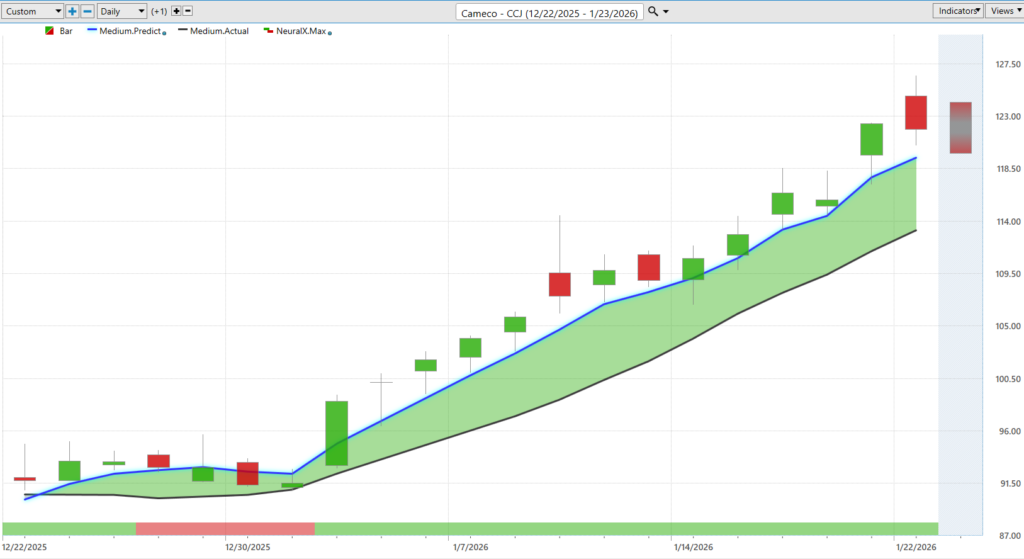
We have also looked at some of the nuclear stocks. So, here is Cameco ($CCJ).
Exact same approach here, where we see that market go into an uptrend. We will get these periods where the neural index goes bearish. You can expect that subsequent weakness over those 48-hour periods. But once the neural index gets bullish, that is where the strength really kicks back into the market.
We can, of course, use those predicted highs and lows. And again, we see this being Tuesday, right? So, coming into the week, we have this gap up coming into the week, but moving down to that predicted low on Tuesday, getting a really good weekly price.
And then shares really bouncing pretty aggressively higher here just this week. So, I think we looked at this last week as well. Shares up about 10% from those recent predicted lows just over a couple of trading days. So, very nice swing in the market as shares go higher.
Uranium Energy Corporation ($UEC)
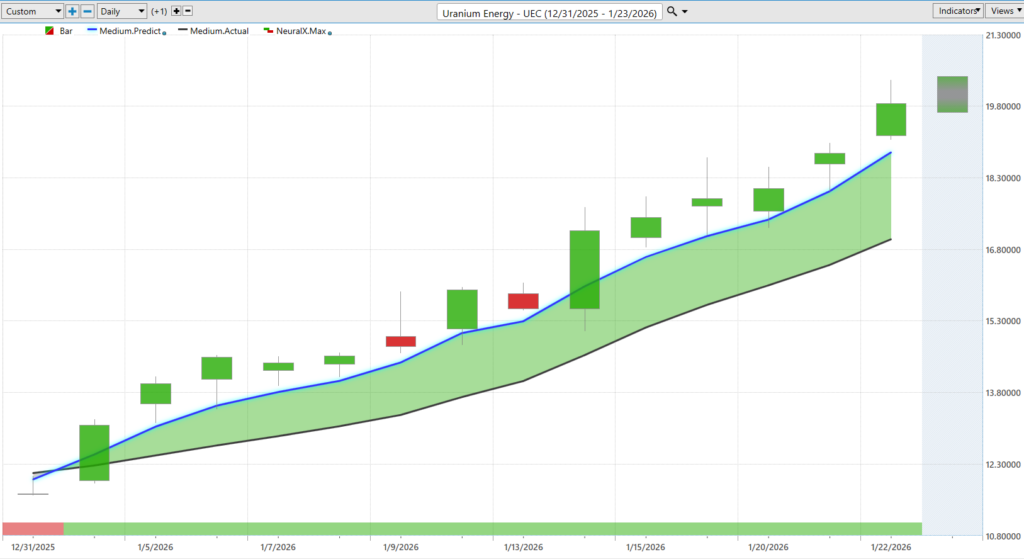
Here is Uranium Energy Corporation ($UEC).
Very straightforward forecast here, right? Blue line over black line. Neural index very bullish, remaining bullish every single day.
And so, traders can just say, “Look, all we have really got here is the market is in an uptrend. Ideally, intraday, if you can get in down at these predicted lows, that would be a great level to take a position.”
And so again, just this week, from Tuesday to currently, we are up about 13%. Overall, the trend from these early predicted lows is up about 44% in just the past 12 trading days. So, all this happening really just in this month of January.
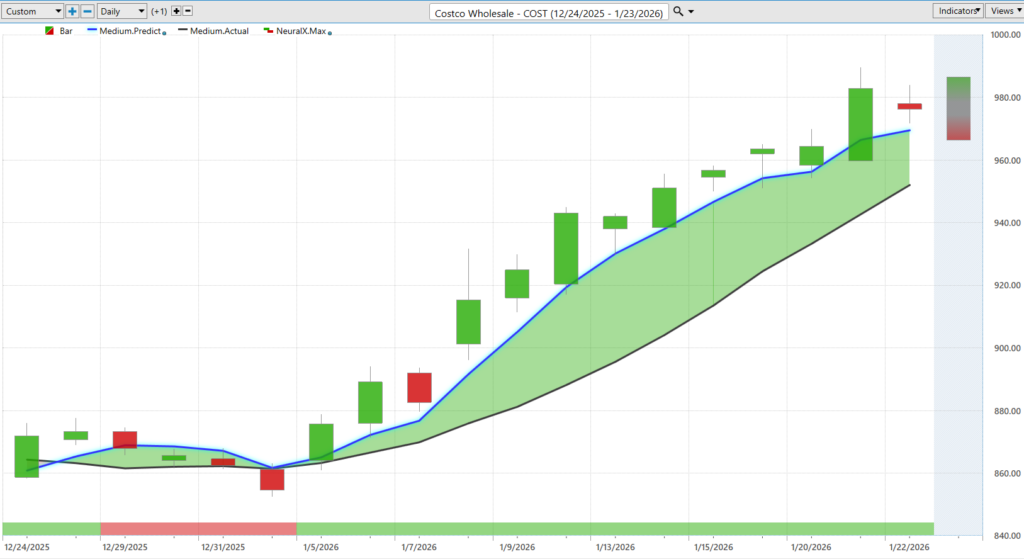
Now, here is Costco ($COST).
Very interesting opportunity here. We got this blue line crossing above the black line. And again, you will notice the neural index goes bearish. So it is warning you to expect some weakness over these subsequent 48-hour periods. But we never get that crossover of that blue line moving below the black line.
And really, for the past few weeks here, we have just seen a tremendous amount of strength in the market.
So, traders can again understand, “Hey, where do you want to be buying?” Well, down at these predicted lows. We see this day you get filled, and then the next day you are gapping up, and that trend is really continuing.
And early couple of days here, where the market moves down to these predicted lows again this week, Monday and Tuesday, moving down to the predicted low, and then seeing a really nice move on Wednesday’s price action there in Costco.
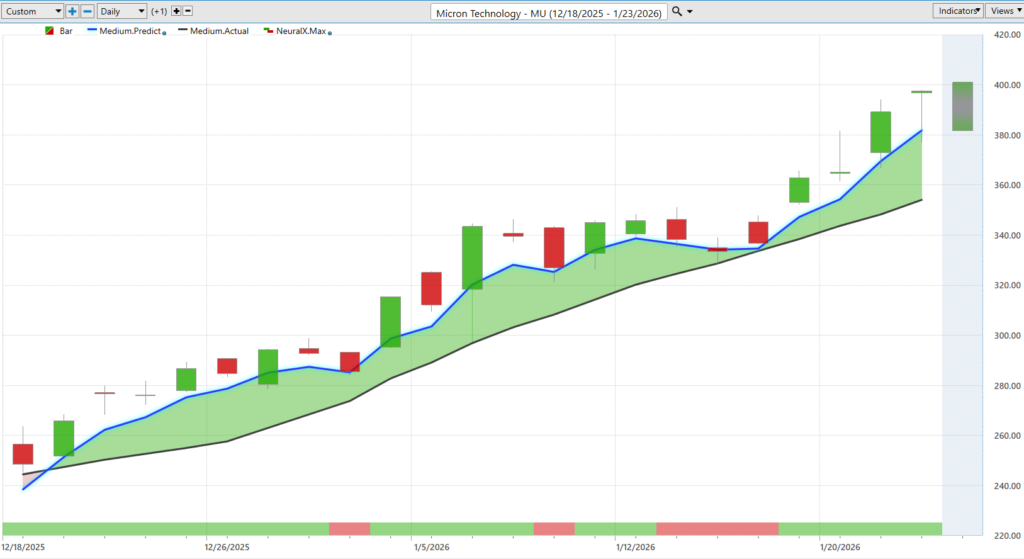
And lastly here, we have Micron Technology ($MU).
Micron. So, another good example here of how all of these tools work together. Obviously, a lot of attention around some of these RAM and hard drive companies, storage companies as far as computing goes.
Well, here we see the blue line above the black line. We have a couple periods here where the neural index goes bearish. That trend immediately continues.
But here we see the market running sideways here, but still very much that blue line above the black line, and suggesting prices are going to keep going higher here.
So, if you are doing trading in Micron, you would want to go long and take profits on longs. Again, just 22 trading days, shares up about 56%.
And even just over the past couple of weeks here, moving down towards these predicted low levels, a really nice entry early last week, and really getting the benefit this week as shares really march higher here.
So, a lot of very exciting opportunities. But of course, regardless of where you are trading, you want to have the right tools to really adapt to those shifting market conditions, make the most of those trading opportunities, and potentially get aggressive in a trade when those things are working and you have unrealized gains and profits to really play with and be more aggressive on some of these really strong rallies we have seen in the market.
So, we will go ahead and leave it there for today. But once again, this has been the Hot Stocks Outlook for January 23rd, 2026. Thank you all for watching. Best of luck out there, and bye for now.


