


Register for a Free Live Training
The Hot Stocks Outlook uses VantagePoint’s market forecasts that are up to 87.4% accurate, demonstrating how traders can improve their timing and direction. In this week’s video, VantagePoint Software reviews forecasts for Reliance Steel & Aluminum ($RS), Boeing ($BA), Cameco ($CCJ), Costco Wholesale ($COST), Lockheed Martin ($LMT)
VantagePoint A.I. Hot Stocks Outlook for January 30, 2026
Hello again, traders, and welcome back to the hot stocks outlook for January 30th, 2026. Hope you all have had an excellent week out there in the financial markets. As always, we’re here to take a look at the most recent Vantage Point AI predictive forecast, really get caught up on many of the previous predictions we’ve looked at in previous weeks. And, of course, if you haven’t already, be sure to go ahead and click the link down in the description below, get signed up for a live demonstration, and you can learn all the specifics of these predictive indicators and technologies and how they can help traders make much better trading decisions out in the marketplace.
Now, we’ve looked a lot at metal and mining companies, shares of SLV, silver market, gold market doing very well.
Reliance Steel & Aluminum ($RS)
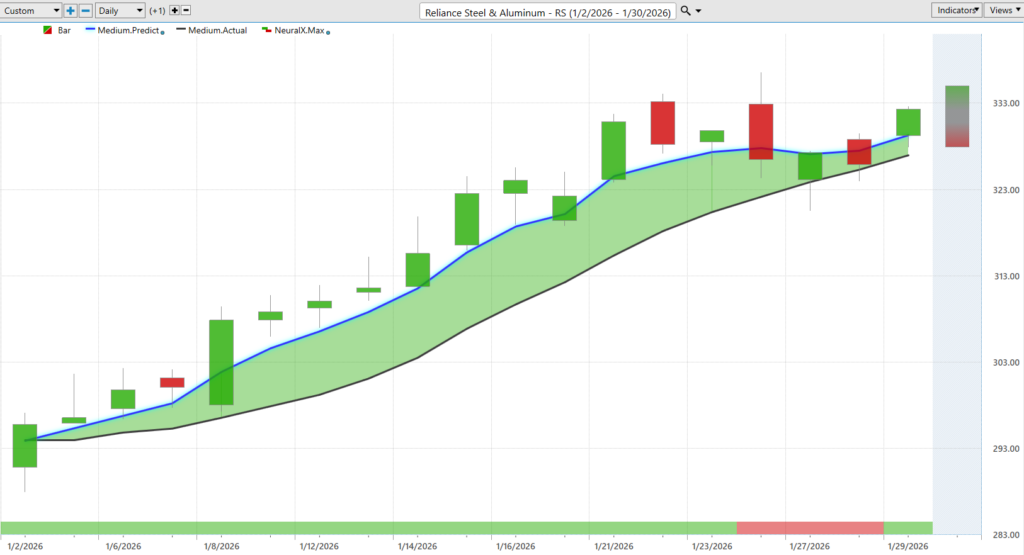
Also, the steel and aluminum markets, Reliance Steel and Aluminum ($RS), doing really well. So here we have Reliance Steel and aluminum, and it’s a really nice example here of how all of these predictive tools work together.
And so what we’re looking at here with each one of these candles is daily bars and candles, where each one of those candles would represent a full and complete trading day. And it’s right up against all that data that the first thing that we want to understand about Vantage Point’s predicted forecast is this black line and also this blue line value. And so what that black line is on the chart is actually a very common technical analysis indicator. It’s what’s called a simple moving average. And in this case, it would be a 10 period. So it just looks back at the previous 10 period closes, adds them all together, and then divides by that number.
And traditional technical analysis really suffers from this weakness of only looking at what’s already occurred. So it has no predictive capabilities in the market. And it also is only looking at one market in question, really just pulling data from one singular market at a time, and not really accounting for how other markets can drive and influence future prices. And so what Vantage Point traders are able to do is really utilize that as a baseline but compare it to this blue line predicted value. And for this number, which is essentially going to be a price that’ll get calculated and plotted on the chart every evening, well, this is where the technology of artificial neural networks come into play, and they’re performing what we would call intermarket analysis.
Now, what that means is that, again, rather than just looking at past prices of a single market at a time, Vantage Point’s AI is looking at dozens of other markets that are known to drive and influence future prices. So when we’re talking about steel and aluminum, this can be things like other aluminum stocks like Alcoa and other mining stocks. This can be shares of ETFs that wrap up big sectors of the marketplace at a time. But it really takes this global, where it’s going to be looking at global currencies, global interest rates, and even global commodities where applicable to the asset in question. And so it’s weighing all of these really dozens of relationships at a time and utilizing the price clues that are derived from those data sets into an extremely accurate forecast.
So whenever traders see this blue line cross above the black line, well, it’s suggesting that these average prices are going to start going higher. Traders can look to take a long position. So you see shares up just in the past 18 trading days about 12%. But this is where things get really interesting, as traders need to solve really a wide set of problems in the marketplace. Not only the overall trend direction, but what likely is to occur in the very short term.
And so what we see here at the very bottom of the chart is another Vantage Point indicator, again utilizing that technology of artificial neural networks, but it’s predicting short-term strength or weakness over the next 48 hours. So are we going to get strength, weakness, just over thinking of it as really a couple of trading candles into the future. So what Vantage Point traders have here is overall trend direction and this short-term indication of really short-term momentum and strength over that 48-hour window.
And lastly, even we’re down to predicted highs and predicted lows. So we’re again utilizing that intermarket technology, those artificial neural networks, now to get down to intraday levels where price is expected to trade. So you really end up getting this robust forecast of the overall trend direction, short-term strength or weakness as far as short-term momentum goes, and then also that predicted high and low value.
And so what we can do is, of course, each week we look back and say, well, how accurate have all of those predicted high and predicted low values been as we move forward through time and really see how this works. That before any of these trading days occurred, you have this red and black line that are above the actual market data that fills in. You see early on getting this gap down pretty perfectly down to that predicted low and then the uptrend continuing. And just notice how the market responds up towards these predicted highs. Usually, it really putters out there towards the end of the day, but overall the trend very clearly to the bullish side. You only want to be taking long positions.
And we’ll notice things like even currently right here, where you see we haven’t moved down to these predicted lows. You always want to be aware of those levels on the chart. And, of course, we’re seeing a lot of volatility here going into the end of the week. But what we have about one, two, three, four, five, about, you know, five entries where it’s moving down to that predicted low, moving up to the predicted high before starting to move lower. So really nice opportunity here across, again, the steel and aluminum space, of course, in addition to gold and silver prices and metal prices have been really on a tear, where we’ve highlighted some of those mining companies and also just SLV directly here.
So about a 12% rally here in Reliance Steel.
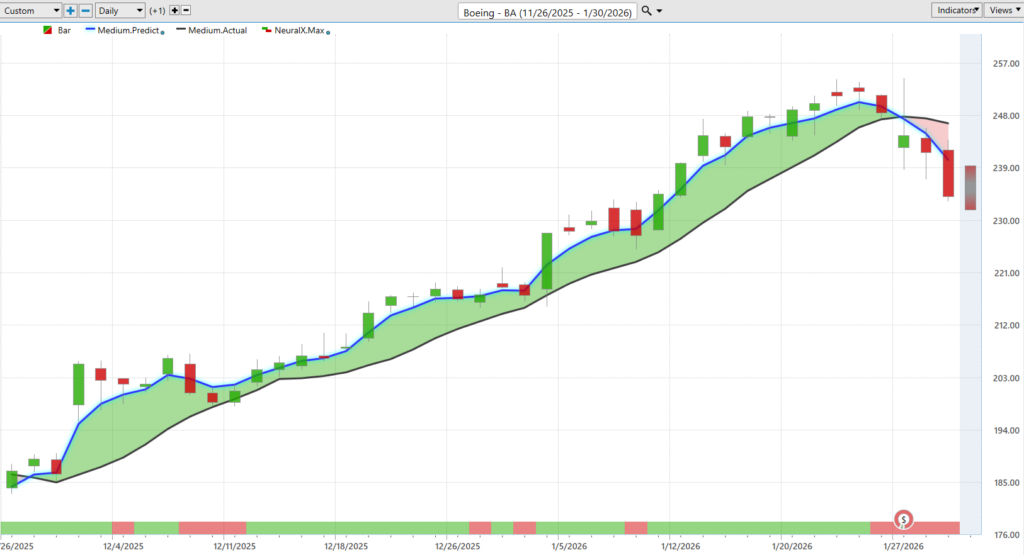
Here’s shares of Boeing. So I actually brought this through really a few weeks ago. I really kept updating this because we saw a lot of strength in Boeing. Lheed Martin. BAE is an international stock in the defense sector that’s doing quite well. But here with Boeing, a really great example of how we can identify these trends moving into uptrend where we might want to focus that attention, but also recognizing when things shift in the market.
And so when we see that blue line get above the black line, well, clearly you only want to go long, take profits on those long positions. And again, we can see how accurate are all of these predicted lows. And you see as the market starts to go into this rally, you have a very clear road map of where prices are likely to move and if this market is still in an uptrend, if you still want to be exploiting the bullish side of the trade.
And so we see as we get this crossover to the downside, clearly here the market’s going lower and seeing some softness just across the board here. So very clearly here, the market’s in a downtrend. Well, you want to be shorting and taking profits on shorts if you’re going to be doing any trading there at all, or just take some profits on this long position.
We see getting a really nice rally here over 40 trading days, shares up about 33% in shares of Boeing. So really nice period to identify that uptrend.
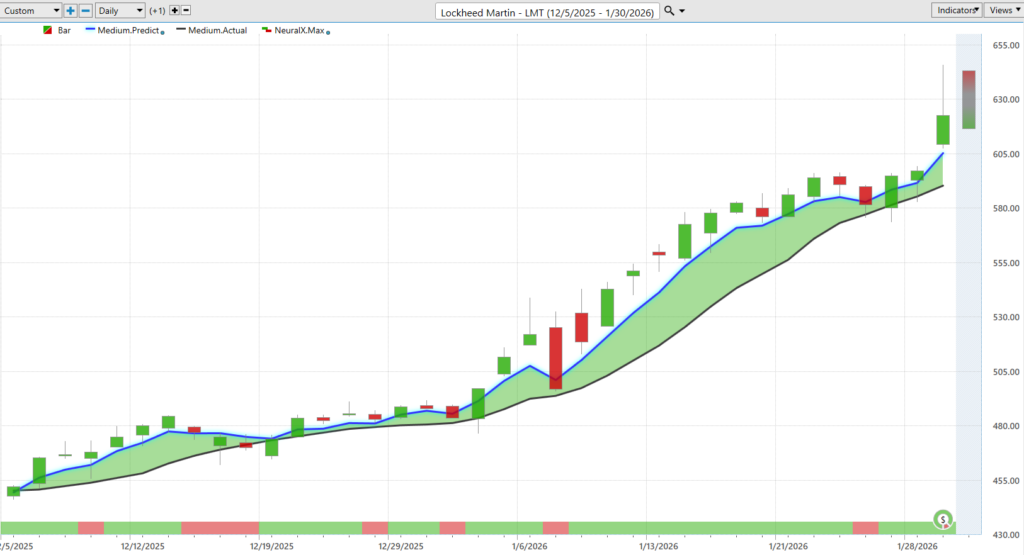
Here’s Lockheed Martin ($LMT)
Martin, which is very correlated here to Boeing. We’re seeing a lot of just, you know, similar moves day to day. But here we see that blue line getting above the black line. Notice these periods where the neural index goes bearish. It tends to just run a little bit sideways for the next couple of trading days. But as long as that blue line is above the black line, you’d expect the overall trend to still be in an uptrend.
And so, again, we can look back at these pre highs and lows and even just over the last couple of weeks here, identifying this strength in many of these stocks. Well, okay, well, Boeing‘s in a downtrend. Let’s not focus attention there. But here we see really nice entries going in towards earnings and then the market really responding well and still trending higher. So really nice move in shares of Loheed Martin. Look at this whole sector doing quite well. 35% rally here over the past 36 trading days.
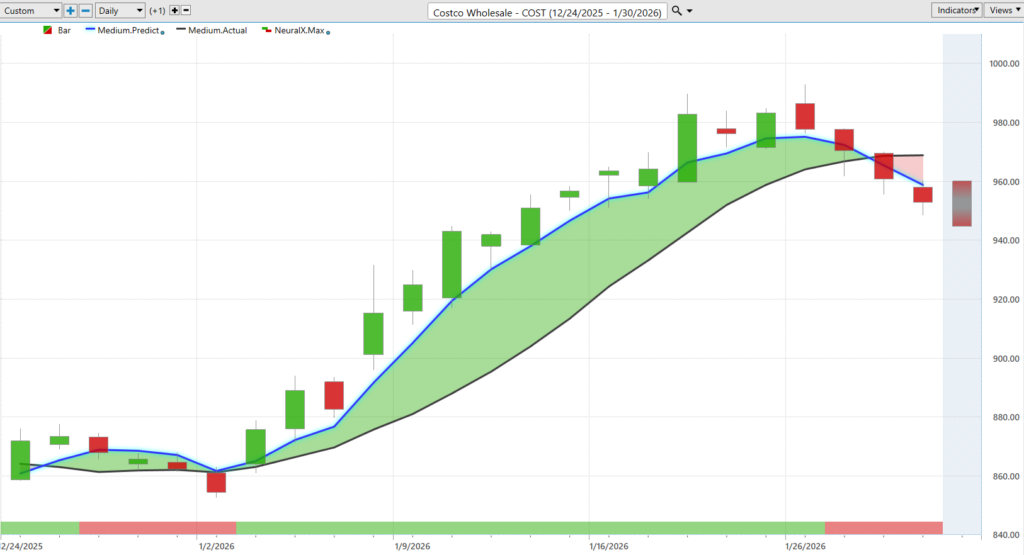
Additionally, we brought in Costco Wholesale ($COST). So this is a market where we get this blue line above the black line. Notice the neural index goes bearish here, and you get this sideways price action and dipping lower. But we never get that blue line actually crossing below the black line. It remains bullish. And we see the market very quickly recovers. Neural index gets bullish, and notice the subsequent price action over these 48-hour periods. Just continued strength, continued strength, until you get to about here, warning of some weakness in the market and seeing that trend shift to the downside.
So a pretty quick rally here, shares up, let’s see, about 11, 12% just over 20 trading days, so just a few weeks of time there, market moving about 12% higher. So really nice move there in shares of Costco. And, of course, as the rally went higher, there’s these short-term trading opportunities. So if you’re buying down at these predicted lows, taking advantage of this momentum in the market, nice opportunities to pull some out of the opportunity in the trade there.
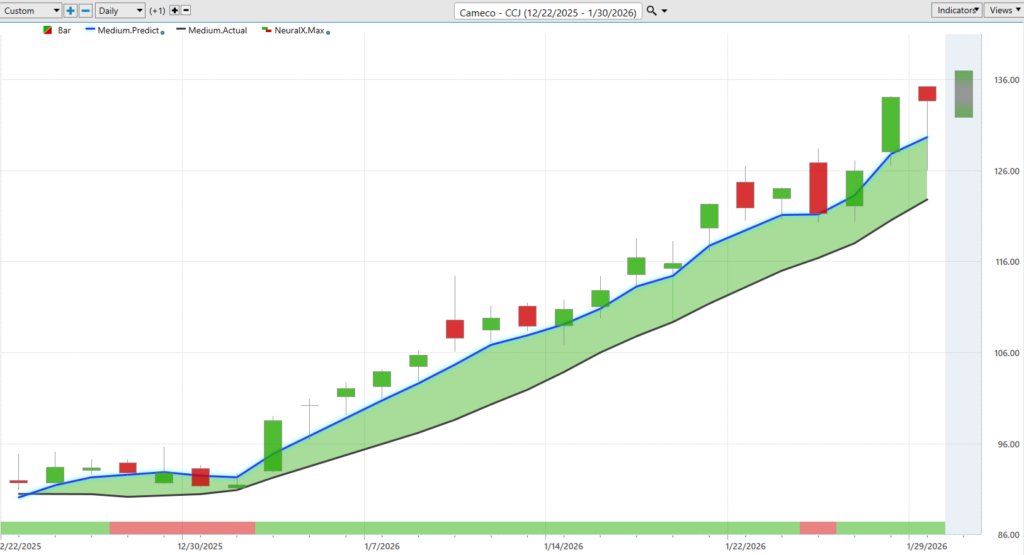
So lastly, we’ll go ahead and end on Cameco ($CCJ). Shares of KCO CC CJ, and just another great example of, you know, when you identify these very strong trends, well, you’ve got a very clear road map on how to make the most of those trading opportunities. So we see this blue line gets above the black line, of course a period where we get this conflict, where yes, the overall trend is up, but expect weakness over these subsequent 48-hour periods. But once we get through that weakness, you have a very clear road map of momentum and strength.
And so with that, of course, you have those daily, every single evening at 6 p.m., getting those predicted highs and lows for the next trading day. So you’re getting these about 6 p.m. the night before the market opens, of course, at 9:30 the next day. And we see here overall, let’s see, one, two, three, maybe four, five, six, seven, eight, about nine entries as this market continues on in the uptrend. And this has been a very strong rally.
So we see shares of CCJ, a lot of these nuclear and uranium stocks doing quite well. About a 44, 45% rally in just 25 trading days. So really exciting stuff there.
So we’ll go ahead and leave it there for today. But once again, this has been the hot stocks outlook for January 30th, 2026. Thank you all for watching. Best of luck out there, and bye for now.


