



Register for a Free Live Training
The Hot Stocks Outlook uses VantagePoint’s market forecasts that are up to 87.4% accurate, demonstrating how traders can improve their timing and direction. In this week’s video, VantagePoint Software reviews forecasts for Jack Henry and Associates ($JKHY), Regeneron Pharmaceuticals ($REGN), Xenon Pharmaceuticals ($XENE), TJX Companies ($TJX), Waystar ($WAY)
Hello again traders and welcome back to the Hot Stocks Outlook for July 10th, 2026.
I hope you all have had a excellent week out there in the financial markets and as always we are here to take a look at the most recent Vantage Point AI predictive forecast.
So, if you haven’t already, be sure to go ahead and click the link down in the description below and you can get signed up for a live demonstration and learn the specifics about how all of these predictive tools and artificial intelligence technologies are helping traders make much better trading decisions out in the marketplace. and so I thought it’d be good to go ahead and revisit
Jack Henry and Associates ($JKHY)
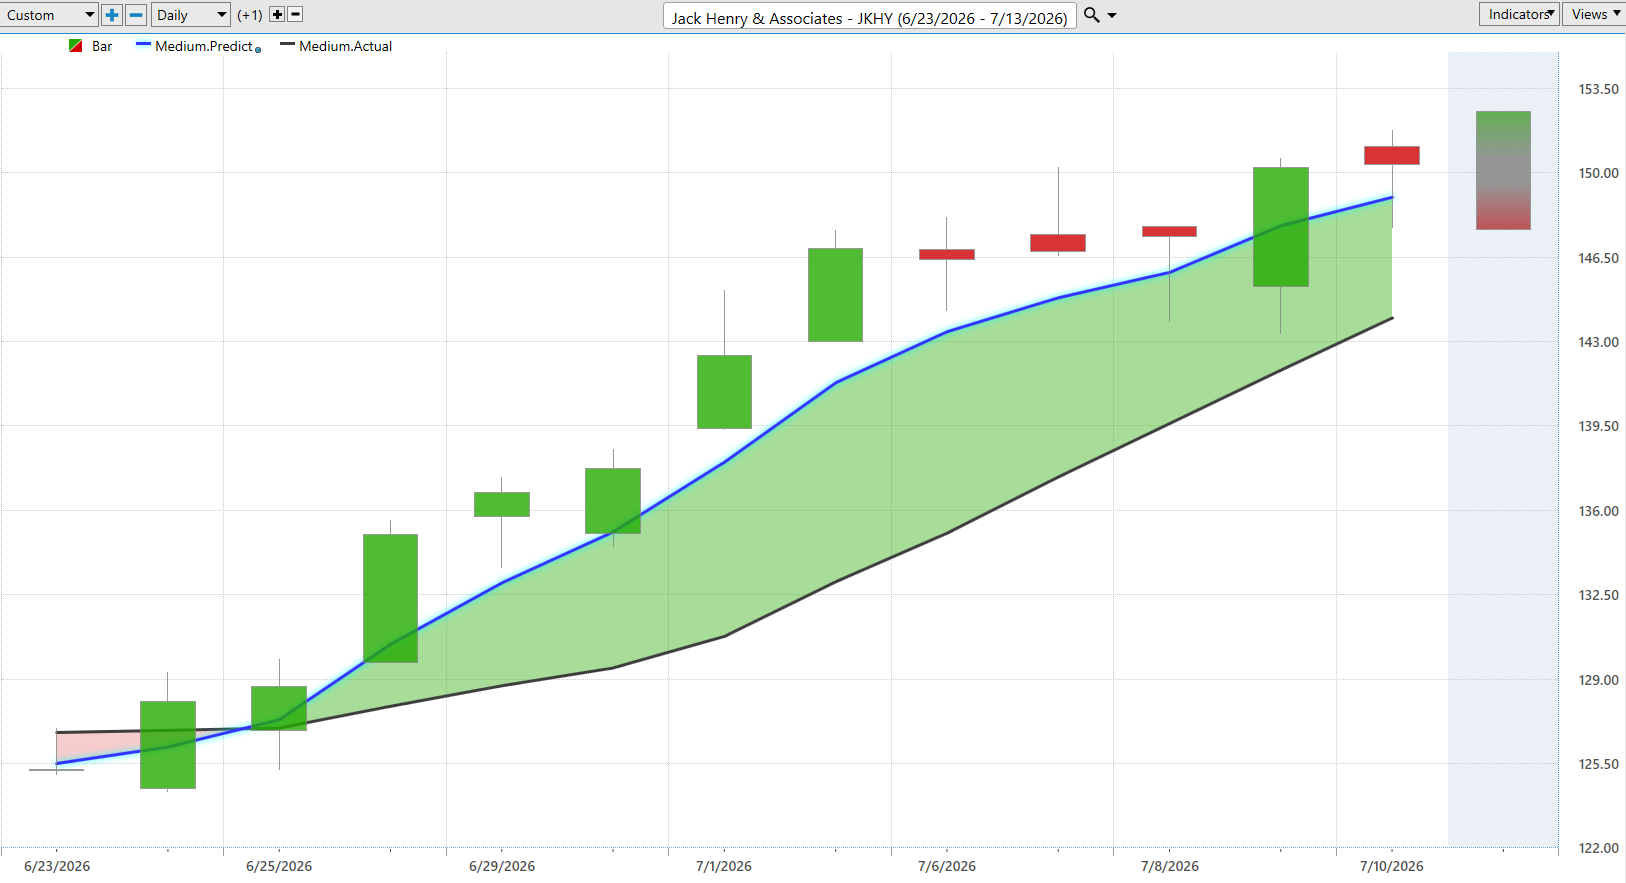
Jack Henry, which we looked at last week because it’s a great example of how all of these predictive tools work together and also how they adapt as we move forward through time. And so what we’re looking at is daily price actions. That means each one of these candles that you’re seeing on the chart, well, that would represent a full and complete trading day. and you’ll notice that right up against those daily bars and candles, we have a black line, but also a blue line value.
And so what the black line is there is actually a simple moving average. Now this is what we might call traditional technical analysis and that all the data to generate a value like this comes from the past and therefore has no predictive capability really just continues to summarize what’s already occurred in the market. But obviously traders want to be ahead of that next move in the market. And so vantage point traders are able to utilize this blue line value.
And for this number for that to get calculated and plotted on the chart every evening. Well, this is where that technology of artificial neural networks come into play. And what they’re doing is performing what we would call intermarket analysis. And what that means is that rather than just looking at the past price of a single asset and really just lagging forward and and reconstructing that data, what Vantage Point’s technology is doing is looking at dozens of other markets that are known to drive and influence the future price of this what we might call the target market.
Now the data that’s going to be used to generate those accurate predictions are things like other individual stocks. it’s also going to be ETF groups which obviously wrap up entire sectors and groupings of stocks throughout the marketplace. But it really takes this global and that it looks at things like global interest rates, the value of currencies like the value of the dollar index. and even potentially major commodity markets, especially when they’re very tied in and correlated to that target market in question.
but again it’s looking at dozens of these markets to generate highly accurate predictions on what is likely to occur next in the market. and so whenever we see that blue line in this case cross above or below the black line in this case above well that’s suggesting that these average prices are going to start moving higher and traders can utilize that information whether they be a shorterterm trader or longer term swing or position trader. but we see here that this market is up about 18% in just the past 10 trading days. So, very interesting stuff here as far as the overall trend.
But why I wanted to bring in Jack Henry is well, we looked at this last week and this is where Vantage Point’s shorter term indicators like this bar at the bottom of the chart and also this predicted trading range that Vantage Point provides can help traders navigate and adjust their position over time. And so, what you see at the bottom of the chart here is what’s called the Vantage Point predicted neural index. and it’s getting updated every single trading day and forecasting short-term strength or weakness in the market just over the next 48 hour period or what you can think of as really a couple of candles at a time moving forward. And again, that’s getting updated every single trading day in addition to an intraday predicted high and predicted low levels that really get down to the very specifics of where price is likely to trade.
And so what we do each week is we look back at how accurate are all of these predictions before the trading day. So if we go back four trading days ago, so this would have been last Thursday because the market was closed on Friday. but here we have Monday, Tuesday, Wednesday, Thursday. and now we’ll get Friday and we’ll get the actual market data filling in against those predictions.
But we see how this works. As the market starts its trend, we move down to this predicted low. You notice that this predicted range is moving higher in addition to the neural index being bullish. and it offers up these levels so that traders can make much better trading decisions.
Again, whether they’re a shorterterm day trader or a swing or position trader. and we see as the market has rallied there about 18% over 10 trading days. There’s been these numerous opportunities to accumulate a position. We see from that predicted low, you’re actually up about 19.25% over those past 10 trading days.
So really interesting stuff here. And even just this week again we can look at even yesterday we would have moved down to the predicted low traded higher. So another 3% rally just in a single trading day. So very interesting stuff going on here in some of the software space and we see a lot of distance again between that predicted moving average and the actual moving average here.
The neural index very bullish as well. pharmaceutical stocks have also done well.
Regeneron Pharmaceuticals ($REGN)
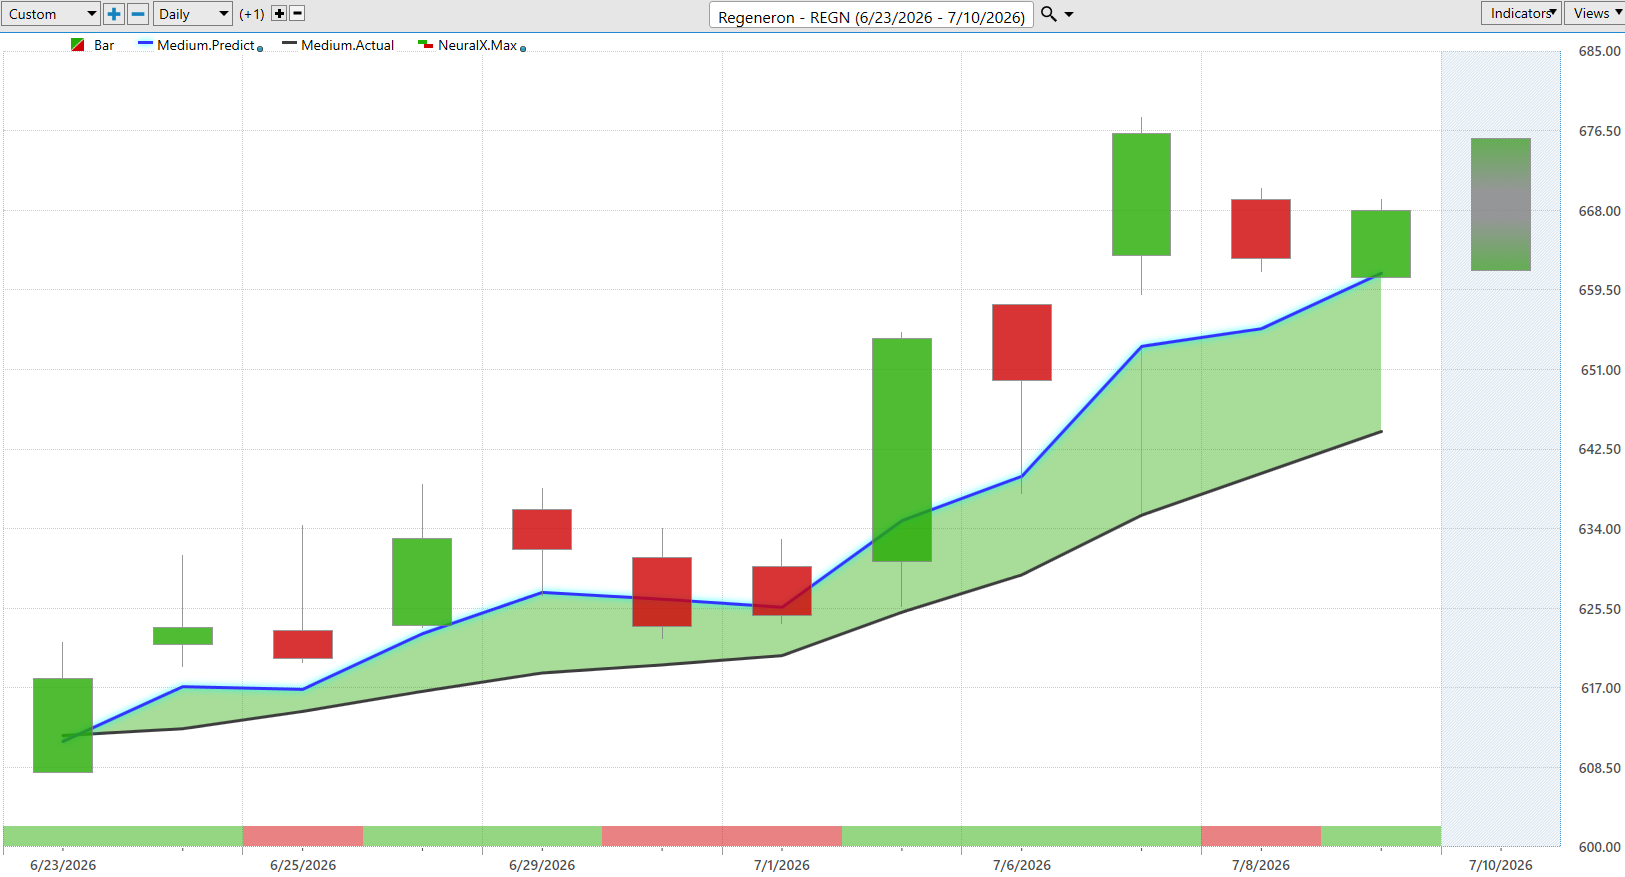
Here’s Regeneron Pharmaceuticals. and we see a little bit more chippy price action as the market runs sideways. But you’ll notice that the neural index goes bearish here, goes bearish here, and you’re getting that couple days of sideways price action and weakness, but the overall trend is still very bullish. and so we can look at those vantage point predicted highs and lows.
You really see how it offers up these levels down towards the lower part of the range so traders can make those better trading decisions. And so even a stock that you see it’s a little gappy here, right? You got to gap up this trading day. obviously gap up this trading day.
but overall the trend very much bullish here. and the market does a good job as far as predicting where those daily levels are likely to be. So we see about a 7% rally here just in the last 11 trading days. And again a space that’s performing very strongly here.
Xenon Pharmaceuticals ($XENE)
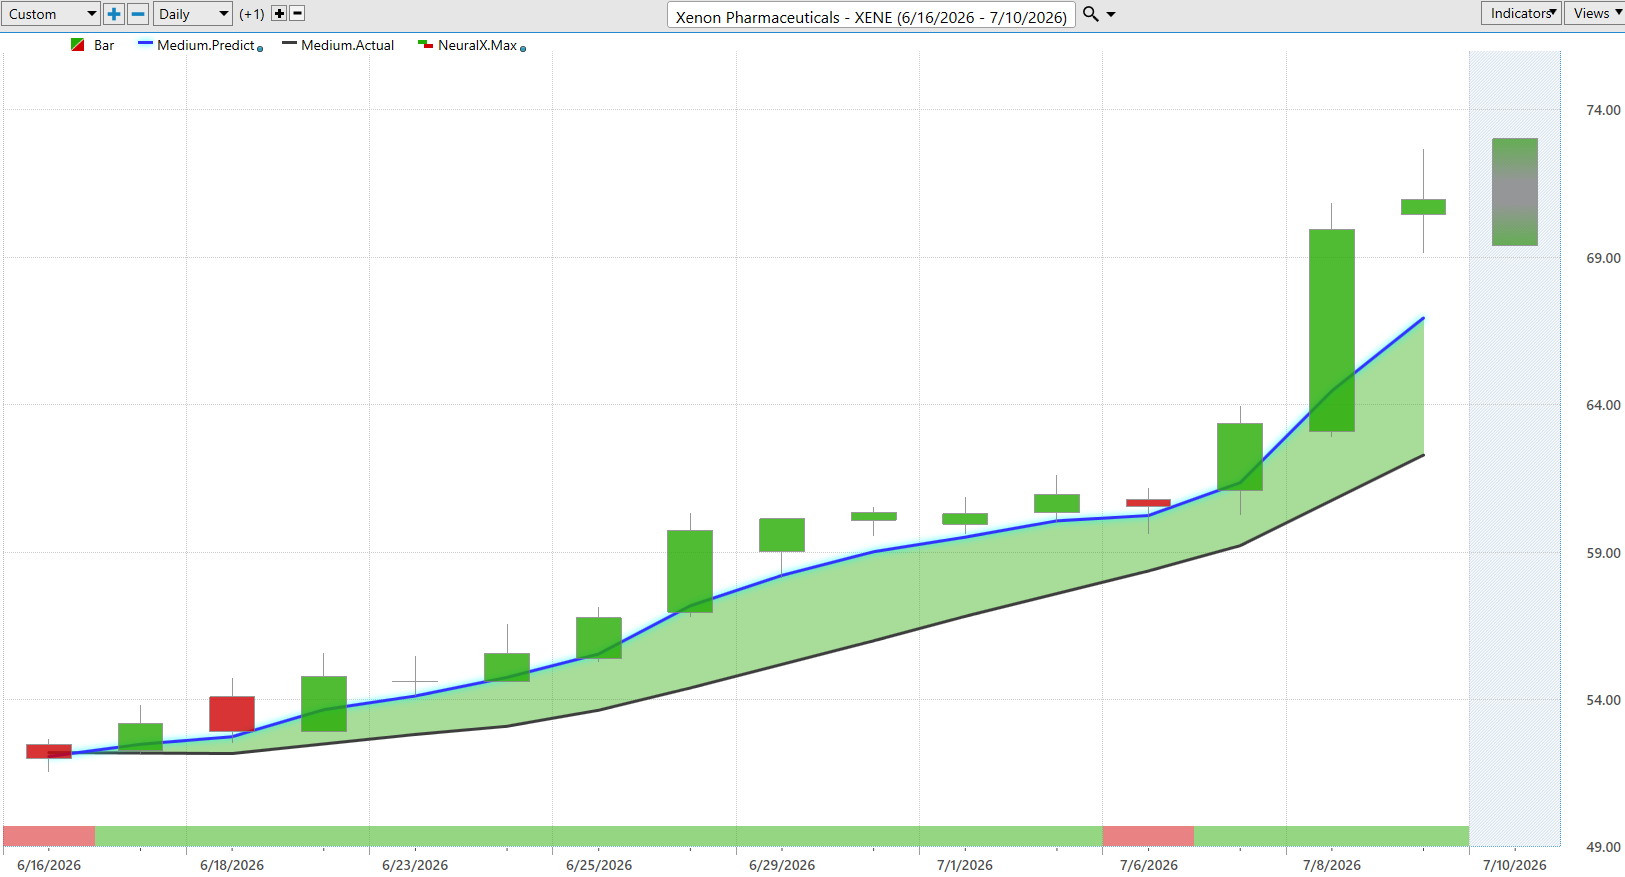
Here’s Xenon Pharmaceuticals. So exact same approach that blue line getting above the black line. Notice the neural index very bullish throughout the duration here of this move. We have one day where it goes bearish.
And this is really where this indicator has a very high level of accuracy of upwards of 86 87% across a very wide range of markets. And that’s accurate whether there’s a Fed announcement, earnings report, conflict in the Middle East, all of these things are going to occur, but we still have a very high level of accuracy regardless of these global market conditions here. About a 33% rally up over the last 15 trading days. So very strong move again in the pharmaceutical space.
but there is some weakness out there. And this is where Vantage Point can not only steer you to those very bullish opportunities, but also warn you of hey, when a market is in a downtrend, there’s no sense in trying to trade that market unless you wanted to short and take profits on shorts and and hedge the overall portfolio here with a mix of bullish and bearish positions.
TJX Companies ($TJX)
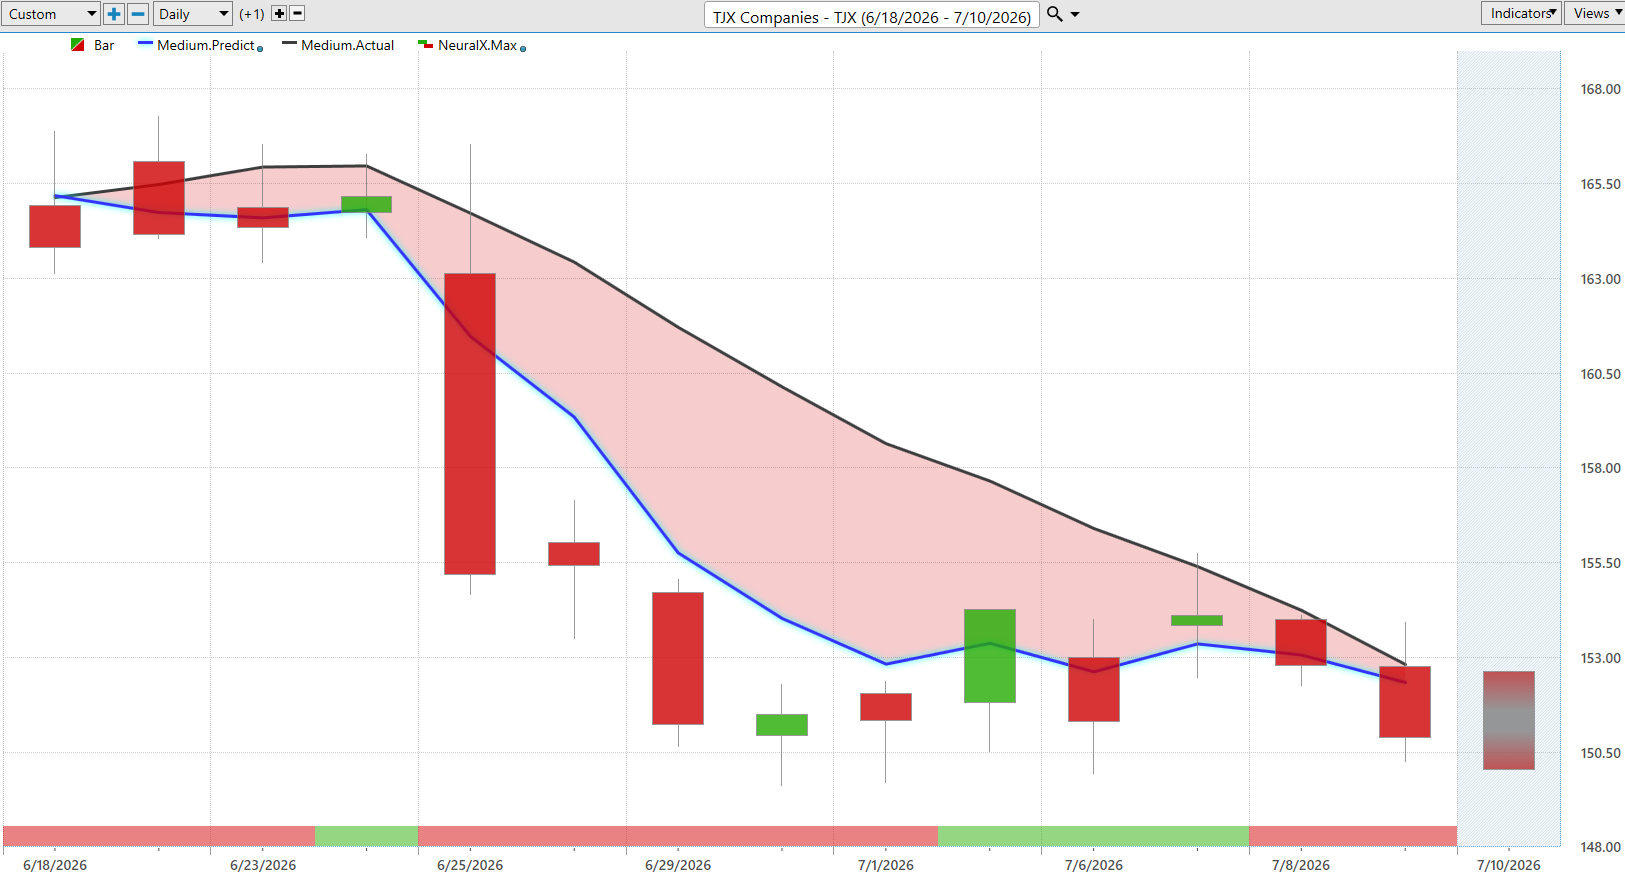
But here we see TJX. we see that blue line getting below the black line and again we have that road map for traders that is going to pinpoint these daily levels before the next trading day occurs. so you see we get a huge decline here as the predictive moving average gets bearish here moving up towards these predicted highs act as very good levels if one wanted to take any positions in this market. and again you see here how the market moves up towards these predicted highs but the overall trend here is still very bearish.
And the market continues to go lower. So really helps you understand that okay well currently the you know kind of discount retail space not a great place to be market down about 8 1.5% over the past 13 trading days but there are again these bright spots where markets are in uptrends. and so lastly we’ll go ahead and end here on
Waystar ($WAY)
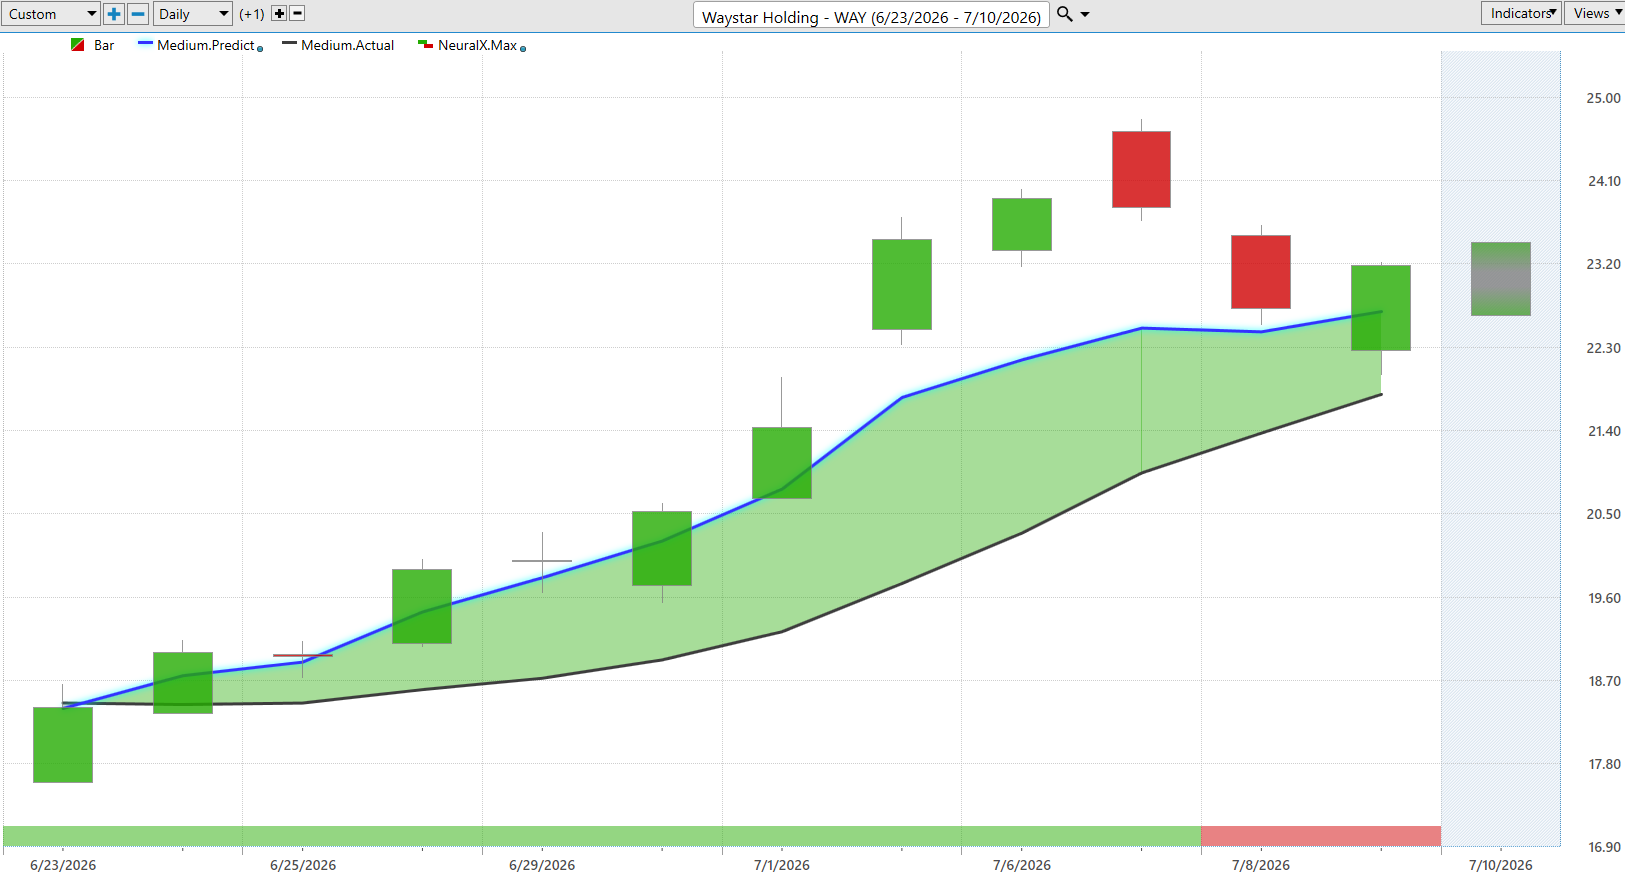
Waystar holdings. This is another opportunity we looked at last week. And again, very clearly that blue line getting above the black line. And you notice that the neural index goes bearish here.
And you see how the next trading day, you’re getting that gap down over the next trading day, but very clearly the market is still in a strong uptrend. So when you have these moves that are really accelerating, you can get that increase in volatility, but this is where this predicted moving average does a good job of always looking forward and maintaining that sort of skew, right? So, when those inner markets are really pushing and driving a market higher, you’re likely to get more bullish signals out of these predictive indicators. and again, we see this market up now over about 23 24% just over the last 11 trading days.
So, very strong move here in many of these software companies and pharmaceutical space. So, we’ll see how things shift around here. again, there’s a lot of markets financials doing fairly well here. So, we’ll go ahead and revisit some of these markets in next week’s video. But once again, this has been the Hot Stocks Outlook for July 10th, 2026. Thank you all for watching. Best of luck out there, and bye for now.