


Register for a Free Live Training
The Hot Stocks Outlook uses VantagePoint’s market forecasts that are up to 87.4% accurate, demonstrating how traders can improve their timing and direction. In this week’s video, VantagePoint Software reviews forecasts for American Express ($AXP), Jack Henry and Associates ($JKHY), GE Aerospace ($GE), Waystar Holding ($WAY), Progressive ($PGR), Thomson Reuters ($TRI)
Hello again, traders, and welcome back to the Hot Stocks Outlook for July 3rd, 2026. I hope you all have had an excellent week out there in the financial markets. Getting a little rest with the stock market closed on Friday going into the weekend. But always a really great opportunity to take a look at the most recent VantagePoint AI predictive forecast.
So, if you haven’t already, be sure to go ahead and click the link down in the description below and get signed up for a live demonstration. You can learn all the specifics about how these predictive indicators and artificial intelligence technology are helping traders make much better trading decisions out in the marketplace. A really great example of how all of these predictive tools work is American Express (AXP).
American Express ($AXP)
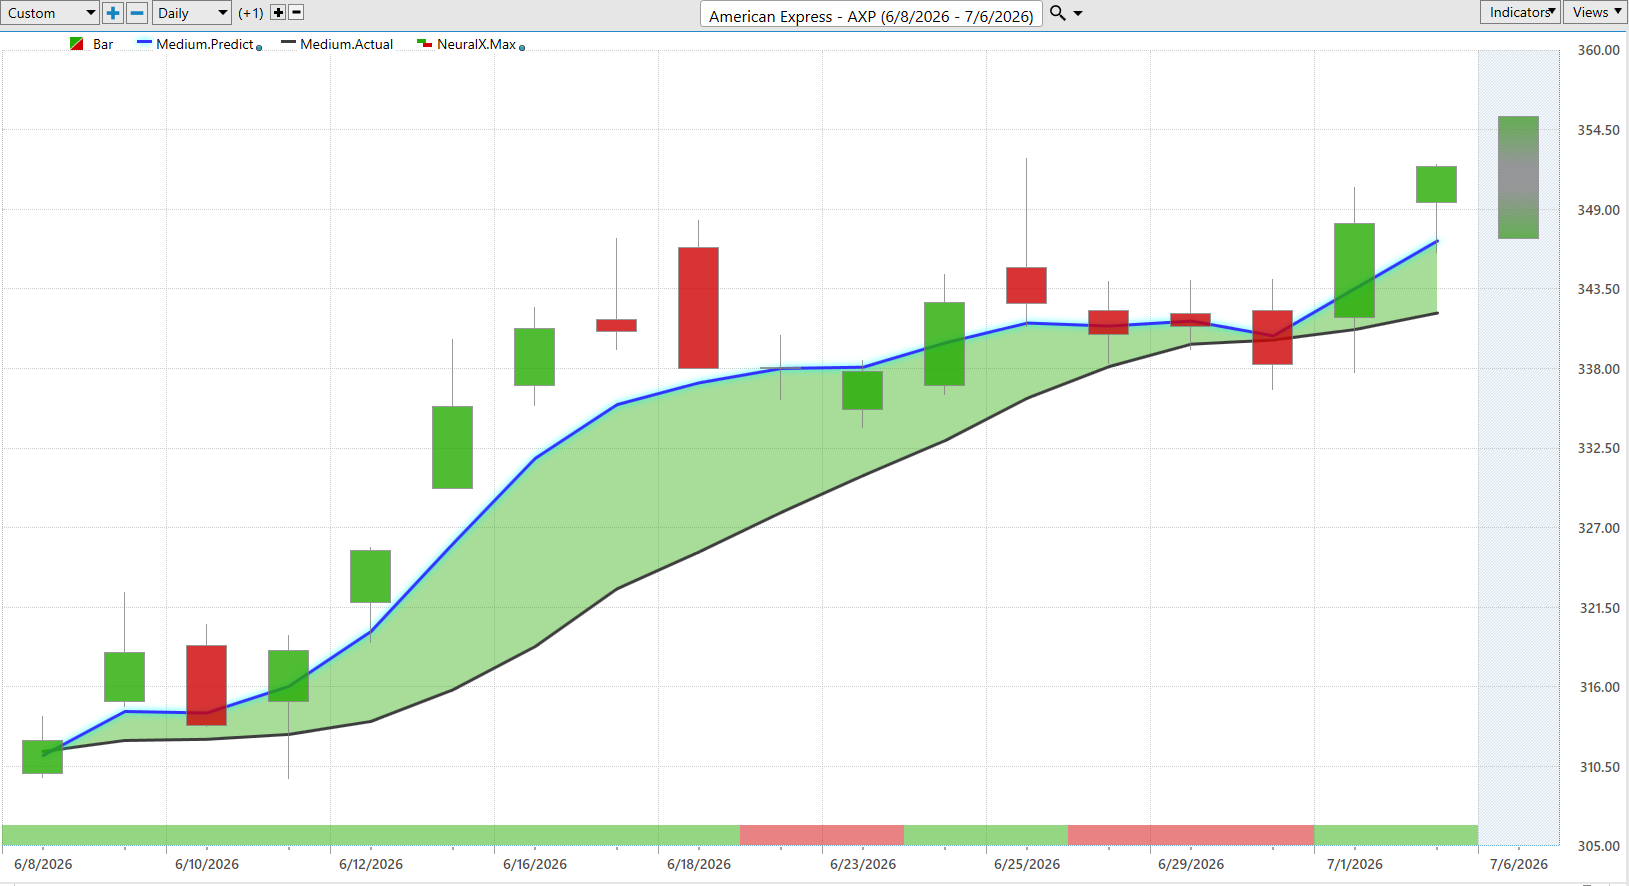
We’re seeing a lot of actual weakness around many of those large hardware manufacturers, the broader QQQ, the SPY, and the broader indices. But there are also some very bright spots spread throughout the marketplace. One of those is American Express, Visa, and Mastercard. What we have here are daily bars and candles, where each one of these candles represents a full and complete trading day.
It’s right up against all that price data that we’re first going to notice there is a black line and also a blue line value. What the black line is, is a simple moving average, or what we refer to as the actual simple moving average. This is a 10-period moving average, meaning it simply looks back at the previous 10 closed prices, adds them all together, and then divides by that number. Traditional technical analysis like this has a lot of weaknesses because all the data used to generate these values comes from the past.
So it’s really just lagging and reconfiguring what’s already occurred in the marketplace. Obviously, traders want to be ahead of that next move and know where prices are headed next. VantagePoint traders are provided the VantagePoint predictive moving average. This is a forward-looking prediction of where average prices are moving in the future.
To generate this value, essentially this price gets calculated and plotted on the chart every evening for the trader. This is where the technology of artificial neural networks comes into play, performing what we would call intermarket analysis to generate those future price predictions. How it does that is by looking at dozens of other markets that are known to drive and influence future prices.
These can be ETF groups or individual stocks. What’s important to understand is that some of the data may represent leading relationships, lagging relationships, inverse correlations, or positive correlations. That’s what neural networks are very good at doing, taking in all of this data from related markets and using that data set to provide very accurate predictions of where price is headed next.
Outside of the ETF and individual stock space, it’s even going to look at things like global currencies, global interest rates, and even global commodities where applicable. It really takes this global approach in generating these highly accurate predictions. Whenever that blue line crosses above the black line, it’s suggesting that these average prices are going to start moving higher, and traders, based on their overall trading strategy, whether short-term or long-term, can utilize that information.
We see that since that blue line got above the black line, and since that prediction came through, we’ve experienced about an 11.7%, almost 12%, rally over the past 17 trading days in shares of AXP. What’s interesting is that we have tools within VantagePoint, like the VantagePoint IntelliScan, which will actually alert you when these crossovers are occurring. We can identify these broad areas of the market that are performing well, even when the index itself can be a little confusing because it appears that stocks are generally going down.
There are a lot of really nice opportunities in different sectors of the marketplace. That’s not the entirety of these predictive tools and indicators, though. You’ll also notice at the very bottom of the chart a bar that can go from green to red and then back to green. This is also updated every single trading day.
So the trader always has this information available at 6:00 p.m. the night before the next market opens at 9:30 a.m. This predictive Neural Index has an extremely high level of accuracy, upwards of 86% to 87% across a very wide number of markets, regardless of earnings reports or Federal Reserve announcements. It predicts short-term strength or weakness over roughly the next 48-hour period, which you can think of as just a couple of candles at a time.
You can see that when the Neural Index turns bearish, we actually get a gap down the very next trading day. Market prices remain fairly subdued, still below the close where that Neural Index first turned bearish. Again, when the Neural Index becomes bearish, we see weakness a couple of trading days later, but as long as that blue line remains above the black line, the overall trend remains up.
In addition to that short-term forecasting that complements the overall trend, VantagePoint also provides an intraday prediction for the daily high and low. This allows traders to utilize these levels to set limit orders or profit targets and better manage the trading opportunity. Each week, we look back and ask just how accurate all of those predictions were against the actual market data.
Because Friday is a market holiday, we’ll receive Monday’s new price data at the beginning of next week. Notice how, once this predicted moving average turned bullish, it provided a roadmap showing traders where to expect prices, allowing them to exploit these shorter-term trading opportunities while maintaining a strong trending position. You can also see several early entries where the Neural Index remained very bullish, with the blue line above the black line.
Look at this period where the market spent a couple of weeks not doing much of anything, yet it still offered numerous buying opportunities near the lower part of the predicted range. On a day like this, you would actually get filled at the open with a limit order. There were roughly five separate entries while the market simply traded sideways at the lower portion of the range. Toward the end of the week, we then saw about a 4% rally from that previous predicted low over just a couple of trading days. So, a really nice opportunity here.
We see this same type of setup across a number of different financial companies, especially Mastercard, Visa, and, in this case, American Express. Now, moving over to the software side of the financial industry…
Jack Henry and Associates ($JKHY)
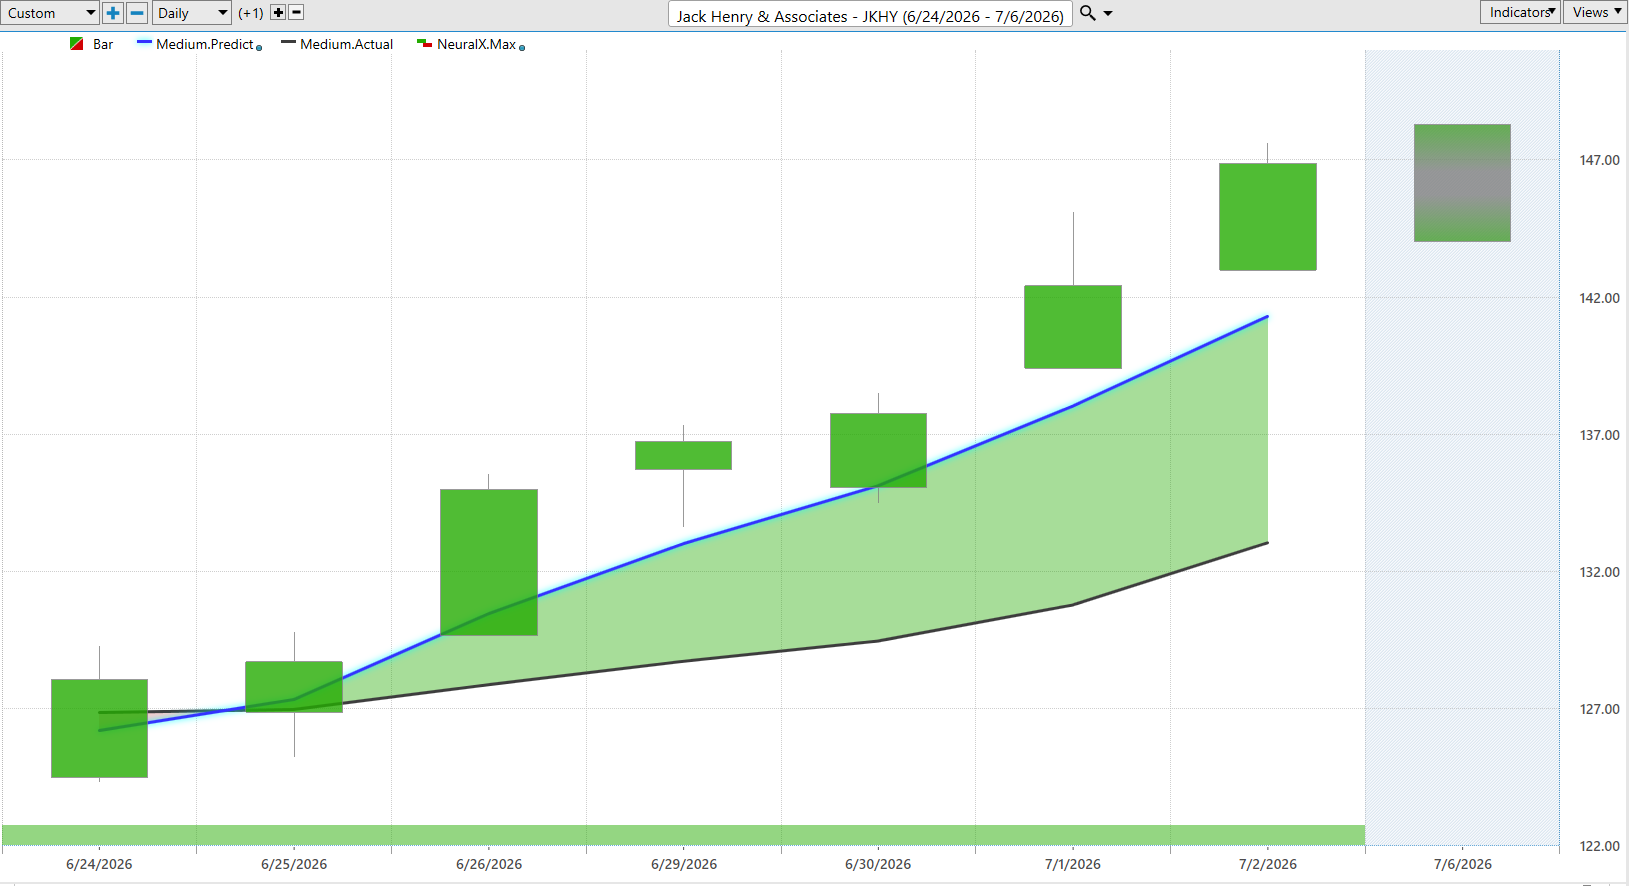
Now, here on the software side of many of these financial institutions and credit unions, we have Jack Henry & Associates. This is interesting because we’ve seen a lot of strength actually developing in software. It does seem like many of the hardware stocks, the ones that have gone up three or four times in just the past few months, are beginning to sell off. Meanwhile, software is starting to emerge after being sold off for months and months and months.
Here we see JKHY with the blue line above the black line. Look at this Neural Index. That’s about as bullish as it gets. It’s letting you know every single day that the Neural Index comes in bullish to expect strength over the next 48-hour period. Of course, we also have those predicted highs and lows getting down to those precise intraday price levels.
You can see early on that the market hits the predicted low, then gaps higher and really starts to accelerate. This is why it’s so important to have these opportunities on your radar, especially heading into the end of the week. We see roughly a 9% rally from those predicted lows over just the past few trading days.
You also tend to see many of these larger market shifts occurring around three-day weekends. Not only are we beginning a new month and a new quarter, but we’re also moving into a three-day holiday weekend. We may see some very interesting price action as the markets reopen next week.
Waystar Holding ($WAY)
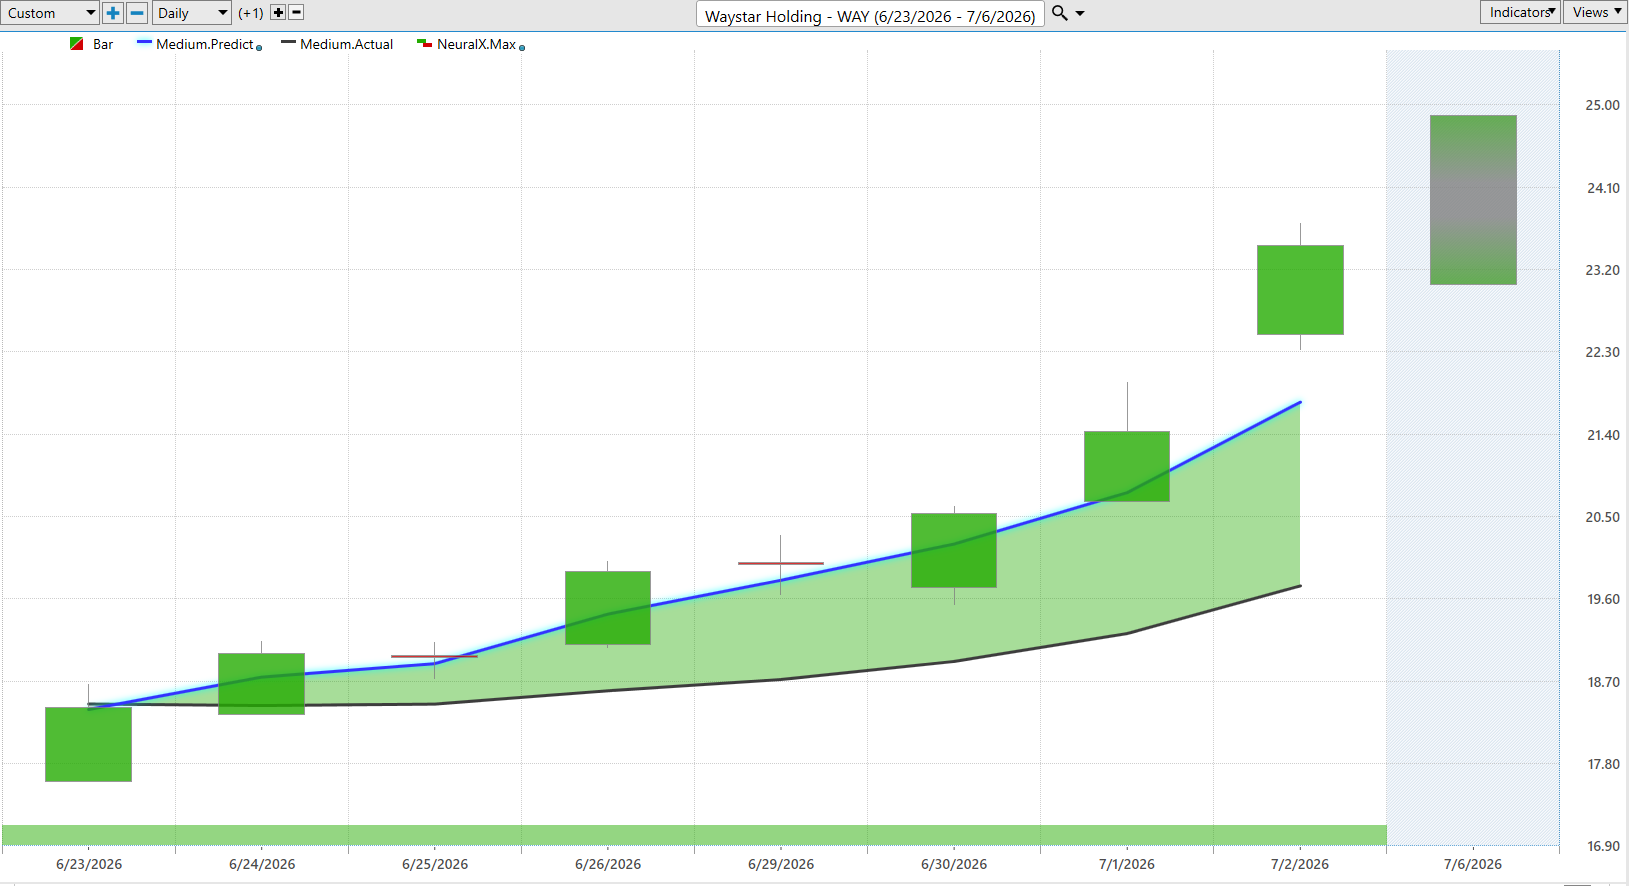
Here’s another software stock, Waystar Holding. Once again, we have the blue line above the black line. Look at all of the strength being provided by the VantagePoint Predictive Neural Index. That is a very good indication that there is substantial strength here. Let’s use those predicted highs and lows to begin accumulating a position.
We don’t quite get down to some of these predicted levels, but we’re very clearly seeing a strong crossover while also recognizing a common theme among these software stocks. The indicators are very clearly telling us it’s time to become involved. We’re also seeing a very strong rally develop over just the past few trading days.
You can even see the predictive candle already plotted for Monday. It suggests there may be continued strength ahead, with a significant amount of separation between the predicted moving average and the actual moving average. From the initial crossover, shares are already higher by about 23%, almost 24%, in only a six-day period.
Progressive ($PGR)
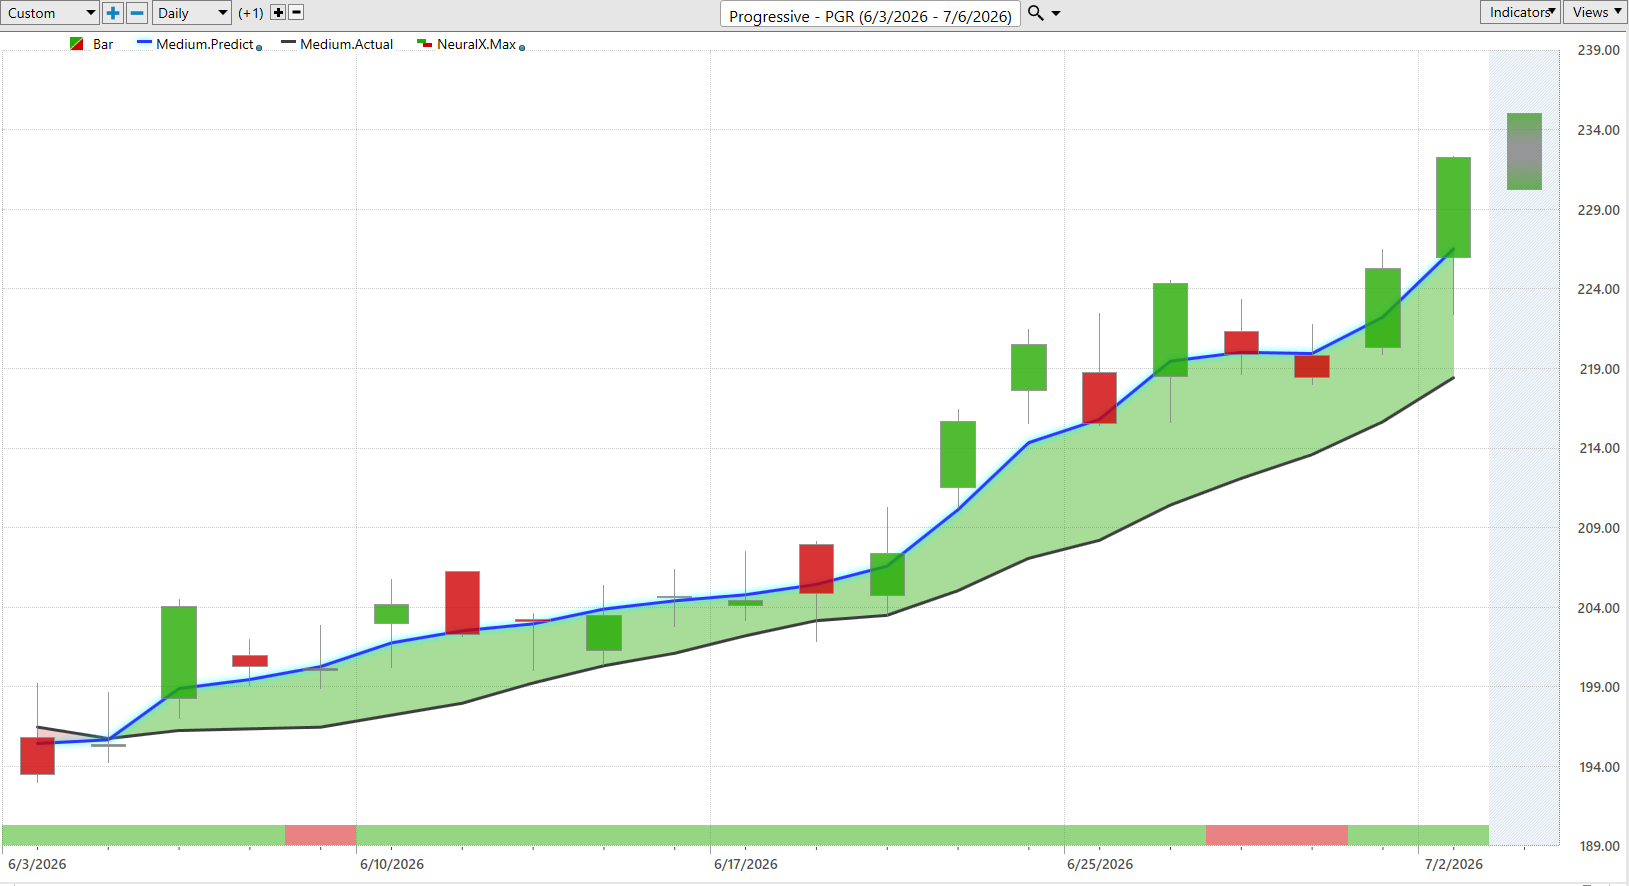
Another area that’s proving interesting right now is insurance. Here we see Progressive getting that blue line crossing above the black line, letting us know this market is now in an uptrend. That immediately suggests taking a closer look at other insurance-related stocks as well.
We’re seeing insurance companies, many banking companies, and a number of related financial businesses performing very well. Once again, we can use the roadmap provided by the VantagePoint predicted highs and lows. We see how this continues to generate numerous buying opportunities near the lower portion of the predicted trading range.
There is even a day-trading opportunity where prices move down to the predicted low before rallying higher. Once again, we’re seeing tremendous strength concentrated within particular sectors of the market. Whether you choose Progressive or another stock in the same industry that better fits your criteria, the overall opportunity is still there.
Over the past 19 trading days, PGR has rallied approximately 17%.
GE Aerospace ($GE)
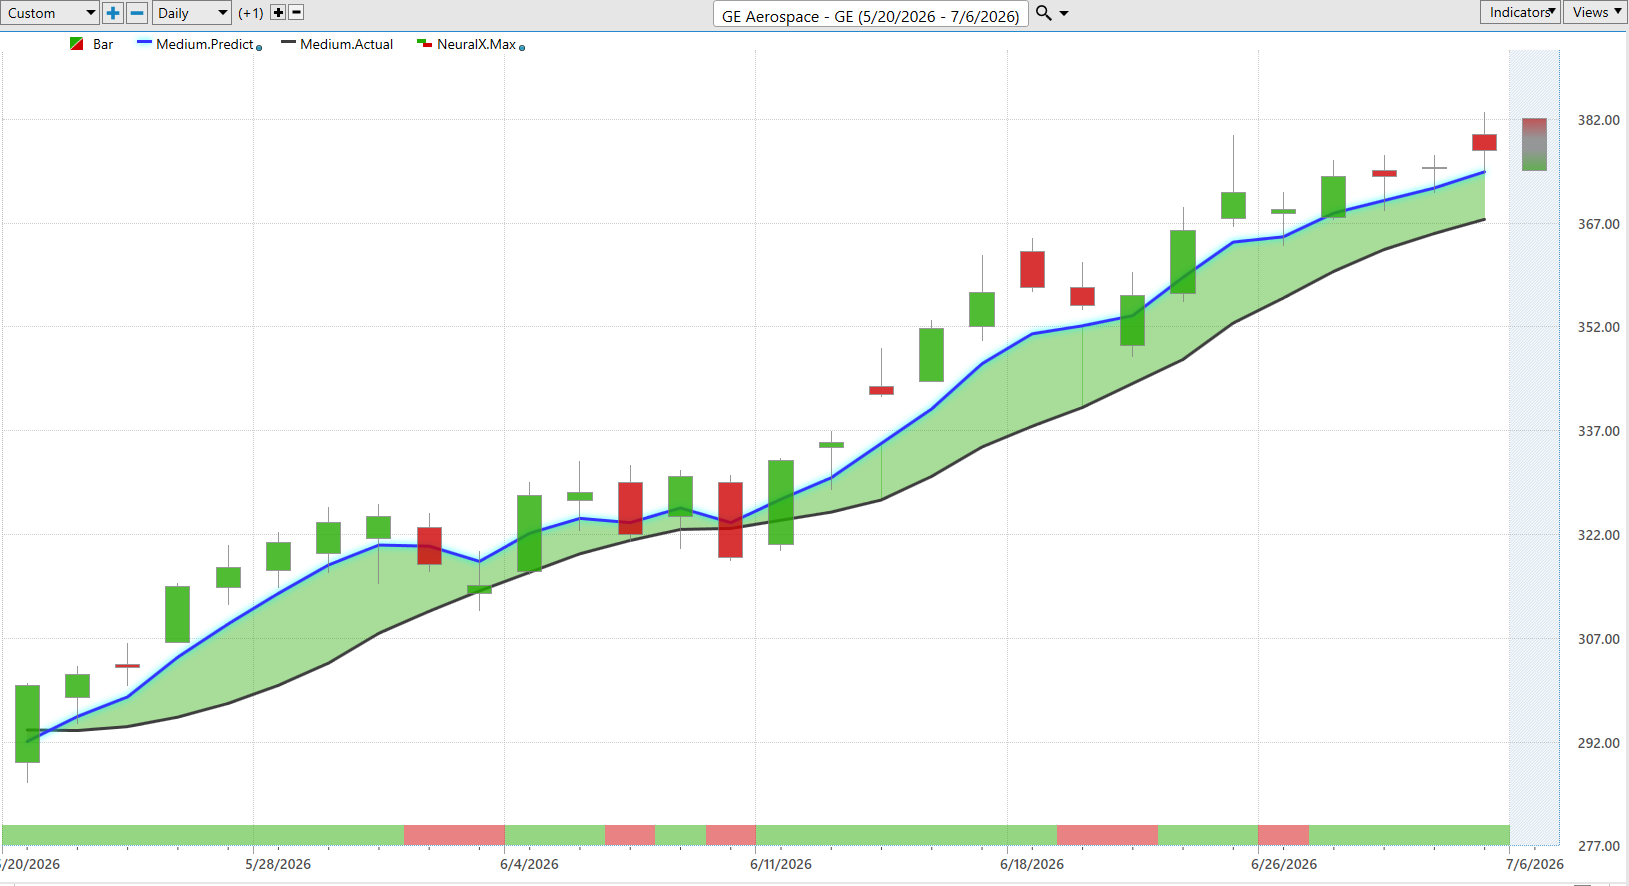
Now here’s GE Aerospace, and this is one of the markets that we’ve been following over the past few weeks. I like to continue bringing these markets back so we can gauge how these predictive tools adapt as time moves forward. The predicted high and low provide a new value every single day, and we also have the Predictive Neural Index updating continuously.
While many markets have experienced sharp selloffs and elevated volatility, the forecast for GE has remained very straightforward. It’s simply saying that if you want to be a buyer, look to buy down toward these predicted lows. You can see exactly how this worked just last week, covering what would have been Tuesday, Wednesday, and Thursday.
Notice the price action on Thursday. Once prices reached those predicted highs, they actually closed right back within that predicted range. Once again, we saw roughly a 2.4% to 4% rally over the course of the week, moving from the predicted low up toward the predicted high.
Thomson Reuters ($TRI)
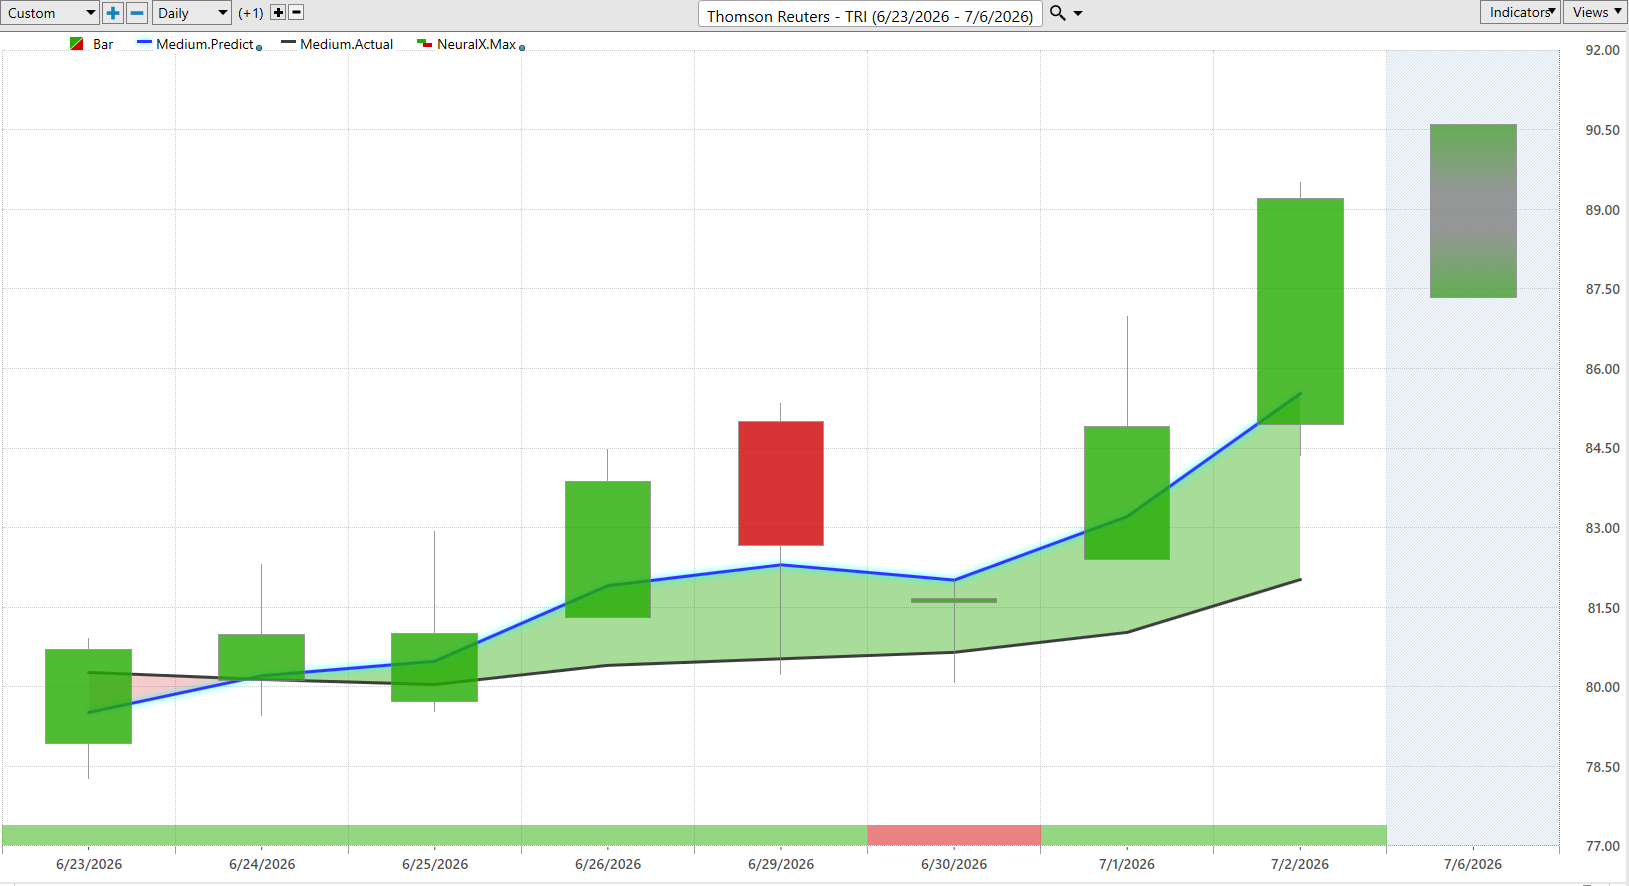
Lastly, let’s take a look at Thomson Reuters. This is another opportunity where we’ve recently seen the blue line cross above the black line, accompanied by a bullish Neural Index. There is one day where the Neural Index briefly turns bearish, yet the market still continues to move higher.
Look at the amount of separation between that predicted moving average and the actual moving average. It’s making it very clear that this market remains in an uptrend. Once again, we have the roadmap provided by VantagePoint through its predicted highs and lows.
You can see how effectively these levels work. Orders placed down at the predicted low get filled, and the market immediately begins trading higher. On another trading day, once prices reached that predicted high, the market sold off slightly. You also see situations where price fills some of these previous predicted low areas where there had been very little selling volume. Rather than continuing lower, the market simply moves straight back up. The following day fills that area before continuing the advance.
Again, moving down toward that predicted low allowed traders to participate in the rally as it continued higher. Similar to many of these software stocks, Thomson Reuters has advanced approximately 10% to nearly 11% over just the past seven trading days.
There are some very interesting opportunities opening up throughout the marketplace. We’ll see how things develop over the long holiday weekend. Once again, this has been our Hot Stocks Outlook for July 3rd, 2026. Thank you all for watching. Best of luck out there, and bye for now.


