Welcome to the Artificial Intelligence Outlook for Forex trading.
VIDEO TRANSCRIPT
Okay. Hello everyone and welcome back. My name is Greg Firman, and this is the Vantage Point AI Market Outlook for the week of April 1st, 2024. To get started this week, we’ll begin by looking at the equity markets.
S&P 500 Index
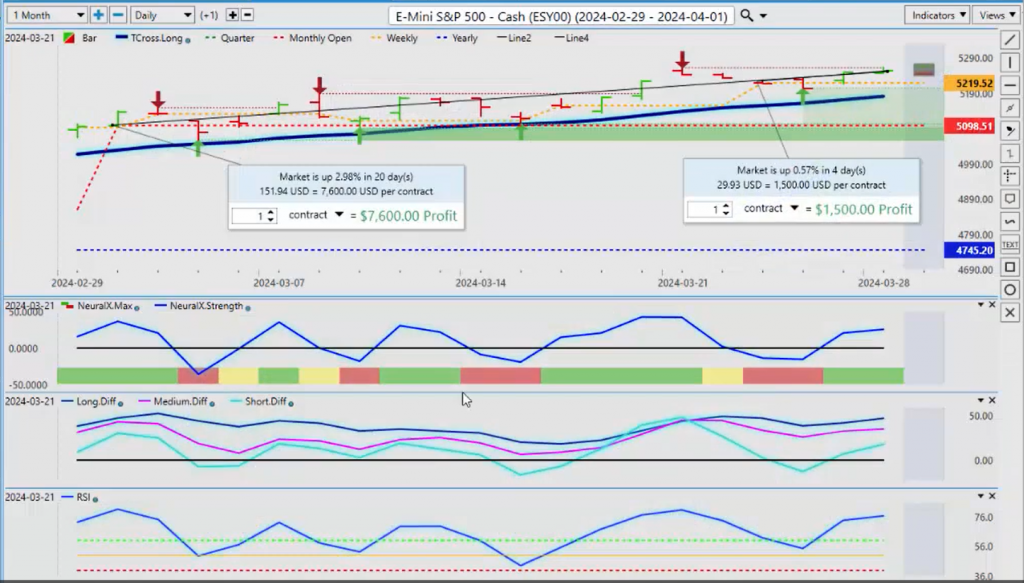
All eyes are on the equities, the Fed, the US dollar, gold prices, Bitcoin—these are the major drivers of all the markets we trade, either directly or indirectly. When we look at the S&P 500, a pretty dismal week, only up 0.57%. We’re up 2.98% on the current month. Now, once again, guys, we want to make sure we’re avoiding that rolling performance model. We want to make sure that we’re looking accurately at the beginning of the month, the end of the month, the beginning of the week, the end of the week, and the start of the calendar year. We don’t want to drag things from 2023 into 2024 unless we’re looking at specific isolated seasonal periods. Now, I will discuss some of those seasonals in this particular presentation, but right now, the S&P 500 not a great week, but it is up. The main indicators from Vantage Point are basically moving sideways, but the key thing I will point out: we have a verified resistance high of 5261. That high was put in place on March 21st, and we are yet to get above that. So, for next week, we want to look to see if we can break through that level. Be very cautious at the beginning of the week on Monday and Tuesday because we’re still in a holiday-short week. The banks and a lot of corporations will be out on Monday, and we’ve got the non-farm payroll number, I believe, on Wednesday, and then the actual payroll number on Friday. So, it will be a choppy week, a very choppy week again as we all try to figure out whether the Fed is going to hike or whether it’s going to cut.
DAX
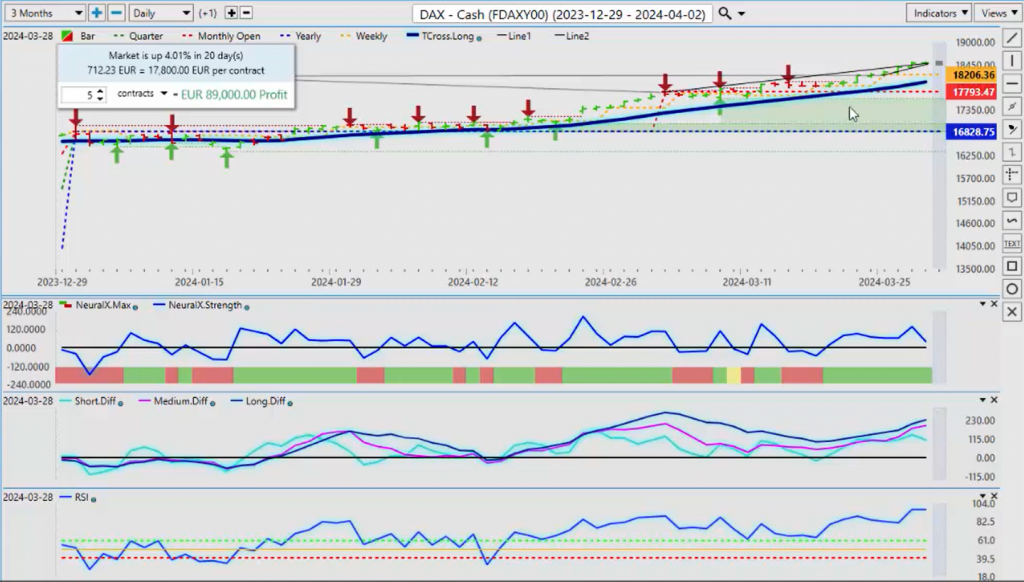
Now, if we look at the European equity markets, they are clearly outperforming the S&P 500. When we look at those a little at a closer standpoint, we can see we’re up 1.52% on the week and we’re up 4% on the month on the DAX. So, the DAX still looking pretty strong as it’s taken out its verified resistance high. So, again, if I’m looking at one of the two indexes, the DAX appears to be the better one for right now, and I believe that’s due to the euro weakness this past week, which I’ll talk about more in a minute. But our key level on the DAX there, we’re coming in at, again, our T cross long, 18,030. We need to stay above that. If we click on our F8, we can see our long predicted, and that’s 18,318. We want to make sure we’re holding above that, and our T cross long, if that still looks good, we have further upside.
Volatility Index ($VIX)
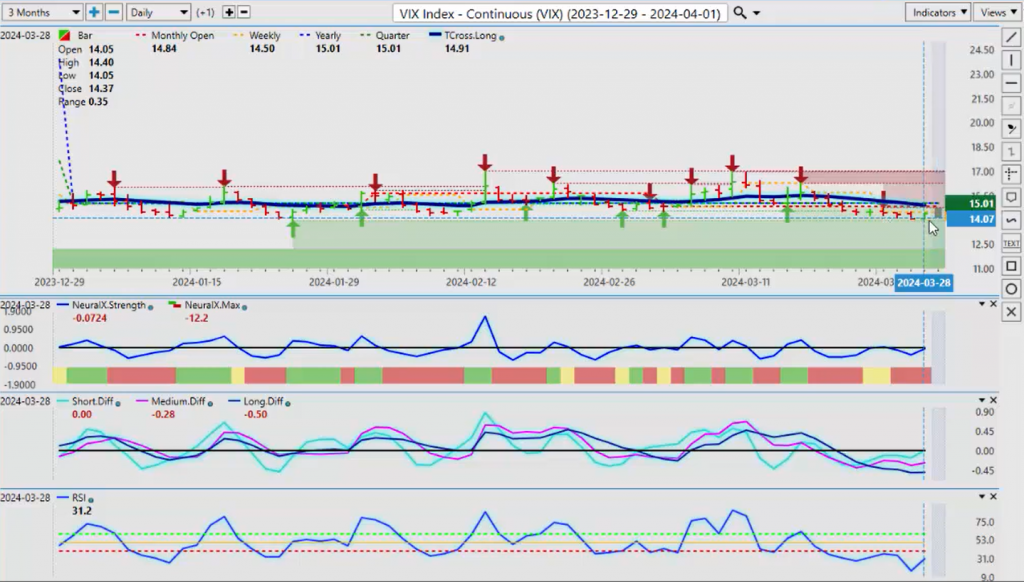
When we look at the VIX, the VIX again is struggling to hold onto any kind of gains here. We’ve got a lot of activity right around the current monthly opening price and the current yearly opening price, that coming in at $15 a share. Now, know our monthly opening price is going to reset at the beginning of the week. So, if we look at the closing price of 14.37, that’s going to be our approximate monthly opening price on the VIX for the month of April. So, keep an eye on that. These indicators in Vantage Point are warning that, again, we’ve got some volatility coming.
Now, when we look at, and I often get this question, how is Vantage Point AI? What is it using? Well, when we look at the actual correlated markets here, the intermarkets in the VantagePoint software, what it does is it takes the correlation of 31 other markets when it’s forecasting the target market. So, I can see these correlations using artificial intelligence on the yearly, the quarterly, and the monthly basis. These, all of these markets drive the VIX, and again, if we look at the DAX 30 for my European friends, the drivers in the DAX use the inner markets is very interesting. We can see the MSCI Germany Index, these are all correlated markets yearly correlations that the AI can separate. Then we have quarterly correlations that again the artificial intelligence can read that, and we can even go down to what are the strongest monthly correlations, and these are all in percentages. So, if I look at the iShares MSCI EFA, that is a 95.27% positive correlation to the **DAX**. So again, all of these things come factor in. We’ve got the Euro with an inverse correlation, the *Dollar Index*, *light sweet crude*, *natural gas*—so these are very interesting things to look at when we’re talking about actual correlations, and we can even isolate it using artificial intelligence down to the top 10 correlated markets and the top 10 inversely correlated markets. Very powerful stuff when using artificial intelligence. It’s not simply a blue line crossing a black line or just the predicted moving average, but those levels are also calculated into this, and that’s why I use it each week to show it to you guys. The neural index, the same thing, uses the correlation of 31 other markets when it’s forecasting its directional bias to give you some insight how the artificial intelligence sees things. So, if we look at that, it helps give the trader a better understanding why the *DAX* is stronger than the S&P 500. It’s because of the correlated markets that drive it, not specific technical indicators, and that’s very important that I think I clarify that for everybody, that we’re not using just standard technical indicators here. It’s the exact opposite, actually.
U.S. Dollar Index
Now, when we look at the dollar going into next week.
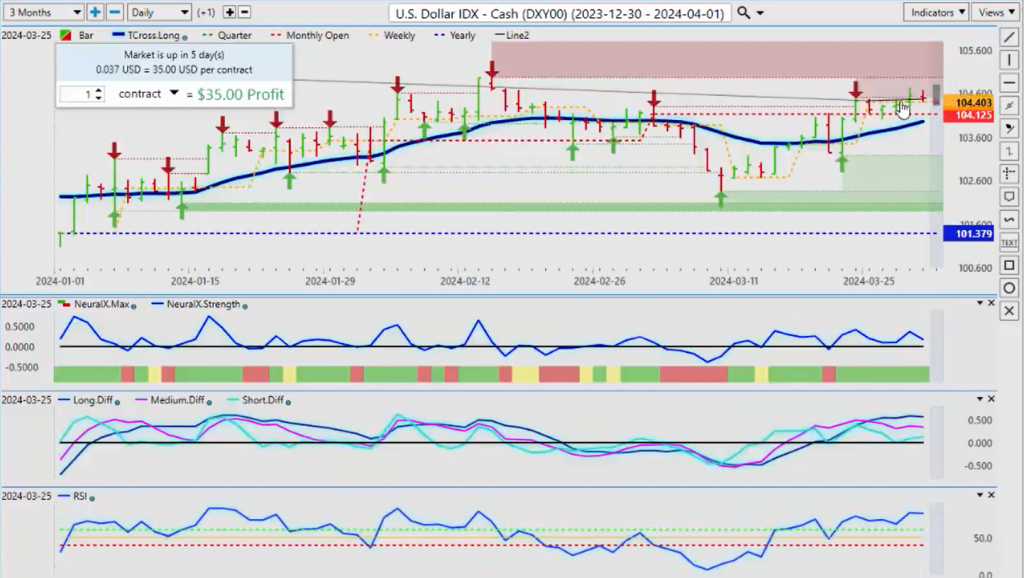
The dollar, we’re in a period of known US dollar strength, and that is always at the beginning of the month. I would argue, right at the very end of the month into the week after the non-farm payroll number, in most cases. So for now, the dollar remains firmly above its yearly opening price and its monthly opening price, but I will warn everybody, the closing price, 104.48, now the dollar needs to maintain that above that level in the month of April. That is not going to be an easy task with a risk of rate cuts, questionable economic data coming out of the US. It’s not black and white bets on the Fed is going to hold, bets on the Fed’s going to cut. All of these things are confusing the living you know what out of people. So, we look to these levels, and right now, the dollar, the monthly opening price will reset on Monday when the software updates. We’ll put the point in time, we’ll put that, that red line, we’ll move up, and we will be able to monitor to see if the dollar can maintain. In most cases, it does not in the month of April.
Gold
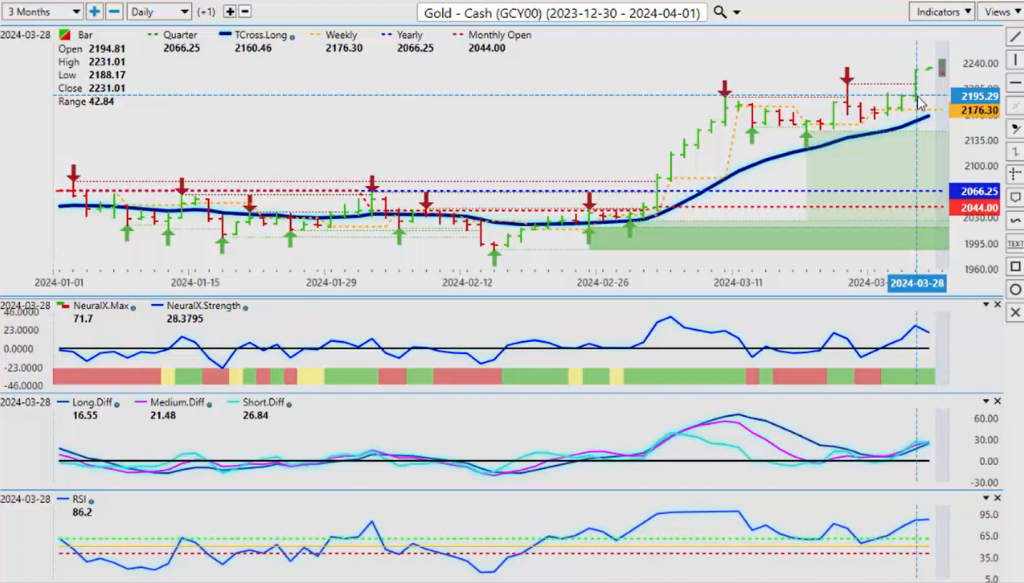
The month of April will go to gold. In most cases, gold has made a big pushup on Thursday. Now, this was before the PCE data, and I’ve often argued that I believe that, in most cases, this data is leaked before the actual announcement, and that would explain why markets are going to be closed on Friday, we get a big spike on gold on the Thursday. So, gold spikes up, but now it has to maintain the level above the verified resistance high at 2210.
We’ve got a structural bias on gold, the monthly at 2044, the yearly at 2066, and again, the quarterly coming in at, or about the same level, 2066. But we’re also going to get a new quarterly opening price this coming week, which is again, one of my favorite times because I like to measure markets from the first quarter, the second quarter, the third quarter, the fourth quarter. Now, again, the fiscal quarter in the US, the fiscal year-end is October 1st, so it’s a little bit mixed on the dollar, but in most cases, the dollar doesn’t fare well in the month of April. It’s gold that usually benefits, but it’s made a big run up in March. Now, we need to hold above that T cross long, 2167. If you click on your F8 on your VP software and use our long predicted, which is our long-term crossover without the black line, 2204, that’s the level we want to keep. That’s the initial level of support that we want to keep our eyes on.
Now, our predicted differences, they’re starting to move higher, but the neural index, again, using the correlation of 31 other markets, it’s pointing down, suggesting the initial move on gold is likely to be to the downside. That this may have been just a bigger push based on leaked data. So, we’ll monitor things, but either way, gold usually does well predominantly into the end of April and then it turns lower. Also, but between the dollar and gold in the month of April, it definitely favors gold, in my respectful opinion.
Light Sweet Crude Oil
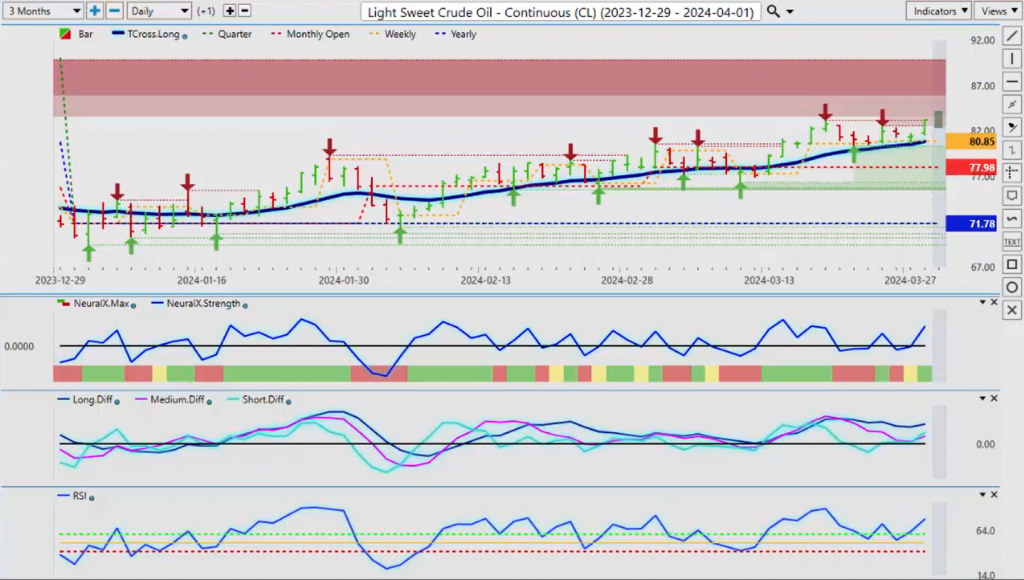
Now, light sweet crude oil, still moving along, but once again, we’re unable to get past this verified resistance high, coming in at 83.12. We need to push above this, but structurally speaking, oil is quite bullish above the yearly, the monthly, the quarterly, and the weekly opening price. So again, we use our T cross long for next week as our main medium to longer-term pivot level, which is 80.78. That’s the level we want to keep our eye on, right there. Make sure we’re holding above that level, and of course, we’re going to get a new monthly opening price here also. So, it’ll be choppy next week, but I think that oil is likely to pull back a little bit before we go into that known seasonal period of strength, which is in May and June. So, a pullback would be healthy, and it doesn’t necessarily mean that oil is in a downtrend. In order for oil to go into a downtrend here.
Guys, we need to break down and turn negative on the calendar year at 7178, and at the very minimum, we’re going to need to hold below the new monthly opening price, which is likely going to be 8317. So, the range we’re going to be dealing with is likely between the 7178 and the 8317 mark.
Bitcoin
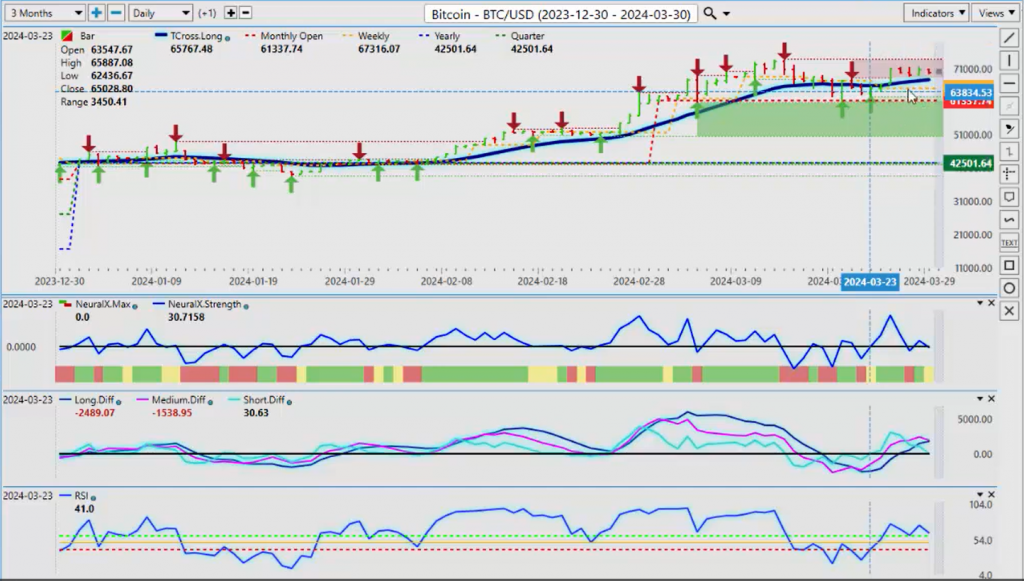
Now, Bitcoin again, easily recovering again off this. Anytime we move down towards the 62,000, the 60,000 mark, we have buyers moving in almost every single time. But, at the beginning of last week, we crossed back over our T cross long. At that time, it was 66,331. Up, we need to push above 73,0662. I believe we can do that once we get past the dollar strength. But as you can see, the reversal indicators in Vantage Point that tell us when a trend is potentially in a bit of trouble—that pink line crossing over the blue line—is telling me I should expect some kind of pullback on Bitcoin this coming week, between Monday and Friday. So, again, nothing has changed with Bitcoin in the overall scheme of things. The yearly opening price, Bitcoin is well up on the year, 42500. So, we’ll continue to monitor this, but expect again some kind of pullback, because if we get a hotter jobs number again, then the market’s going to be spinning their heads again, saying, ‘Okay, well, now the Fed’s not going to cut.’ So, one week we’re cutting, the next week we’re not. Guys, we’ve got to look past this stuff because it’ll drive the best trader on this planet to drink because this Fed is extremely confused, and this data, the economic data, is highly questionable as seasonal adjustments, all these things. So, we’ll keep an eye on it, but for now, Bitcoin should pull back a little bit, at least during the middle part of next week.
Euro versus U.S. Dollar
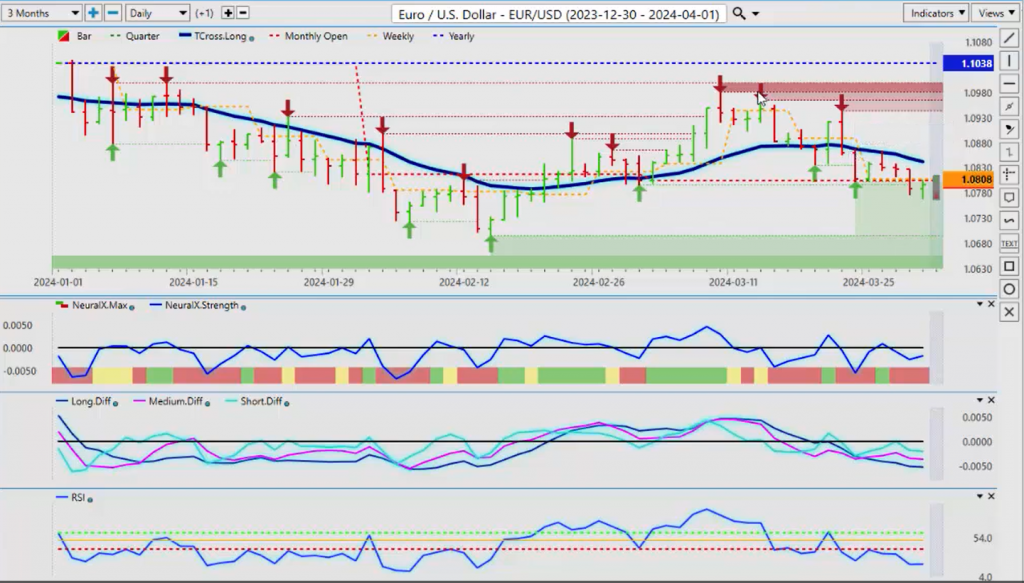
Now, when we look at some of our main Forex pairs, the euro, again, succumbing to that dollar strength, but just remember, guys, the Euro has not been positive on the year, in my respectful opinion. Using the AI correlations that I showed you a few moments ago, the Euro weakness boosts the DAX. So, it’s very similar in the US and other countries: either the currency is strong, or the country or one of the main stock indexes is strong, but not usually both. So, the Euro turning lower has would directly point us to buying the DAX. So, another tip for my European friends: if you see that Euro in trouble, then yes, you want to buy the DAX. If you see that Euro turning higher, well, then you might want to look maybe over towards the S&P because that would tell me the dollar’s weakening, right? And this is the power of intermarket correlations when we use them properly with the kind of anchor points that we should be using, not rolling performance. Again, I will continue to point that out on a weekly basis, that if you’re moving your weekly, monthly, yearly point in time, if you’re moving those goalposts, then it’s going to be very difficult to isolate an entry point because you keep moving the goalpost. So, we don’t want to do that. Right up here, this is the current yearly opening price. I could care less what the Euro did last year. I’m only concerned with 2024. I will, in 2024, look for seasonal patterns of strength and weakness in the Euro. And, actually, in most cases, by mid-April, I’m looking for a stronger Euro. So, keep that in mind if you’re trading the DAX. But right now, the indicators on the Euro remain bearish, and I believe that the Euro will remain bearish until at least the week after the non-farm payroll number.
U.S. Dollar versus Swiss Franc
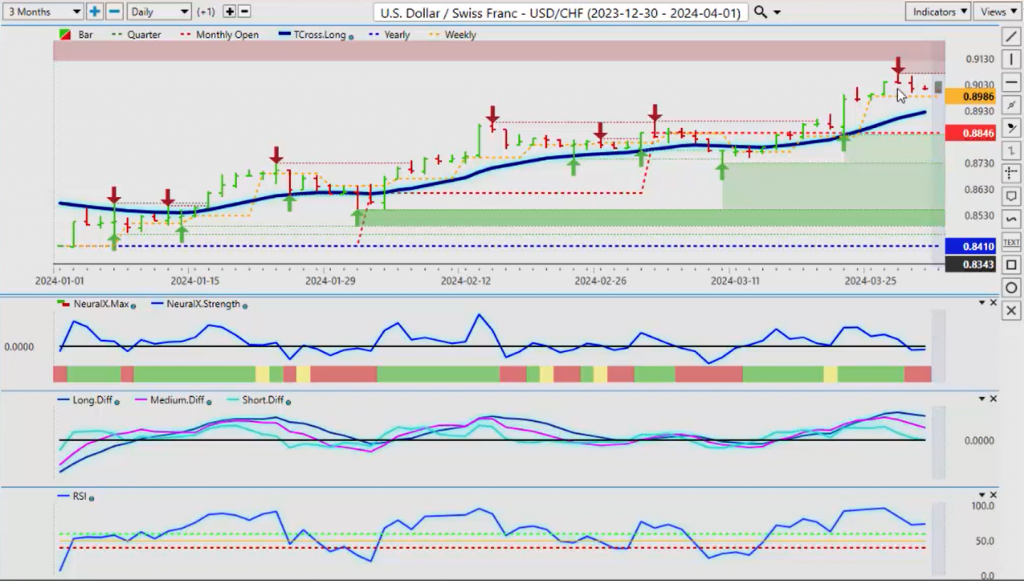
Now, with the US Swiss Franc, again, money is starting to rethink selling the Swiss Franc. We all got caught off guard with the Swiss National Bank hiking the other week, but now that’s done. And as you can see, there hasn’t been a whole lot of follow-through here. It’s still in an uptrend, but these indicators are pointing towards some weakness. If we get into a flight to safety, money will go to the Swiss Franc just as quickly as it will go to gold and the US dollar, and now even Bitcoin. So, I would be looking, if nothing else, to fill this gap in price between the close on Friday at 9016 and our T cross long at 8926. The indicators are pointing down. So, even if we do get some dollar strength, I think I would use it on this pair to set my shorts, anticipating that the dollar will move lower the week after the non-farm payroll number.
British Pound versus U.S. Dollar
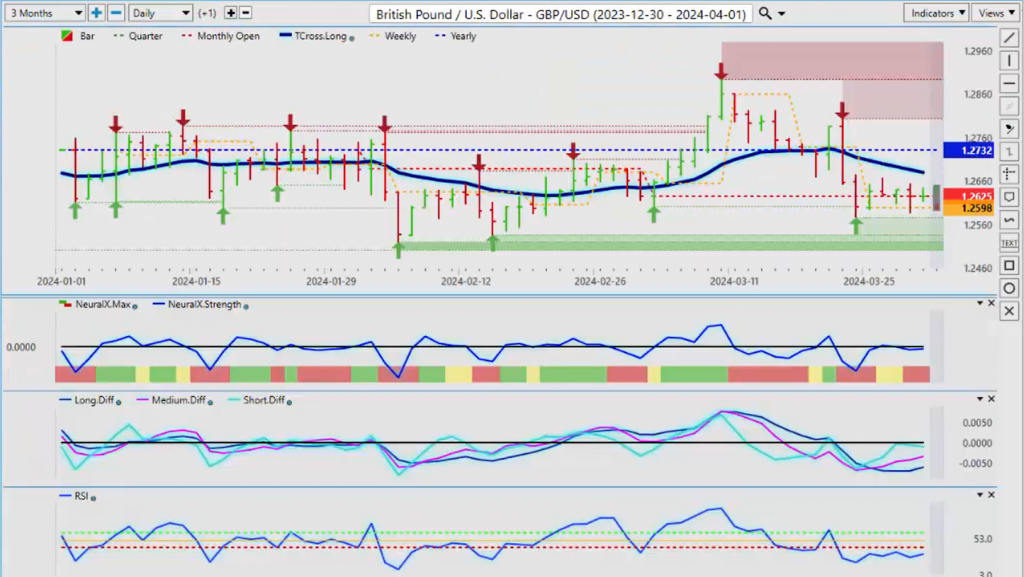
Now, the British Pound/US Dollar, for next week, once again not able to hold above that yearly opening price. We got above it, but I believe we can get back up above that level in mid-April. So, watch your downside. I do have a reversal indicator down here from Vantage Point. The medium-term strength is weakening against the longer-term strength, that is warning of a potential reversal. So, at the very least, I anticipate us to go back to 1.2679. From there, if we can break through that, we can take another run at 1.2732. But using these proper anchor points again, the current monthly opening, the current yearly opening price, very important, guys, because people will tell you that something, that the British Pound right now is bullish—well, it’s not bullish because how could it be if it’s negative, if it’s losing money on the year, then it’s negative, right? So, the first thing we want to do is start, get above the T cross long, so we can at least challenge again this 1.2732, but ultimately, I do believe we will get back up above that yearly opening price.
U.S. Dollar versus Japanese Yen

Now, as we look at the Dollar Yen going into next week, all I can do is warn everybody, be careful or stay away from anything Japan because I can tell you with a degree of certainty, doing this for as many years as I have, the Bank of Japan is on the prowl. They are looking to intervene. They don’t like this level one bit, but at the same time, they’ve got nobody to blame but themselves. Sorry, they verbally intervened, and then the Fed started hiking, and this is what you get—the Yen going from 110 to 151. So, they want this lower, and each week I will warn everybody that I am not a buyer up here at all, because again, if the Bank of Japan steps in, this little bit of intervention they tried the other week blew up in their face. Also, once again, soon as they step in, they just cause problems. So, be careful here. When they intervene, it’s usually after markets, Sunday night, Thursday night, whenever there’s low liquidity in the market, that’s when they tend to go after the intervention. So, be careful, but on a breakdown of our T cross long at 150.25, I believe we will have shorts here. The indicators in Vantage Point, this MA diff cross that has taken place over here, that was five, six trading sessions ago, Vantage Point is giving us a 5-day warning that this is getting ready to move lower. And when you layer in the 80% probability of the Bank of Japan intervening, that makes longs very unattractive up here. But again, anything is possible, just be very, very cautious buying this pair up here. I respectfully submit I would be looking for a retracement this calendar year back down to the 141 area. That’s a heck of a trade if that comes to fruition.
U.S. Dollar versus Canadian Dollar
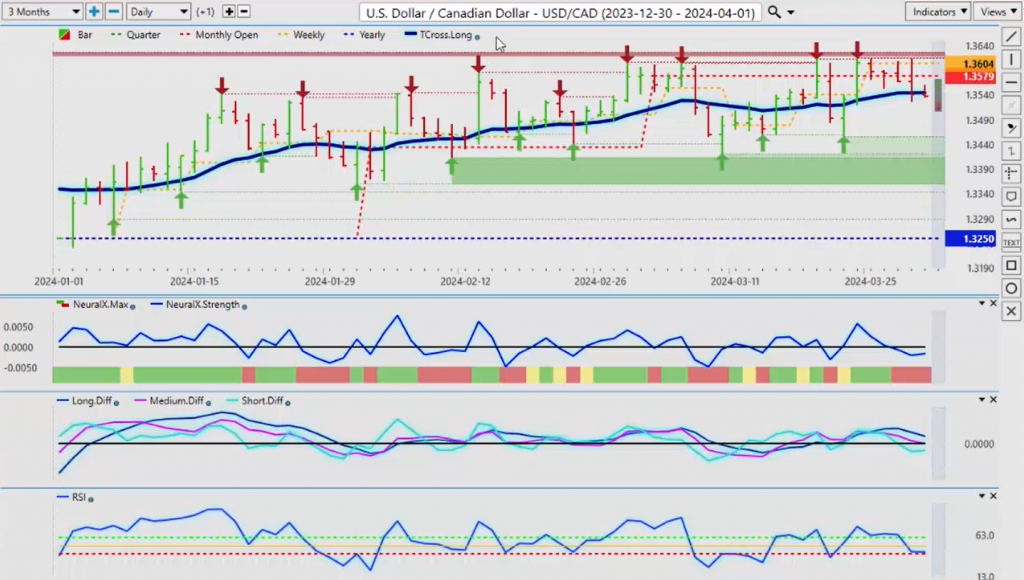
Now, if we look at US/Canada, once again, we can visually look at our chart up here and see a massive wall of resistance that’s forming up on this pair in this 1.3614 over the last three months. Now, again, the Canadian dollar does usually strengthen towards the end of
April, May, and June on higher oil prices, but I believe the Bank of Canada is also going to be one that is going to be cutting rates before the Fed. But we’ve closed below our T cross long, 1.3545, so it does suggest that it’s possible we could be starting to move back down towards our current yearly opening price, but I think next week would be premature. The week after, I think we can look at that. The indicators in Vantage Point do support shorts here, our MA diff cross, the predicted RSI 42.7. Now, the 60/40 split, we’re looking for a break of the 40 level for this to build more momentum onto the downside. If we can break down below that 40 level, then we should see this pair at least move back towards our most recent verified support low, and that would be 1.3456. We break that, then we go to our next one, that’s 1.3420. We break 1.3420, guys, we’ve got an open ticket down to 1.3250. That’s ultimately, I believe, what we’re looking for in 2024. It may be a little bit slow getting there, but I’m confident we will get there. The only thing that could derail that is an election in Canada, which is also entirely possible because the carbon tax war is heating up. So, we’ll keep an eye on these things, but for now, slight bias to the downside going into next week as we await both the Canadian payroll number and the US payroll number.
Australian Dollar versus U.S. Dollar
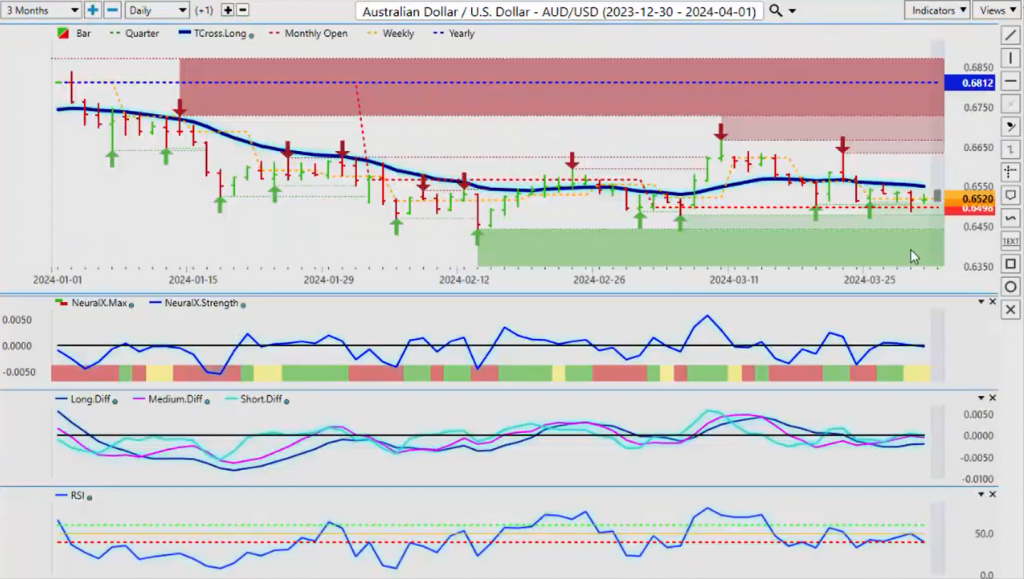
Now, the Aussie when the US dollar turns and weakens, the Aussie will be a very, very good trade. Now, I believe we’re going to have pretty good support forming down here, just below the 65 level, likely around the monthly opening price. But again, the Aussie has fared pretty well here. When we use the current monthly opening price of March, we can see how the market has repeatedly been buying off the current monthly opening price. But if I said, “Okay, we’re going to look at the last 30 days from the 19th of the month,” I wouldn’t even see this. So again, very important that we use the start of the month, the end of the month, the start of the week, the end of the week, the start of the new calendar year, year to date—that’s all we care about. Then we can layer in our seasonal patterns, stock rotation, all those things. We can layer in, but first, none of that would be useful if we didn’t have the proper anchor point. So, for the Aussie right now, 65 is a big level, and these indicators are mildly—this is a very mixed bag of indicators. The MA diff cross says we’re going higher, predicted RSI says we’re getting ready to break lower, the neural index and neural index strength are both neutral. So again, allow the market to start trading into Tuesday, Wednesday of next week. Monday’s a holiday. We know we have a Monday-Tuesday reversal, so now we’re going to have a Tuesday-Wednesday reversal, likely, right? So, by Wednesday midday, I think we’re going to start to see where the real price is. But either way, after this payroll number on Friday, we will have a good idea what the Fed’s next play is.
New Zealand Dollar versus U.S. Dollar
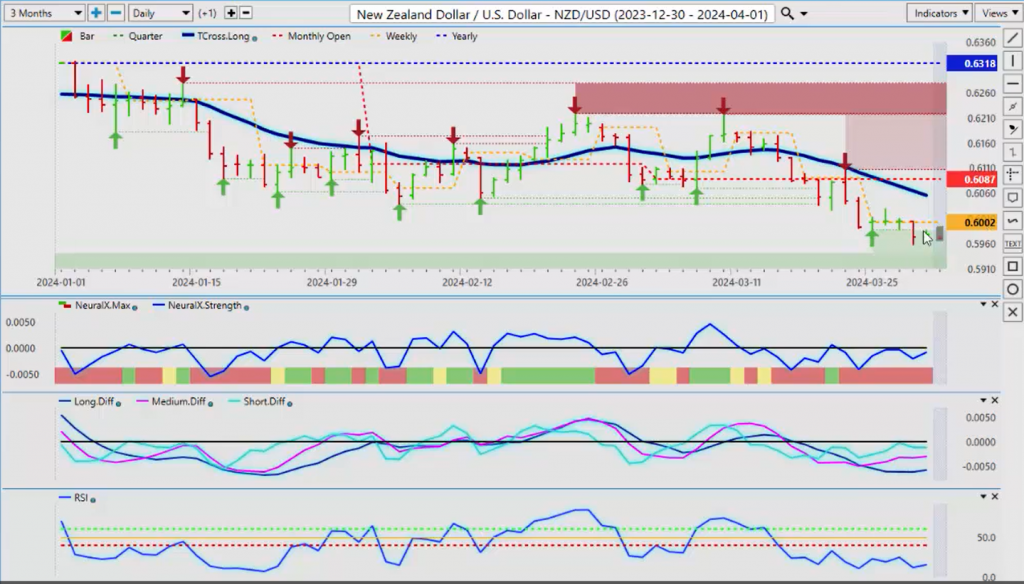
The Kiwi looks very similar here to the Aussie, very little difference in the two, other than the Aussie or, excuse me, the Kiwi is weaker. Now, that can easily be explained by Aussie/New Zealand as this thing climbs, guys. And I got this question from the other week, in one of the rooms, and they said, “Well, how come the Aussie is holding its ground, and it’s doing pretty good, but the Kiwi is not doing well at all; it’s doing a lot worse?” And the answer is right here, guys, the Aussie/New Zealand pair. And I could actually do a presentation without even looking at Aussie/US or New Zealand/US and just go right to this one. So, this one right now, to me, it’s pulling a long way away from the Vantage Point predicted moving average at 1.0819. That tells me that this is going to retrace back down. Let’s assume that I’m correct, and it does, the next week the Kiwi would be stronger, and the Aussie would be softer. For in order for them to buy Aussie/New Zealand, they have to buy Aussie/US and sell New Zealand/US, and the same thing in reverse. If they start dumping out of this, they’re going to sell the Aussie and they’re buying the Kiwi back. So, even on profit-taking, if nothing else, you’re looking, I would be looking for a retracement, potentially down to 1.0819. If I click on my F8 in my VP software, you can see that every single day, it’s just riding this up. Anybody who’s ever watched The Prices Right as a kid knows The Yodeling Guy, right? And The Yodeling Guy is yodeling all the way up here, then he hits a top, and he falls right off of it. So, keep an eye on this one because there could be some very good money to make on a short-term basis. But the first thing we need to do is break down below the long predicted at 1.0887, and then we can target the 1.08 level at the T cross long.
Happy Easter, everybody, and thanks for viewing. And once again, this is the Vantage Point AI Market Outlook for the week of April the 2nd, 2024.