Register for a Free Live Training
The Hot Stocks Outlook uses VantagePoint’s market forecasts that are up to 87.4% accurate, demonstrating how traders can improve their timing and direction. In this week’s video, VantagePoint Software reviews forecasts for American Express ($AXP), Bank of America ($BAC), GE Aerospace ($GE), Netflix ($NFLX), Microsoft ($MSFT), Cardinal Health ($CAH), Bio-Techne ($TECH)
Hot Stocks Outlook – June 26, 2026
Hello again, traders, and welcome back to the Hot Stocks Outlook for June 26, 2026. I hope you all have had an excellent week out there in the financial markets. As always, we are here to take a look at the most recent VantagePoint AI predictive forecast.
If you haven’t already, be sure to go ahead and click the link down in the description below and get signed up for a live demonstration. You can learn all the specifics about how these predictive indicators and artificial intelligence technologies are helping traders make better trading decisions out in the marketplace.
We have a really great example of how all of these predictive tools work together.
American Express ($AXP)
Once you understand one forecast, essentially one market, you can really apply that to any stock, ETF, or currency. What we’re looking at here is, of course, daily price action. Each one of these candles is going to represent a full and complete trading day.
It’s right up against that daily price action that you’ll first notice there’s a black line and also a blue line value. What that black line is, is a simple moving average. This is a very common technical analysis indicator.
We might refer to this as a traditional technical analysis indicator in that all of the data used to generate a value like this comes from the past. That’s really the weakness with traditional technical analysis.
What VantagePoint users are doing is utilizing this, which is a 10-period simple moving average, really as a baseline. It just takes the previous 10 closing prices, adds them all together, and then divides by that number. We get this rolling measure of essentially where market prices have already been.
But obviously, traders want to be ahead of that next market move. What they’re able to do is compare that lagging moving average to the VantagePoint proprietary predicted moving average. For this number, essentially this price, to get calculated and plotted on the chart every evening for the trader, well, this is where that technology of artificial neural networks comes into play.
It’s performing what we would call intermarket analysis. Now, I’ve brought up this chart within VantagePoint here because it highlights all of those intermarket relationships that go into generating these short-term predictive indicators. You can see it looks at a wide assortment of different financial ETFs and different individual stocks.
Some of these markets may be leading or lagging relationships. Some of them can be positive or inverse correlations. But it’s using all of this data from all of these related markets to generate these forward-looking predictions.
Now, when it comes to the VantagePoint predicted moving average, whenever that blue line, in this case, crosses above the black line, well, it’s suggesting that these average prices are going to start moving higher and traders can look to take, in this case, a long position.
Now, that’s not the entirety of the overall forecast. If you look at the bottom of the chart, you see this bar that goes from green to red, back to green. This, as well, is getting updated at the end of every single trading day, really at 6:00 PM the night before the next day’s market open.
You have all of this information to go into the next trading day. This is also utilizing those neural networks, but it’s tuned to solve a different problem, and that being short-term strength or weakness over the next 48 hours, or what you can think of as really a couple of candles moving forward on the chart.
So, when we apply that to the overall trend direction, that short-term, highly accurate prediction of short-term strength or weakness in the market, and then, of course, we have the VantagePoint predicted high and predicted low, so again utilizing that artificial intelligence technology to identify what is likely the high point and low point of the price range tomorrow, and then we can collectively use all of that information to execute our trading strategy.
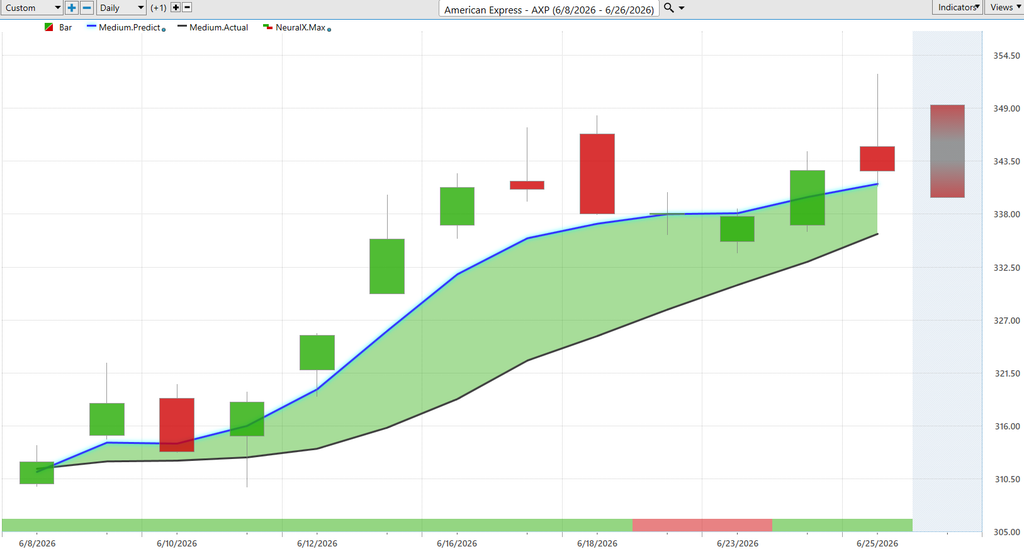
And so we see here, as American Express ($AXP) gets a very strong blue line crossing above the black line, which we can actually plug a lot of these predictive indicators into things like the VantagePoint IntelliScan, so actually scan and identify exactly when these things are starting to occur.
But we see that blue line crossing above the black line, and you’ll notice, as we look back and really take a note here of how accurate have all of those predicted high and low ranges been against the actual market data.
So, what will happen on Friday here is we’ll get the actual market data trading. We’ll see how accurate those predicted highs and lows are. But you see how, as this trend gets started, it’s letting you know, look down towards these levels if you want to be a buyer.
So, this can really help swing or position traders get that position on. It can help traders manage a position and potentially add to an existing opportunity that they’re involved in, as well as take profits on the bullish side.
You’ll notice here that we have a couple entries very early on as this close comes in a little bit outside of the range. You notice that it adjusts and lets you know, “Hey, expect tomorrow’s predicted low to be down at this lower part of the range.” And you see how perfectly that works.
We also see the Neural Index goes bearish here. And you’ll notice that, well, what happens? The market runs sideways for a couple of days, but the overall trend is still very bullish.
And you see this week the market trading up to new highs. So, even just this week, from those VantagePoint predicted lows, seeing the market move up about four, almost 5%, throughout the week, and again highlighting those areas where traders may want to pay attention in accordance with their overall trading strategy.
Now, when we look back, we say, “Okay, well, overall here we got about a nine, almost 10%, probably from these predicted lows through here, but in only about 11 trading days.” So, a pretty strong trend getting started, and we’ve seen a lot of this throughout banking stocks generally.
So, here’s…
Bank of America ($BAC)
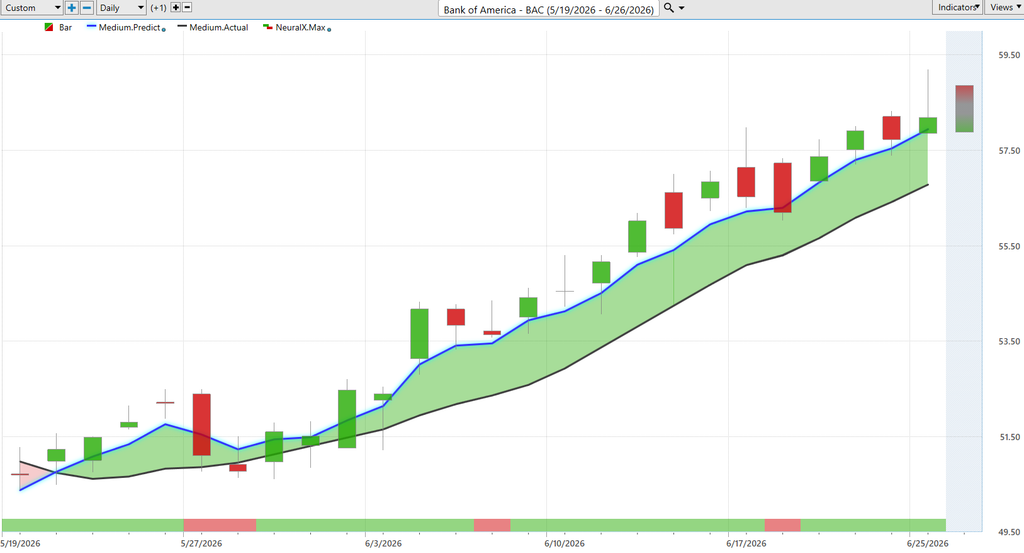
Here’s Bank of America ($BAC). You see this blue line crossing above the black line. A couple of periods here where that Neural Index goes bearish, but overwhelmingly a lot of separation between that predicted moving average and the actual moving average. That signifies a very strong upward trend, and that Neural Index you see pretty much maintaining a very bullish position throughout the past couple of months here.
Again, we have these predicted highs and lows. So, you have this roadmap that every single trading day is actually making these adjustments so that the trader can also make those adjustments and manage those opportunities.
And so, we see this from time to time. We see these predicted lows not getting hit, all the price action on that bullish side of the range. And sure enough, we sort of fill some of that previous price action before this trend gets started.
But numerous opportunities here in Bank of America ($BAC), even this week getting pretty close to that predicted low. That’s where we see a lot of that strength start to kick into shares of Bank of America ($BAC) and just many of these banking stocks generally.
So, overall, we see the market up about 13%, almost 14%, in the past 24 trading days. A very exciting opportunity there.
Bio-Techne ($TECH)
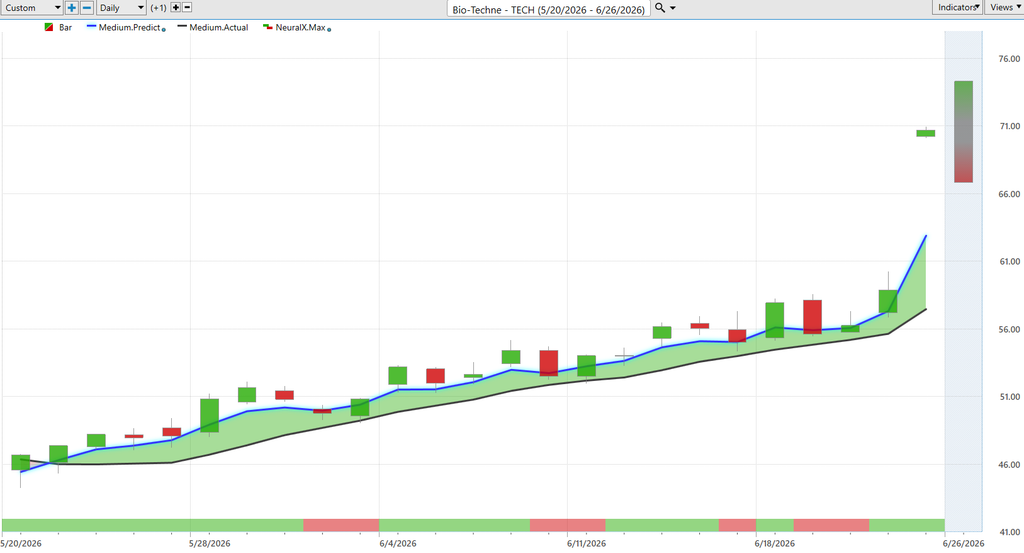
Here’s Bio-Techne ($TECH). Nice opportunity here in the biotech space. We see the blue line crossing above the black line again.
A couple periods where that Neural Index is going to go bearish, and you’ll notice that the market tends to run sideways over those periods. But overall, the trend is up.
And so, as day to day goes by, you may trade within these VantagePoint predicted high and low ranges. We may run sideways, but you certainly want to be involved in those markets where the trend is bullish because sometimes you get these really strong explosive moves as that trend really accelerates and continues.
But you see numerous opportunities here for traders to buy down towards these predicted lows, and within 48 hours you see the market moving into that bullish trending position.
So, as we look at currently where the market is at, shares are up about 51% here in just the past 24 trading days.
Here’s Cardinal Health ($CAH).
Cardinal Health ($CAH)
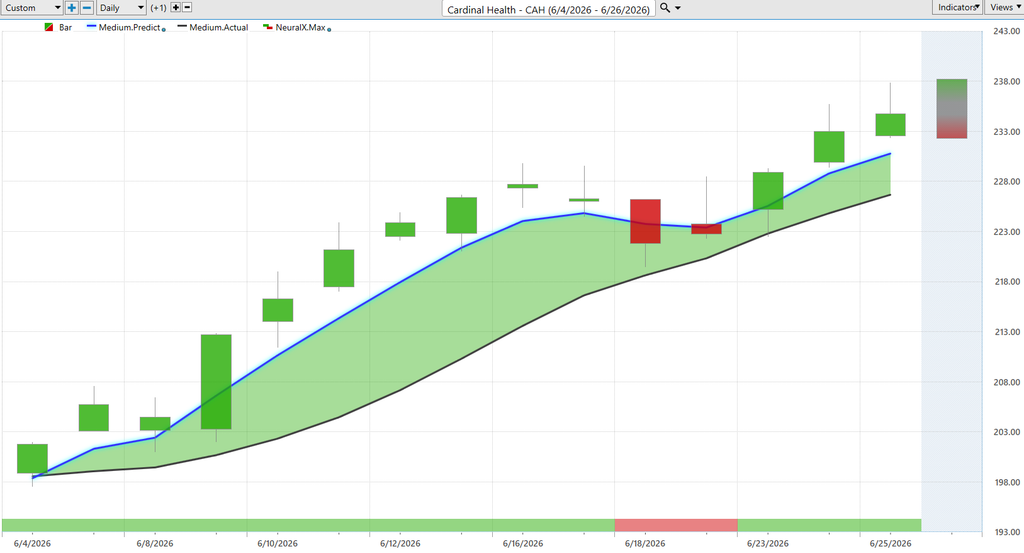
So, this being a healthcare stock, insurance company, blue line crossing above the black line. One dip here where the Neural Index goes bearish, and you see you get that subsequent next trading day where not a lot is happening, but very clearly the trend is up.
If traders want to go ahead and manage that opportunity, we have these levels that every single trading day are going to adjust. And that’s one of the big parts of all this, that ability to adapt to those changing market conditions.
So, we can identify areas in the market that are bullish, where all of these predictive tools are in a bullish configuration, where we see that predicted high and low range starting to slant higher. We see about a 15% rally over the past 14 trading days.
And just last week we looked at GE Aerospace ($GE).
GE Aerospace ($GE)
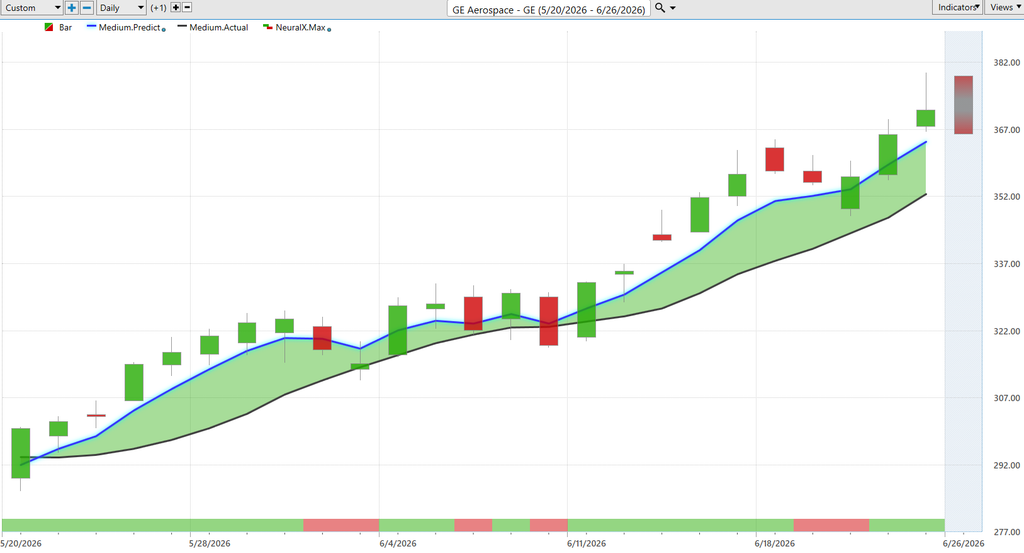
So, again, just as you might be managing an opportunity, or you may have a position, well, over the past four trading days, so this would be Monday, Tuesday, Wednesday, you really have this roadmap that’s going to guide the trader as far as, well, where should I be looking to accumulate a position.
And so, on a day like this, you actually, if you have an order waiting at the predicted low, you’re just going to get filled at the open and then immediately start benefiting as that uptrend continues.
So, again, really nice opportunities here in GE Aerospace ($GE) from the beginning of the week, up another about 5% just this week. But overall, this market up about 22% just in the past 23 trading days, being a very nice opportunity there.
A couple of weak points in the market. So, last week we looked at Netflix ($NFLX), and sure enough, to get the week started, aggressively started trading lower.
Netflix ($NFLX)
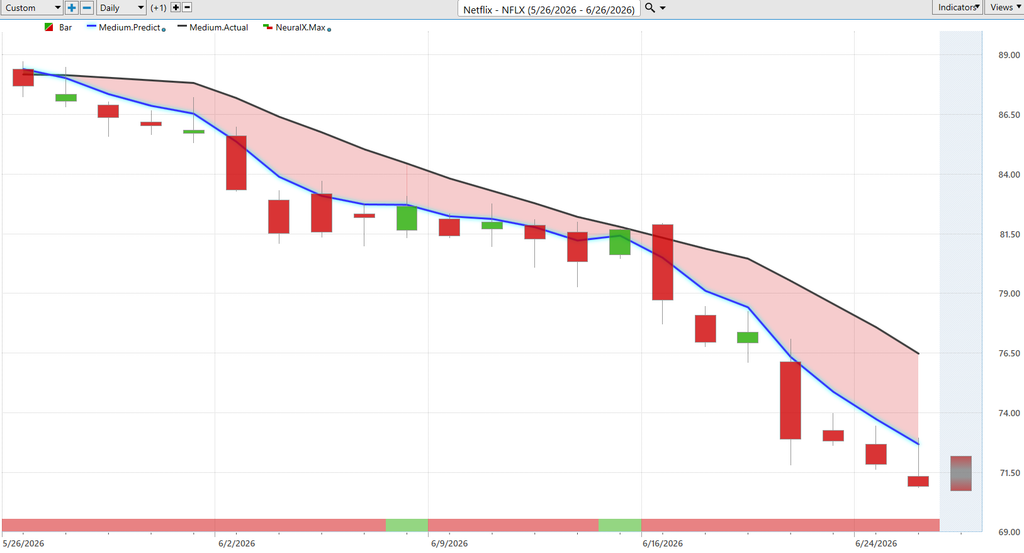
So, again, as we look at those predicted highs and lows, you see even just yesterday here on Thursday, scooting up to the predicted low, and obviously not a market where you want to be a buyer. All you’d want to do is short, take profits on shorts.
And we see the market selling off and continuing to go lower. So, we will see how low things get for Netflix ($NFLX) and, potentially, when it comes time running those nightly scans with the VantagePoint IntelliScan, we can identify when these markets start to shift to the upside.
But currently, off about 18% in just the past 21 trading days.
And also Microsoft ($MSFT).
Microsoft ($MSFT)
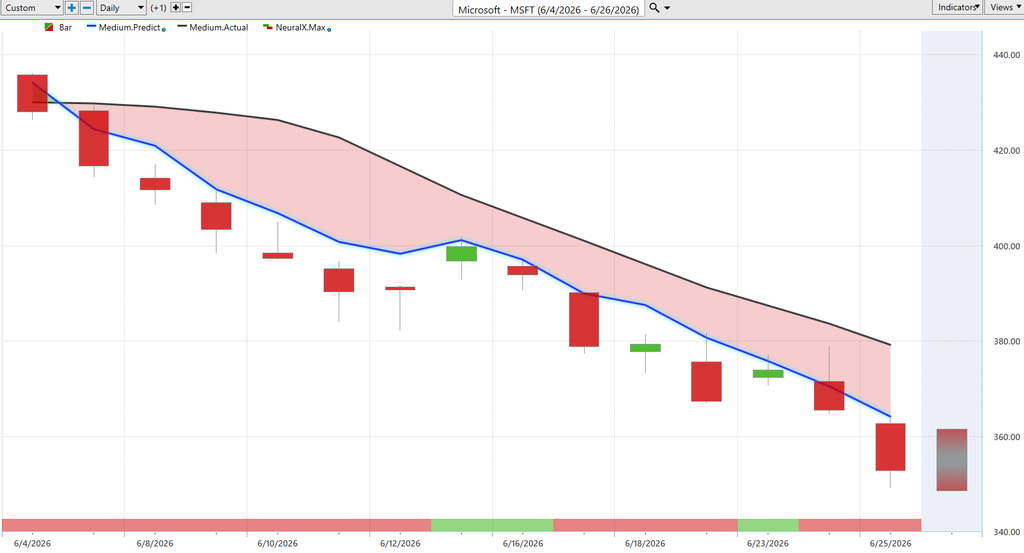
So, we’re seeing a lot of volatility across the major indices. And so, this is where a lot of these large-cap stocks like Meta, Microsoft ($MSFT), actually not performing well.
Some of the consulting companies like Cognizant Technology Solutions and Accenture and all these things really performing very poorly.
Here you see this blue line crossing below the black line. We bring up those predicted high and low ranges, and you see here just moving up towards these predicted highs and then continuing on with this downtrend.
So, you know, it makes sense that we may see some weakness out of the major indices as we’re just seeing a whole lot of volatility. Things start to shift around.
We had things like Micron earnings this week, you know, propelling the stock futures higher and the overall stock market higher. But a lot of these things are dragging things lower.
So, you want to be a little bit careful out there. There you see about a 16% decline here in Microsoft ($MSFT) just in the past 14 trading days. So, that is a pretty large move over a short period of time.
So, we’ll go ahead and leave it there for today.
But once again, this has been the VantagePoint Hot Stocks Outlook for June 26, 2026.
Thank you all for watching.
Best of luck out there, and bye for now.