


Register for a Free Live Training
The Hot Stocks Outlook uses VantagePoint’s market forecasts that are up to 87.4% accurate, demonstrating how traders can improve their timing and direction. In this week’s video, VantagePoint Software reviews forecasts for Chevron ($CVX),CF Industries Holdings($CF), Agilent Technologies ($A), Camping World Holdings ($CWH), Ovintiv ($OVV), Williams Sonoma ($WSM),
Chapter 1: VantagePoint A.I. Hot Stocks Outlook for March 13, 2026
Hello again traders and welcome back to the VantagePoint AI Hot Stocks Outlook, where we take a look at the most recent VantagePoint AI predictive forecast. So if you haven’t already, be sure to go ahead and click the link down in the description below. You can get signed up for a live demonstration and learn about how all these predictive technologies and indicators are helping traders navigate the financial markets.
And so we’ll start out in a very popular area for the market right now, oil. So last week we took a look at Ovintiv, which we’ll go ahead and revisit there, seeing some weakness around retail. And this is where VantagePoint’s predictive forecast can help identify where those strong correlations and strong trends are in the market, but very early.
So here we have shares of Chevron ($CVX) and it’s a really nice example of how all of these predictive tools work together. So the first indicator that we’re going to take a look at is this blue and black line value that you see right up against what are daily bars and candles. So each one of these candles there will represent a full and complete trading day.
Chevron ($CVX)

And what we have with that black line and blue line is actually a simple moving average. So the black line value there is a very common technical analysis indicator, and in this case it would be a 10 period. So that means it looks at the previous 10 close prices, adds them all together and then divides by that number.
VantagePoint traders are able to use this as a baseline because all of the data that generates traditional technical indicators like this comes from the past. So it acts as a baseline letting us know what’s already occurred.
But obviously traders need to be ahead of that next move in the marketplace. And so VantagePoint users are able to compare that lagging moving or actual moving average to the VantagePoint proprietary predicted moving average.
For this value, essentially a price gets calculated and plotted on the chart every evening. This is where the technology of artificial neural networks comes into play. What they are doing is performing what we would call intermarket analysis.
And what that means is that rather than just looking at past prices and reconfiguring what’s already occurred, what VantagePoint’s technology is doing is looking at other markets that are known to drive and influence future prices.
Now this is really helpful in something like Chevron ($CVX) where we know those big commodity markets like oil, natural gas, and the energy ETFs are going to have a big effect and offer some very valuable price clues onto where price is headed next.
But there are also subtle relationships that can take place between other energy stocks, other stocks that are completely unrelated, and even those large markets like the value of currencies, the value of the U.S. Dollar, or global interest rates and the bond market.
So it really takes this global approach, looking at specifically where those other markets that we call intermarkets are affecting future price. This is where that artificial intelligence is able to take in that huge amount of data and generate highly accurate predictions on where price is headed next.
Whenever traders see that blue line cross above the black line, it suggests these average prices are going to start skewing to the bullish side. We really have some excellent features within VantagePoint like the Intelliscan, which will identify where we start seeing sectors in the market where those bullish forecasts start to come through.
That can really help traders identify these trends quite early.
So again, as long as that blue line remains above the black line we would expect prices to move higher. Since that forecast came through, shares of Chevron ($CVX) were up about 31%.
But this move did not just start recently. This goes all the way back toward the beginning of January and the end of December. About a 31% rally over the past 54 trading days and obviously still in that uptrend with some bullish catalysts to drive things forward.
Now that is not the entirety of the forecast. If you look at the very bottom of the chart you will see this bar that goes from green to red back to green. This is getting updated every single evening for the trader.
All these updates come in at 6:00 p.m. the night before and they are giving you all of this information for the next trading day, the next open at 9:30 a.m.
What this neural index is doing is solving a different problem for the trader. That being short term strength or weakness in the market.
Whenever that neural index goes bearish, you tend to get subdued price action over the next couple of trading days. You see here quickly the neural index gets bullish and we see that momentum kick into the market.
Again we may see some gap down sideways price action. It may march sideways for a bit, but it helps traders anticipate short term weakness in the market.
So do not get scared out of a position. Here you see the neural index goes bearish and you get a couple days of weakness. But notice the blue line is still above the black line. When all the close prices come in we still see this market is in an uptrend and traders would want to look to exploit the bullish side of the market.
Lastly we have the VantagePoint predicted high and low. This really acts collectively with this suite of AI driven predictive indicators to create an overall forecast with the overall trend, short term strength or weakness, and then intraday prices with the predicted highs and lows.
We really see how this works week to week. We can look at how accurate those predictions are.
So here in Chevron ($CVX), an area of the market where it has clearly been bullish, we have levels showing where traders want to be buying within a 48 hour period to exploit the bullish side of the trend.
This actually goes back to what would have been Tuesday. Orders waiting down at those predicted lows get filled and of course benefit as shares move higher into the end of the week.
Now we see Chevron ($CVX) just this past week about a five percent move higher in the past couple of trading days.
Ovintiv ($OVV)

Last week we also looked at Ovintiv ($OVV). This is not a trend that is just getting started.
Here we see again that traders can exploit bullish energy prices. We have a road map that shows where we should be looking for those short term prices to move down to.
This would have actually been last Friday. Then we see Tuesday a gap down, and again the overall trend continuing.
So a really nice move out of shares of Ovintiv ($OVV) just this week.
But of course we can take a look at the bigger move, which really got started back at the midpoint in January. What you get are many predictive indicators around the energy space.
By analyzing Intelliscan we see many markets in a bullish trend within this sector.
Clearly an area where traders want to focus.
CF Industries Holdings($CF)

We see about a 38% rally in the past 39 trading days.
And it does not end at energy. This affects things like fertilizer.
Here we see CF Industries Holdings ($CF) very clearly with the blue line above the black line.
Before we got all this news around geopolitical risk we could already see CF Industries ($CF) in an uptrend.
We had the neural index go bearish and saw sideways price action, but very clearly the overall trend remained bullish.
You actually get earnings here, which are marked by the logos on the chart.
If we have that road map from the VantagePoint predicted highs and lows we can determine where traders want to be accumulating positions in the uptrend.
This becomes especially powerful when volatility starts to expand and daily trading ranges widen.
VantagePoint adapts to this. It analyzes intermarket relationships and adjusts those predicted ranges.
You can see where traders would have looked for prices to trade lower before continuing higher.
The move in CF Industries ($CF) has been aggressive. About a 25% move in the past three trading days and about a 43% move in the past 20 trading days.
Very similar patterns are showing up across energies, commodities, currencies and fertilizer stocks like CF Industries ($CF).
Agilent Technologies ($A)
Here we shift lanes because some markets have performed very well while the broader stock market has started to sell off.
That pressure naturally pulls many stocks down with it.
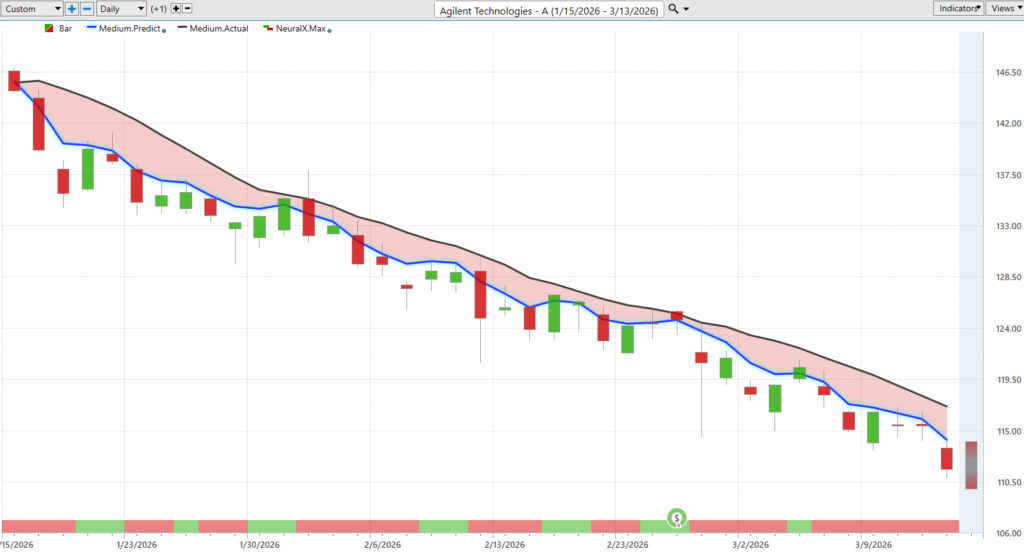
Here we see Agilent Technologies ($A).
The blue line is below the black line going all the way back to January. That clearly signals a downtrend.
Traders can use that information to decide whether they want to hedge portfolios or potentially take short positions.
This updated road map indicates where traders may want to be setting those positions.
This week we saw the market move up to the predicted high and then continue the weakness seen across the broader technology sector.
Just this week shares of Agilent Technologies ($A) are down about 4.5% in the past four trading days.
Looking at the bigger picture the stock is down about 20% over the past couple of months.
Camping World Holdings ($CWH)

Here we move to the retail space with Camping World Holdings ($CWH).
Very clearly the blue line is below the black line.
We will occasionally see short bursts where the neural index turns bullish, producing sideways price action.
But the trend remains bearish as long as the blue line stays below the black line.
Traders would therefore focus on the predicted high levels to initiate or add to short positions.
This framework provides overall trend direction, short term strength or weakness, and insight into the next 48 hours of momentum.
We do not want to get rattled out of positions by temporary moves.
In Camping World Holdings ($CWH) we have seen multiple opportunities where price moved up to the predicted high and then continued the downtrend.
This has been a steep decline, with shares down about 52% in the past 30 trading days.
Clearly an area traders would want to avoid or potentially short.
Williams Sonoma ($WSM)
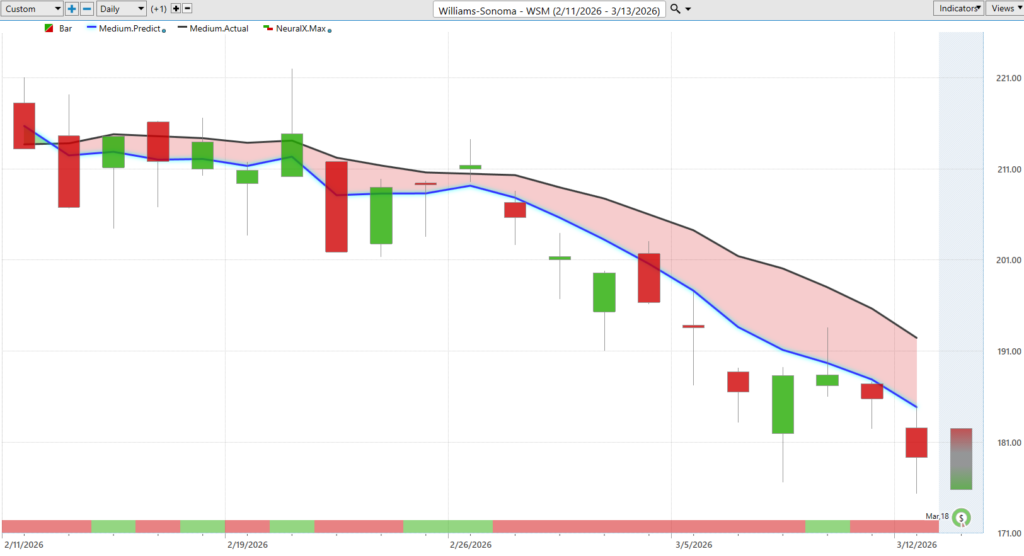
Last week we also looked at another retailer, Williams Sonoma ($WSM).
Again we see the blue line below the black line.
Looking at the past five trading days gives a good example of how these tools work for both short term traders and swing traders.
The road map showed that Tuesday was a good opportunity to initiate or add to short positions.
Shares fell another 6% going into the volatility surrounding earnings.
Over the past few weeks the stock is down about 17% in the past 18 trading days.
So we will go ahead and leave it there today.
We are seeing a split narrative in the market.
Some stocks are performing extremely well, driven by the broader macro environment, while other stocks are starting to cool off.
That is creating a very mixed picture for the broader indices and the market overall.
Once again this has been the Hot Stocks Outlook for March 13, 2026.
Thank you all for watching. Best of luck out there and bye for now.


