


Register for a Free Live Training
The Hot Stocks Outlook uses VantagePoint’s market forecasts that are up to 87.4% accurate, demonstrating how traders can improve their timing and direction. In this week’s video, VantagePoint Software reviews forecasts for Reliance Steel ($RS), Regions Financial ($RF), Owens Illinois ($OI), Permian Resources ($PR), Ovintiv ($OVV).
VantagePoint A.I. Hot Stocks Outlook for March 20, 2026
Hello again traders and welcome back to the hot stocks outlook for March 20th, 2026. I hope you all have had an excellent week out there in the financial markets. And as always, we’re here to highlight the most recent Vantage Point AI predicted forecast. So, if you haven’t already, be sure to go ahead and click the link down in the description below and get signed up for a live demonstration and you’ll learn all the specifics about how these predictive indicators and artificial intelligence technologies are helping traders make much better trading decisions out in the marketplace. Uh, and so we have a really great example of how things shift and how traders can really adapt to those changing market conditions.
Reliance Steel ($RS)
So if you look back in previous hot stocks outlook, this is an area, this specific stock, but also just steel and aluminum, we really identified a lot of this strength while we had a very bullish forecast. But we’ll go ahead and highlight how things shift and how traders can really be ahead of that. Uh and now is an especially important period of time where a lot of stocks are moving lower, but there will be many stocks that recover and really great opportunities in the future.
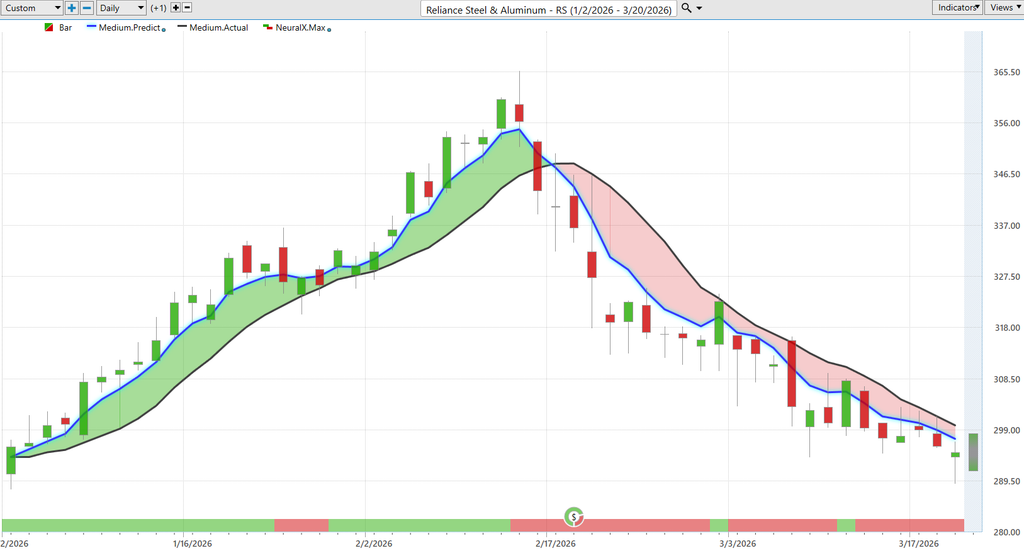
So, what we’re looking at here with Reliance Steel and Aluminum is, of course, daily bars and candles where each one of those candles is going to represent a full and complete trading day. And it’s right up against all that price data that you’ll first notice that there is a black line and also a blue line value. And so, what that black line value is is actually a simple moving average or what we refer to as the actual SMA. Uh, and this is a very common technical analysis indicator. This is really how all technical analysis works. And in this case, it’s a 10 period simple moving average. So it takes the previous 10 close prices, adds them all together, and then divides by that number. And that will give us a rolling measure of where market prices have been, right. It smooths out the data and gives us a value. But all of that data comes from the past. So it’s really just reconfiguring what’s already occurred and has no predictive capability.
So what Vantage Point traders are able to do is compare what you might call that lagging moving average to the vantage point proprietary predicted moving average. And so for this value essentially this price to get calculated and plotted on the chart every evening. Well this is where that technology of artificial neural networks that artificial intelligence is performing what we would call intermarket analysis. And so what that means is that rather than just looking back at previous prices, reconfiguring what’s already occurred, and just sort of moving that data forward, what Vantage Point’s technology is doing is actually using data from the other markets that are known to drive and influence the future price of the target market. So this in this case, Reliance Steel and Aluminum.
Now this can be things like individual stocks and some of those might be obvious relationships like US steel or other US steel and aluminum companies, but this can also be things like the ETF group which is going to wrap up a whole sector and similar types of companies and opportunities. But really take this global where it’s actually going to look at things like currency values, global interest rates, and even global commodities like in this case copper and industrial metal where applicable. Right, so for energy stocks that can be natural gas and energy futures prices. But in this case, we’re going to have its unique set of really dozens of markets that are known to influence future prices and will be factored into that forecast.
And so all of that information is then incorporated into this blue line value, which is our predicted moving average. And so whenever that blue line gets above the black line, well, it’s suggesting that average prices are going to start going higher and traders can use that information in this case to go ahead and look to take a long position. So, again, in these previous hot stocks outlooks, we really highlighted this opportunity numerous times. And you see how robust the forecast here is here where you get a 23% rally over the subsequent 28 trading days.
Now I want to go ahead and round out the other aspects of the Vantage Point AI predictive indicators with the neural index. So you see this bar at the bottom of the chart that can go from green to red back to green. Well, this is also getting updated every single evening for traders, but it’s solving a different problem and that is short-term strength or weakness over the next 48 hours. Or you can think of that as really just a couple of candles on the chart. And so this allows traders to get ahead of short-term strength or weakness in the market.
And we can see on subsequent forecast how this plays out where we get that blue line above the black line, neural index very bullish indicating strength over those subsequent 48 hour periods. And again that’s getting updated every single trading day moving forward and has an extremely high level of accuracy associated with that indicator on a very wide diverse group of markets. And so you’ll see here that as the neural index goes bearish, notice the price action somewhat subdued over the next few trading days, neural index gets bullish and you see that momentum really kick into the market until such time that neural index gets bearish and we see things start to soften up here.
So it’s very straightforward how traders can utilize these tools. But notice that more recently we’ve seen that blue line get below the black line indicating some weakness in this area of the market, and shares are already off about 13.5% over the next 23 trading days. But that’s not the entirety of this. You’re also provided a intraday predicted high and low. And so this is where things get really exciting for managing positions or potentially shorter term day trades.
And so what we can do is actually look back and say, okay, well, how accurate are all of those predictions before the actual trading day occurs. So if you see here, we’re going to get a high and a low. The candle is going to fill in, but the prediction will remain exactly where it is. And we can see how effective these tools are when used together. As the market moves into an uptrend, you see we scoot down almost perfectly gapping down to that predicted low. Immediately buyers step in, push the market higher again here, gap down, immediately going higher with the predicted trend direction.
You see here as the market settles in. Numerous opportunities here where the market doesn’t move much over these five trading days. Can seem a little bit boring, like nothing’s going on. But in reality, you’re really pinpointing some expert entries into a market before it continues its next uptrend. And even with that volatility quickly scooting down this trading day, you see that close at the low, but the trend is still up. And even with that close, prices go higher over the next trading day and move up.
Now, more recently though, neural index gotten bearish, expressing some of that weakness in the market. And of course, the exact same thing on the way down. You see this blue line gets below the black line from this point forward on the 17th. And notice how these tools work. So even in a day like this where you gap down, well, look at the price action there going all the way up to the predicted high and then continuing that move lower. More recently strong trading day that just gaps down the next day, moves lower, gap up and lower, move higher and lower still.
So even just this last trading week moving up here on Monday and Tuesday, those are really the high points as far as the market this week, and then continuing and hitting some lower lows down here around 290. So really nice opportunity here highlighting how all of these predictive indicators work together and also allow you to adapt to those changing market conditions because very clearly here even here before earnings we see that forecast getting bearish and the continuation of that weakness broadly across the market.
Now financials have also been weak here. So again here’s an example of:
Regions Financial ($RF)
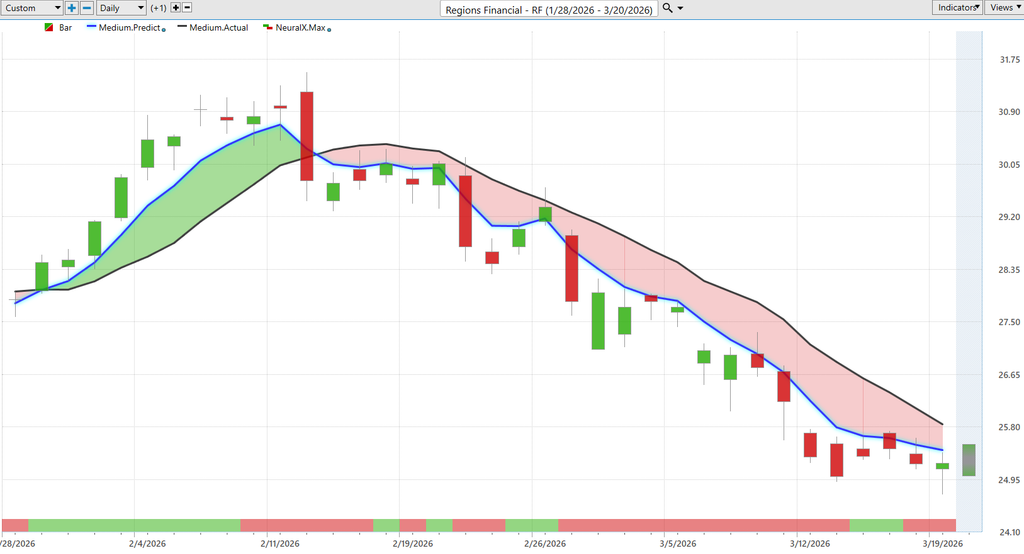
You see that when the blue line crosses above the black line, well, we’ve got strength in the market, right. Short-term traders understand, hey, we got momentum here. We can shoot for those bullish price targets. But notice that as the neural index goes bearish, that’s where we first start to see this weakness seeping into the market and then we get that crossover to the bearish side.
And we’ve seen really the wider space of financial stocks performing very poorly, right, whether it’s here in Regions Financial or the XLF, the financial ETF. Here we see off about 16% in just the past 23 trading days. And traders can again take the same approach with these tools. It’s going to help warn you of say, okay, well, you’ve got some strength over the next few trading days, that neural index getting bullish, you see these bounces in the price action, but clearly the trend is down.
And so traders want to use the rest of that information from the vantage point forecast to if anything short the market, take profits on shorts, expect these spikes to higher prices, but understand that the bigger move should still be to the downside. You see moving to the predicted high and again here Monday, Tuesday, strength at the beginning of the week, but then moving lower into the end of the week here on Friday.
So really exciting opportunity and we may see again things shift here. So, this is where things get exciting is as the markets go lower and the broader indices are selling off, well, there’s going to be a lot of bullish opportunities as share prices get lower and vantage point traders can utilize these predictive tools to really get ahead of that.
Owens Illinois ($OI)
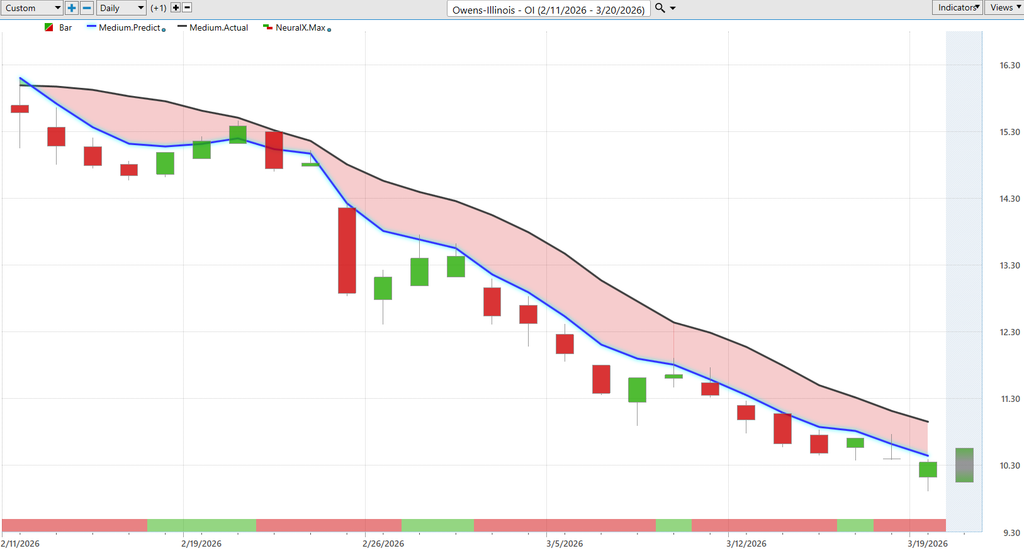
Another example of some of the weakness in the market. Blue line below the black line. Again see the neural index getting bullish and notice how the price action comes out of really the momentum of bearishness in the downtrend and settles out for a little bit. But is the market shifting to a bullish trend. Well, no, right. The blue line is still solidly below the black line.
We see a lot of that weakness heat up once the neural index goes bearish. Well, you see that momentum gap downs really aggressively moving lower in price. Again, here neural index gets bullish. We have a bullish trading day for the next 24 hours there. But the overall trend you see solidly blue line well below the black line and the trend remains bearish.
Of course we have those predicted highs and lows to really refine things and we see how this works. Numerous opportunities on the really bullish part of the range here before shares go lower. So even just this last predicted high the market closing just over eight trading days down 13% from that last predicted high level that had come through in Owens-Illinois here.
Permian Resources ($PR)
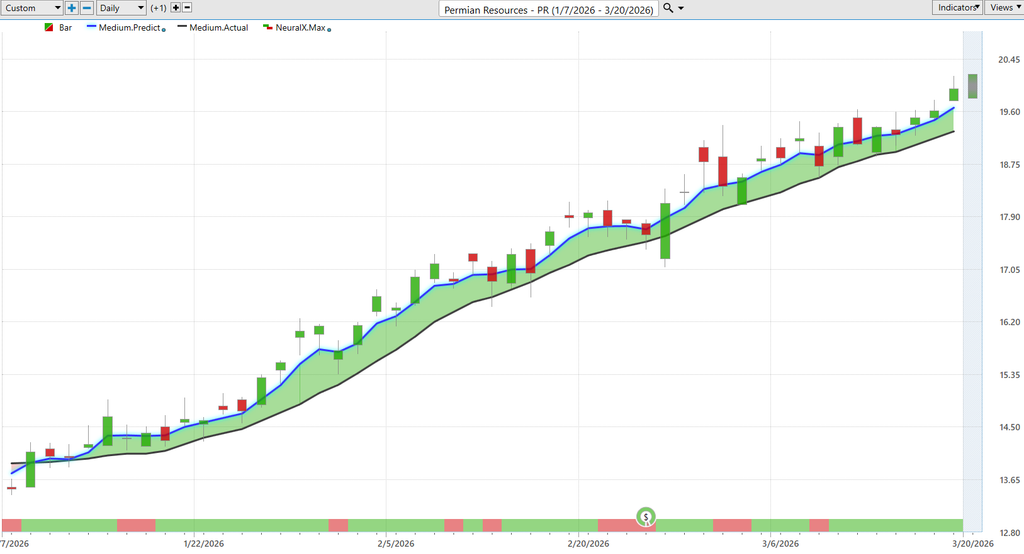
And lastly here, we’ll just go ahead and end on some of the energy stocks. So here’s Permian Resources very clearly here, taking all of that information of how these predictive indicators and tools work. Well, very clearly energy stocks and the energy sector as a whole, very bullish here. Blue line above the black line. Neural index bullish before the start of this move.
You see, we settle in a little bit here. A little bit of sideways price action, but the overall trend very bullish. And so this is where traders really want to utilize a suite of tools that’s going to be influenced by those intermarket relationships and give traders an edge.
So what happens is we see all of these indicators looking at those relationships and other energy ETFs and the commodity itself, oil, Brent oil prices, natural gas prices, and then using that information to skew how bullish the forecast is getting here and where things are expected to move higher.
So overall, we’ve seen a move up of about 42% in just the past 48 trading days. And again, of course, we can look at, well, how accurate are those daily predictions of the highs and lows. And you see how you get numerous opportunities within the uptrend to be accumulating at excellent prices.
So it’s not within really the two or three days where the market may settle in a little bit, but then continues on that uptrend and traders can continue to benefit, trail stops up as the markets go higher. It’s a really exciting move there.
Ovintiv ($OVV)
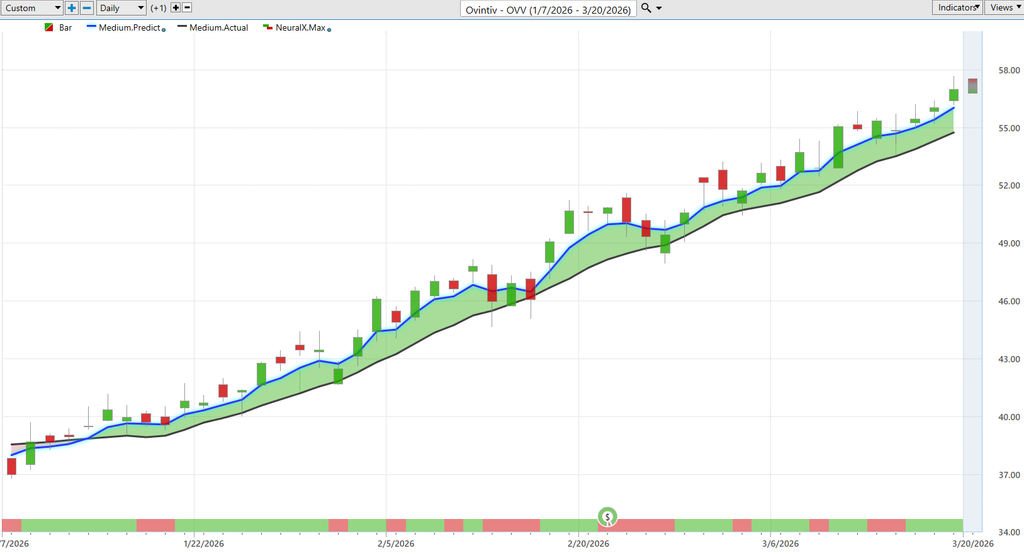
And lastly, I just wanted to end here on $OVV. So, this is again another energy stock that we’ve looked at over the past couple of weeks. And so, what I want to highlight here is where we’ve looked at this two weeks ago. Well, how accurate have all of these predictions been over the past couple weeks.
Now, clearly, we’re in an uptrend. We have that guidance that says, hey, we have an uptrend here, but how are these short-term tools working. And as we bring up the predicted highs and lows, well, we see exactly how this works, right. Moving down to the predicted low here. This actually would have been Friday and Monday.
So, as far as identifying, hey, we’ve got a market in an uptrend. If we want to do some trading here, well, where do we want to accumulate a position. Well, down at those predicted lows, waiting with limit orders, we see the market up another 4.8, almost 5% just in the past five trading days. Over the past couple weeks now up about 9% over about 10 days of trading.
So really exciting stuff here. But obviously traders depending on your style and approach, what markets you like to trade, well you’re going to utilize different indicators to really match again that overall time frame whether you’re a swing or position trader, whether you’re a shorter term day trader, want to identify some really advantageous levels to take a position.
But really just utilizing the accuracy of these predictive indicators and forecasts to get the most out of your trading approach and style. So, we’ll go ahead and leave it there for today, but once again, this has been the hot stocks outlook for March 20th, 2026. Thank you all for watching. Best of luck out there and bye for now.


