


Register for a Free Live Training
The Hot Stocks Outlook uses VantagePoint’s market forecasts that are up to 87.4% accurate, demonstrating how traders can improve their timing and direction. In this week’s video, VantagePoint Software reviews forecasts for Ovintiv ($OVV), Chevron ($CVX), Permian Resources ($PR), Danaher ($DHR). Boeing ($BA), Toll Brothers ($TOL), Pepsico ($PEP)
VantagePoint A.I. Hot Stocks Outlook for March 27, 2026
Hello again, traders, and welcome back to the hot stocks outlook for March 27th, 2026. I hope you all have had an excellent week out there in the financial markets. And, as always, we’re here to take a look at the most recent Vantage Point AI predictive forecast.
So, if you haven’t already, be sure to go ahead and click the link down in the description below and get signed up for a live demonstration. You can learn all the specifics about how these predictive indicators and this artificial intelligence technology is helping traders navigate and make much better trading decisions out in the marketplace.
Ovintiv ($OVV)
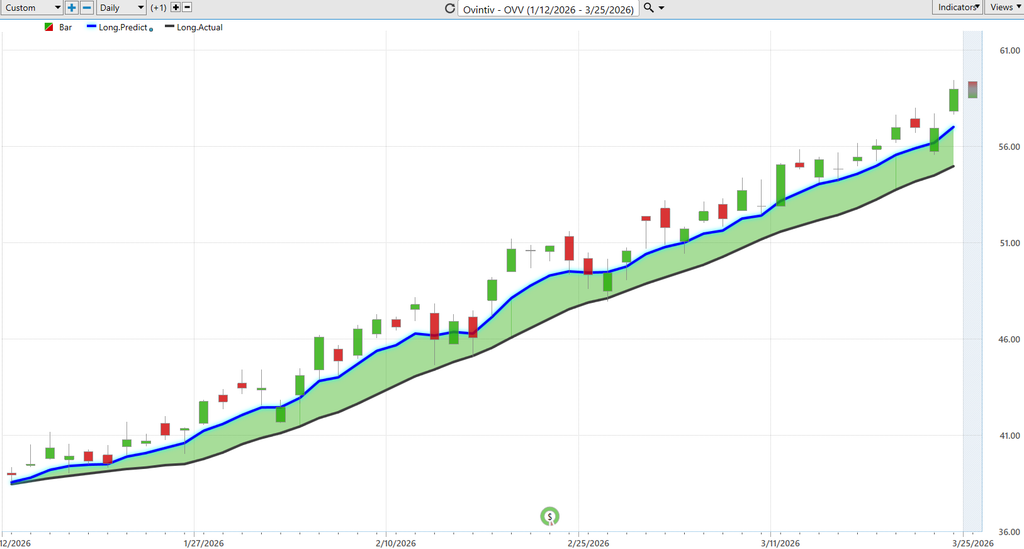
So we’ll go ahead and revisit Ovintiv ($OVV). This has really been a theme over the past threeWeeks here in the hot stocks outlook, um, identifying that we have strength in energies and weakness just about everywhere else. Um, so really great example of how all of these predictive indicators work together, but more importantly, how things update and adapt, because that’s what traders really need is to understand, uh, when a trend is continuing to play out, when they should add to a position, potentially get more aggressive, uh, and also when they have to change course. And so, uh, what we see with $OVV here is, of course, daily bars and candles. So each one of these candles is going to represent a full and complete trading day. And it’s right up against all that price data that you’ll first notice that there’s a black line, but also a blue line value. And so what the black line value is is actually a simple moving average. So this is a very common technical analysis indicator. In this case, it would be a 10 period. So it just looks at the previous 10 close prices, adds them all together, and then divides by that number.
Now, the weakness with traditional technical analysis like this is that all the data comes from the past. So, it’s really just restructuring what’s already occurred in the market and has no predictive capability on where prices are likely to head. And so, what Vantage Point traders are able to do is actually use that as a baseline, and we could compare that to the proprietary predicted moving average. So, this number that you see on the chart here is essentially a price that’s going to get calculated and plotted on the chart every evening. But to arrive at that value, what Vantage Point’s technology is doing is what’s called intermarket analysis. And, uh, it’s really great when this happens with something like energies, because it’s very easy to understand what’s going on here.
Is that, rather than just looking at what’s already occurred, right, just sort of getting derivatives of price and moving that data forward, what VantagePoint’s technology is doing is utilizing artificial neural networks. So artificial intelligence to analyze huge amounts of data, uh, from intermarket. So other markets that are known to drive and influence the future price of OBV. So this can be things like other energy stocks or other stocks that might seemingly not have a strong relationship with energy. Uh, but the software and the technology here has picked up on those relationships. But it’s also going to look at ETF groups, which obviously wrap up a huge grouping of the oil sector and energy sector as a whole. Uh, and it really takes this globally, looking at things like global currencies, global interest rates, uh, and even commodity and resource markets where applicable. So obviously oil, energy, nat gas, all of these things help determining where prices of shares of something like OBV are headed next.
And so whenever we see that blue line cross above the black line, well, it’s suggesting, hey, these prices are going to start moving higher. Traders can look to take a long position. We see over the past 51 trading days, now oventive is up 55.6%. Uh, but more importantly, how have things shifted over the course of those 55 days? Well, this is where VantagePoint’s other predictive indicators can help solve these different problems for the trader, that being short-term strength or weakness, and also predictions for intraday highs or lows.
And so, if you look at the very bottom of this chart, you’ll see this bar that currently is green, uh, but can flip to red on occasion. And what this is doing is it’s utilizing Vantage Point’s artificial intelligence, but to solve a different problem. And that problem just being short-term strength or weakness over the next 48 hours. So you can think of that as really as a couple of candles moving forward, uh, at a time. Uh, and so you’ll notice that when that neural index goes bearish, you tend to get sideways and subdued price action over the next 48 hours. But as long as that blue line remains above the black line, well, you’d expect the overall trend to remain up.
So you see here that over the past few weeks here now that neural index has been bullish every single day. Uh, and in addition, we have this predicted high and predicted low range. And we’ve taken a very close look at specifically oventive here over the past few weeks. And we’ll do that again here and see, well, how accurate all are all of those predicted highs and lows. You see here that this was actually last Friday and Monday. Uh, this would be Monday this week where, if you’re waiting to be a buyer in this market, you immediately get filled at the bottom here. Uh, and we’ve seen shares continue to go higher as we’ve seen just a lot of volatility spread out throughout the marketplace.
So just this week, that’s about a 9.6% move. Uh, from last week’s predicted low, it’s about 12.6. Uh, and from that week before where we really started this, we’re already up about 17%. Uh, so about 17% increase on top of that 55% move and really creating some great opportunities throughout the energy space.
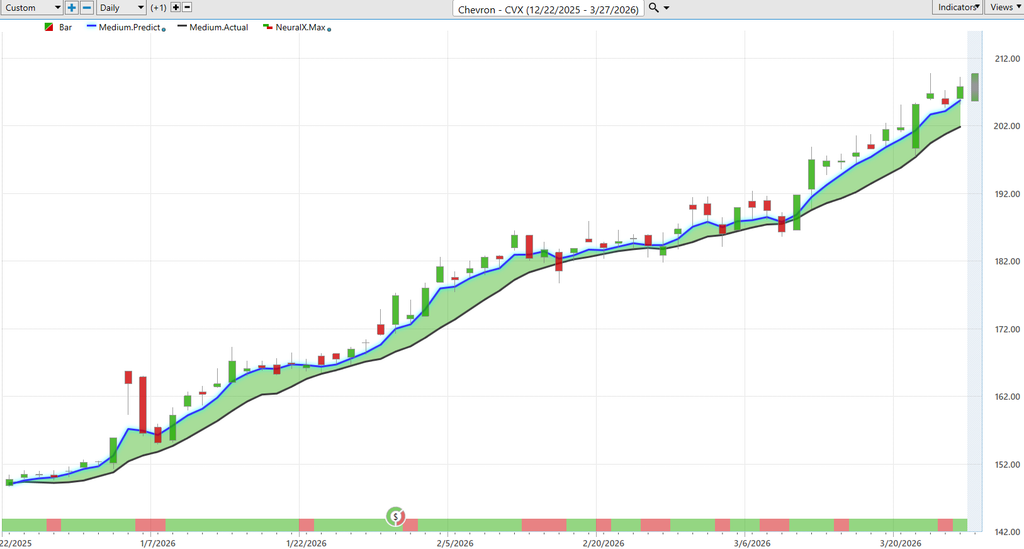
Uh, and so I won’t spend a huge amount of time on these other energy stocks, but here is Chevron. So, we looked at Chevron as well several weeks ago. Uh, and again, you see here all of the strength as far as our predicted moving average and also this neural index at the bottom. And, of course, more importantly, those predicted highs and lows. You see a very similar price action here Monday, scooting down to this predicted low. Oftentimes, I, uh, mention we see these moves on Thursday and Friday when all the price action is bullish towards the end of the week. We tend to reset going into the new week. Uh, but very clearly very bullish movements here. Uh, and even just the past couple of days, we’re moving down, this would have been Wednesday into Thursday, from predicted high to predicted low, uh, and continuing that bullish uptrend that we’re seeing across the energy space.
So, uh, again, nice opportunity here in Chevron. Very similar chart, about a 38% move in about 63 trading days. Uh, and then last week we
Permian Resources ($PR)
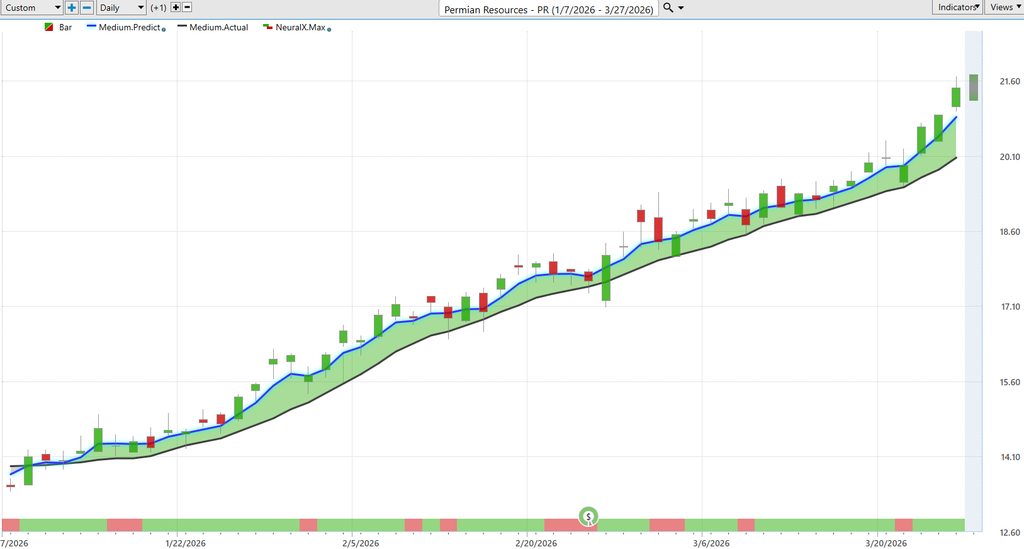
Also looked at Perian Resources, and again we look at those predicted highs and lows, and you see very clearly here identifying some areas to accumulate a position, numerous opportunities as the energy space has remained in an uptrend. So very clearly here you see pretty much about once or twice a week getting some levels moving down to those predicted expected levels from vantage point, uh, and then that trend continuing towards the bullish side. So really nice opportunity here in Perian Resources, again overall of about 53% in about 52 trading days.
Now what’s important for traders, obviously, whether you trade energy stocks or whether you trade ETFs that model the commodities or you’re trading other stocks, we want to identify when things shift in the marketplace and
Danaher ($DHR)
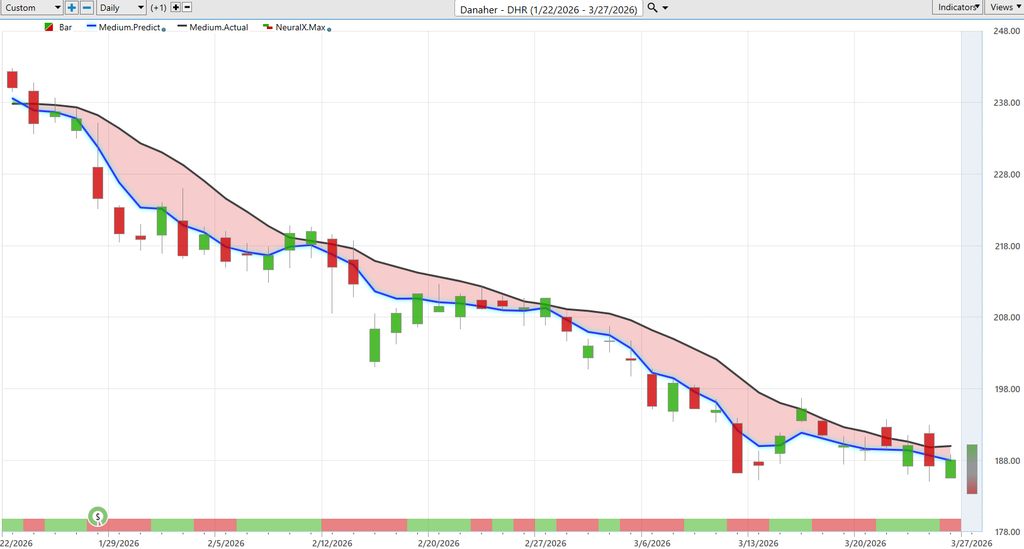
What sectors things are shifting in. Uh, and so we actually have some, uh, tools available within Vantage Point called the Intelliscan. So we can actually scan the broader market and identify, hey, what type of stocks are in these uptrends, uh, and seeing bullish signals from the vantage point predictive indicators, uh, and what markets and areas of the market are quite weak.
So here we have healthcare, uh, Boeing, uh, building, uh, and consumer staples here, and we really just see that all of these areas are quite weak. And so you really just hone in on that narrative that, look, the stock market is very vulnerable and weak here outside of energy. And so if you want to set up your portfolio to essentially be long energy, short some equities, you know, that seems to be the most appropriate play here.
But again, we see this overall trend to the downside and these levels from predicted highs and lows and also the neural index doing a great job of assisting the trader if they want to get some bearish exposure in the marketplace. Uh, so here we see shares off of DHR, uh, pretty considerably here and still in a downtrend. So this is really the issue here is we’re still seeing a lot of volatility in the markets. Uh, here shares off about 21, almost 22% in just 44 trading days, and we see those numerous opportunities to short up towards those predicted highs. Uh, and clearly not an area where you’d want to be long. Uh, here’s Boeing. Very similar picture. Blue line below the black line. A lot of separation between
Boeing ($BA)
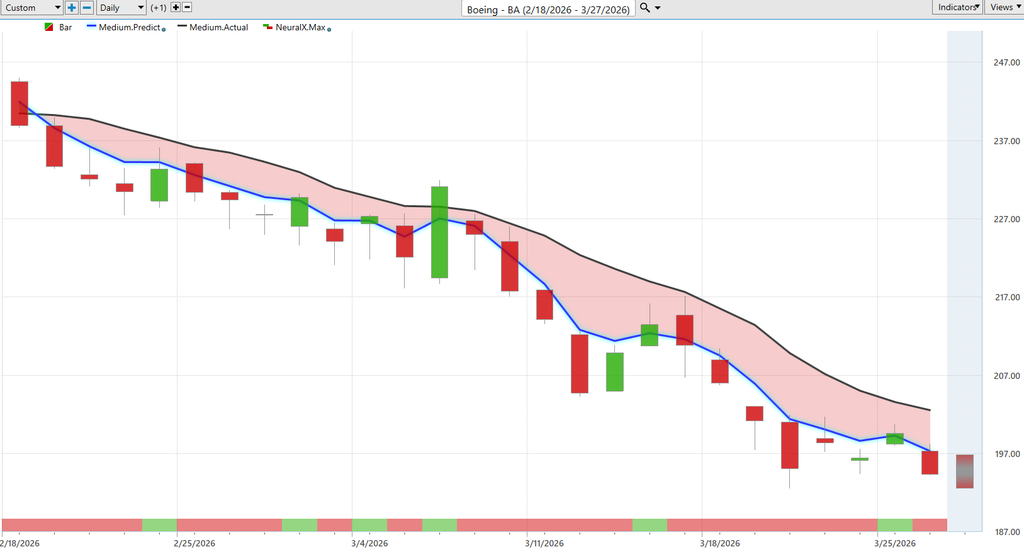
Those predicted values and the actual values. Uh, you’ll get these periods where the neural index starts flipping up to a bullish configuration. You see you get this consolidation, some gap ups and moves higher. Uh, but very clearly the market is still solidly in downtrend, not even getting close to that blue line getting above the black line. Uh, and here we see shares of Boeing down about 17, 18% just in the past 26 trading days.
So really exciting moves to the bearish side, and again a lot of volatility that traders can take advantage of, whether on the bullish side like those energy shares or shorting. Um, certainly being cautious, uh, for any bullish opportunities in the stock
Toll Brothers ($TOL)
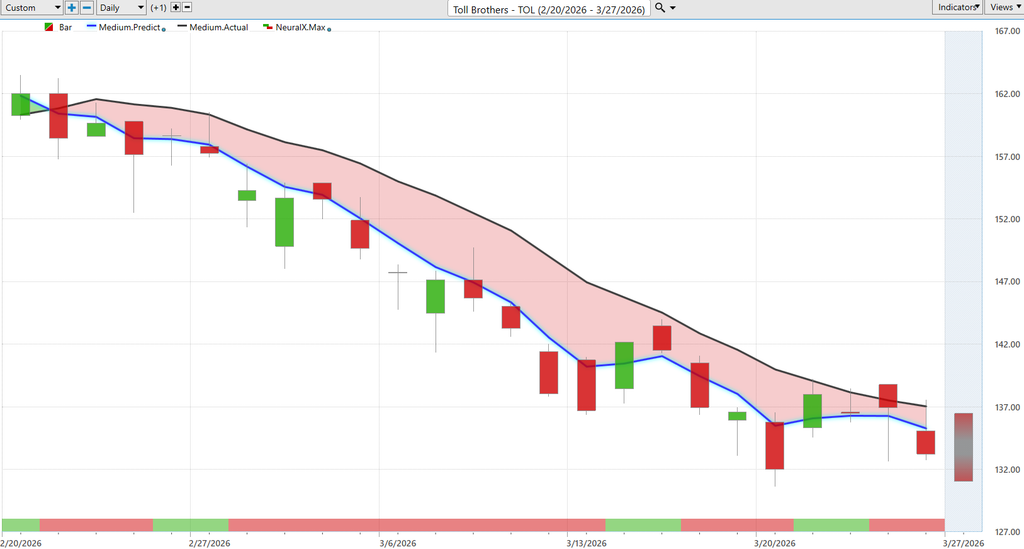
Market. Uh, here’s Toll Brothers, and this has just been an area where, again, you see a lot of weakness, uh, and things like LAR, Dr. Horton, a lot of the building material companies, uh, here in Toll Brothers as well. You see market moving into a downtrend. Again, the neural index very, very short term, right? So it’ll warn you of subsequent price strength just over the next 48 hours.
But what is your overall game plan, right? Are we getting long, getting short? Well, clearly predicted moving average is very bearish here. Again, you see some gap ups in the market, some sideways price action, but that predicted moving average remaining solidly below the actual moving average. So, uh, shares off about 16% here in just about 23 trading days. And again, we see that whole sector quite weak here.
Uh, certainly that trade-off as well of just energy prices affecting the broader stock market. And that’s what really goes into these predictive tools, is understanding, okay, well, what are the positive catalysts, right? How are those intermarkets, uh, potentially identifying trend shifts early in the market, but how are those variables also potentially weighing down on the stocks where you’re doing some analysis and attempting to trade.
Pepsico ($PEP)
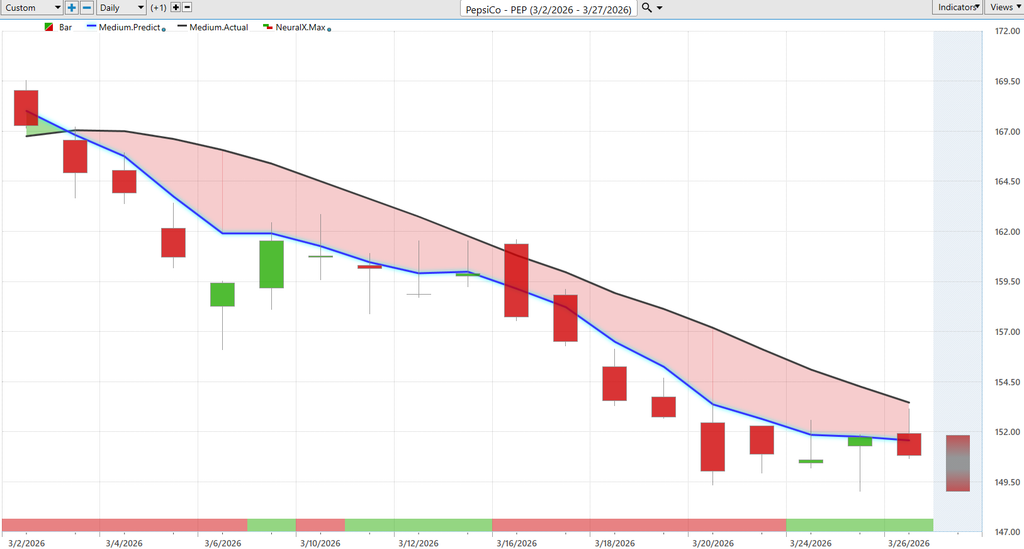
So again, shares off about 16, 17% just in the past month here. Uh, and lastly here, PepsiCo. So, we looked, uh, really a couple months ago, we had things like Proctor and Gamble, Coca-Cola performing very well. You actually had consumer staple space really outperforming along with utilities. And what’s interesting is now you’re not seeing that.
And so there’s really not many places where we’re seeing strength at all in the market outside of energy. Uh, and we see even those consumer staples and utility stocks that had been performing well, clearly blue line below the black line, neural index bearish, at this sideways consolidation, but very clearly, I mean, a great, uh, forecast here where you see short-term strength but the overall trend is bearish.
And so you understand that, look, if you’re doing anything in this market, you want to be looking up towards these predicted highs to set short positions, uh, and we see that trend resuming to the downside again here just this week, moving up towards those predicted highs but not much further, uh, before the continuation of the down move.
So, we’ll see how much of this continues. Um, like I mentioned, we’ve got a lot of just that geopolitical risk driving things, but this is where Vantage Point tools really get you ahead of things early and those intermarket relationships, whether they be again positive or negative catalyst, giving you those clues into where price is likely to head next.
So, we’ll go ahead and leave it there for today, but once again, this has been the Vantage Point AI hot stocks outlook for March 27th, 2026. Thank you all for watching. Best of luck out there and bye for now.


