


Register for a Free Live Training
The Hot Stocks Outlook uses VantagePoint’s market forecasts that are up to 87.4% accurate, demonstrating how traders can improve their timing and direction. In this week’s video, VantagePoint Software reviews forecasts for Cubesmart ($CUBE), Atcore ($ATKR), Service Now ($NOW), Roper Industries ($ROP), Ovintiv ($OVV), Williams Sonoma ($WSM),
VantagePoint A.I. Hot Stocks Outlook for March 6, 2026
Hello again traders, and welcome back to the Hot Stocks Outlook for March 6, 2026. Hope you all have had an excellent week out there in the financial markets. As always, we’re here to take a look at the most recent VantagePoint A.I. predicted forecast. So, if you haven’t already, be sure to go ahead and click the link down in the description below and you get signed up for a live demonstration. Learn all the specifics about how these predictive indicators and technologies are helping traders make much better trading decisions out in the marketplace.
And so, we have a highly volatile market. Some markets doing well, some doing poorly. Really creating a lot of anxiety out there around some of the tensions geopolitically. And so we’ll go ahead and start out here with shares of Cubsmart because this is a really great example of how all of these predictive tools work together, really regardless of the markets that you decide to trade.
Cubesmart ($CUBE)
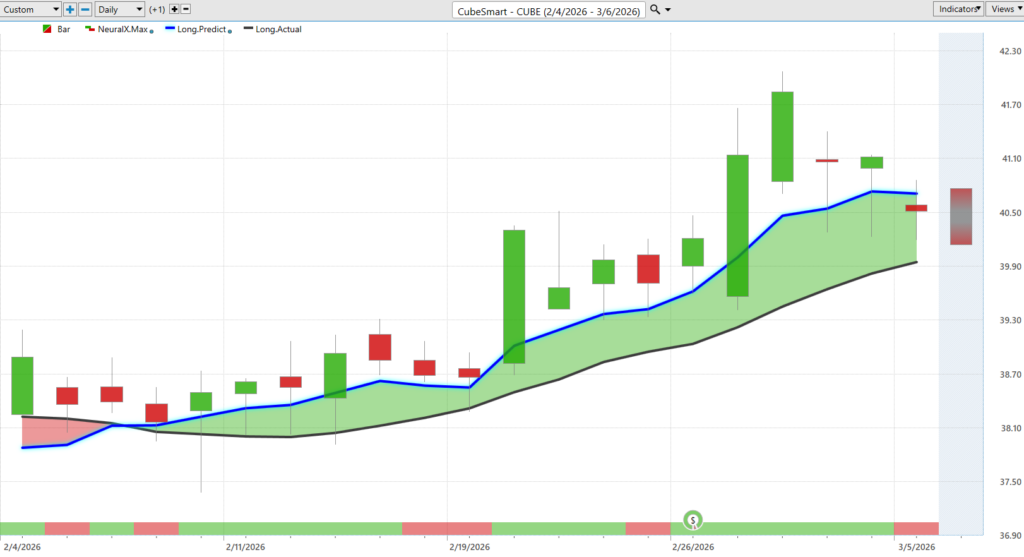
And so what we’re looking at here is daily bars and candles where each one of those candles will represent a full and complete trading day. And it’s right up against all that price data. You’re going to notice that there is a black line and also a blue line value. And so what the black line is is actually a simple moving average, or what we refer to as the actual simple moving average.
And for this number to get calculated, what this is is a 10 period simple moving average. Right? So it just takes the previous 10 closed prices. It’ll add those all together and then divide by that number. And what you get is really a rolling record of what’s already occurred. Right? All of this data really just comes from the past, those previous close prices, and has no predictive capability.
So what VantagePoint traders are able to do is use this as a baseline and compare it to the proprietary predicted moving average, this blue line that you see on the chart. So for this number to get calculated and plotted every evening, well this is where the technology of artificial neural networks come into play.
And they’re performing what we would call intermarket analysis. And so what that means is that rather than just looking back at price past prices just reconfiguring what’s already occurred in this single market, what VantagePoint’s A.I. tools are doing is doing what’s called intermarket analysis. And so what that means is it’s looking at dozens of other markets that are known to drive and influence the future price of Cubesmart ($CUBE).
So this can be things like individual stocks. This can be things like ETF groups that wrap up a broad section of the market. But that really takes this global. It’s going to look at global interest rates and the bond market. It’s going to look at global currencies as well as potentially global commodities like gold and right now oil obviously having an effect on individual equities and the broader stock market at large here.
So it’s really taking this global approach understanding how these subtle relationships can lead to some valuable price clues on to where things are headed next. And so whenever we see that blue line cross above the black line what’s suggesting that these average prices are going to start moving higher.
And we see here in Cubesmart ($CUBE) that we’ve gotten a nice lift and an uptrend about 6%. Not a huge move as we’ve seen really the market’s very sideways. A lot of selloffs in some of the tech areas of the market here. But again regardless of the market you’re trading we can utilize these tools.
Now at the very bottom of the chart you also see this bar that goes from green to red. And this of course gets updated every single evening. But it’s important to understand that this is also utilizing those neural network technologies but they’re solving a different problem for the trader and that is short-term strength or weakness in the market.
And so I wanted to bring this example through to really highlight that we may get that blue line above the black line signaling the overall trend is bullish but notice when that neural index goes bearish the sort of price action you get 48 hours later. Again here you see lower lows over the next 48 hours but the overall trend is still bullish. You’d still want to be a buyer if you’re a short-term day trader or a swing or position trader.
Again you see here the neural index goes bearish. We get some lower lows over the next couple of trading days. Neural index bearish here through earnings a gap down before the resumption of trend.
And so when traders can take this and combine it with tools like the VantagePoint predicted high and low. Again this is utilizing that artificial neural network technology but now solving intraday price level problems of where is market likely to trade in the next day or two so that you can set limit orders and profit targets.
And so we can of course look back and see well how accurate are all of these predictions on the actual trading day right? So here’s our prediction for today. Here’s the previous predicted high and low levels and those are all provided before the market opens the night before at about 6 PM.
And you see how this works. If you have limit orders waiting down at these predicted lows you see how effective this is at identifying solid intraday price levels to accumulate a position because last thing you know trading on a couple days like this you know do you want to be buying up at this level or wait for the market to move lower really offering the best opportunity.
Again you see here moving down to these predicted lows gapping up gapping down getting bid up. And again here notice how these long wicks but still closing right at that predicted low for the daily time frame.
So it’s a really great example here of how all of these predictive tools work together.
Atcore ($ATKR)
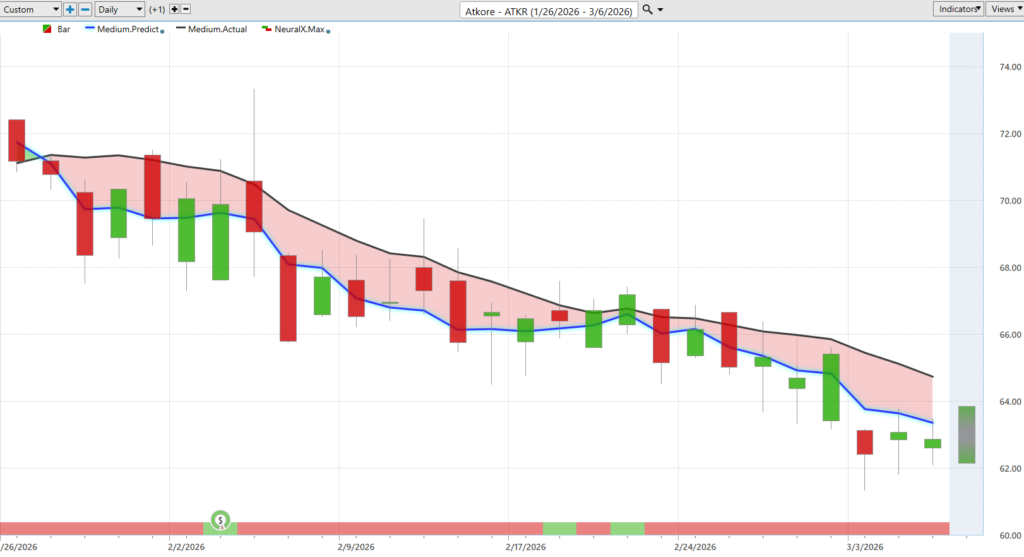
Then of course traders can take that information incorporate it into opportunities within their portfolio. Here’s Atcore ($ATKR). Good example here. We have earnings right here a few days into the downtrend here but notice what we get here.
Here that neural index goes bullish. You actually get a huge move higher through earnings but the overall trend that blue line still well below the black line.
Again you see the neural index bullish here. You get sideways price action but the trend is still bearish. So you have all of these neural network artificial intelligence tools really doing their job so that traders can make a wise decision.
So here we see in shares of Atcore ($ATKR) shares off about 11.6% just in the past 27 trading days. And of course those predicted highs and lows again giving you really valuable levels to make trading decisions.
So you see once you get through earnings predicted highs doing an excellent job pretty much the market just intraday poking above those levels and then resuming that downtrend. So really nice move lower here in shares of Atcore ($ATKR).
Service Now ($NOW)
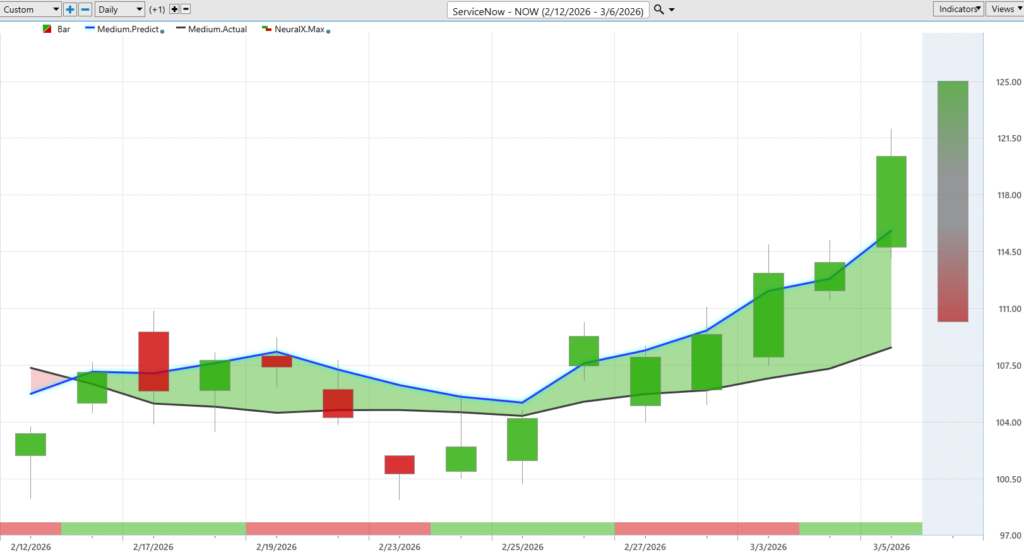
And now let’s look at where things actually get a little bit interesting. So coming into Friday we had some not so great news and jobs reports but you’re seeing a lot of volatility around the NASDAQ.
Well here’s ServiceNow ($NOW). So a lot of these software stocks have really been beaten down these tech stocks. Here though you see that blue line above the black line.
And notice this the neural index goes bearish here. And look at that over the next 48 hours you’re certainly seeing that weakness but that prediction of the moving average trend is actually still holding on bullish here.
So once that neural index gets bullish again we actually see that strength kick into the market. Here you see neural index bearish you’re actually from this close you’re actually opening pretty much sideways there over 48 hours.
But notice that look you’re actually getting separation between that blue line and the black line signaling that hey this is a strong trend. And you see getting a very strong push in prices here in shares of ServiceNow ($NOW).
So over this overall trend here we’re about 13% almost 14% just in the past 13 trading days. And again you’ve seen certain software stocks actually starting to recover here.
Roper Industries ($ROP)
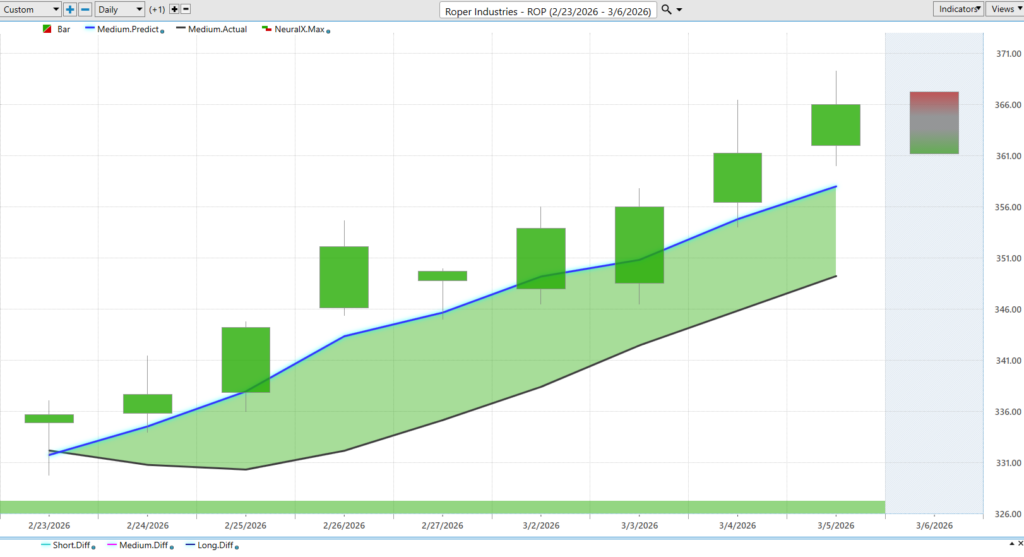
So here’s Roper Industries ($ROP) blue line over black line and just look at this forecast right neural index bullish the entire way through here.
So while we’ve seen a lot of weakness across the tech space and certainly across some of the software space here Roper Industries ($ROP) very strong forecast.
We see from those crossovers you’re looking at the market up about 9% just in the past eight trading days and it gives traders a good opportunity to really hedge the portfolio have some longs potentially have some shorts and sort of balance things out and take advantage of where these opportunities are opening up.
Of course we’ve got our predicted highs and lows. You see moving down to this level about 346 a couple of times here on the gap down now trading up about 366.
Ovintiv ($OVV)
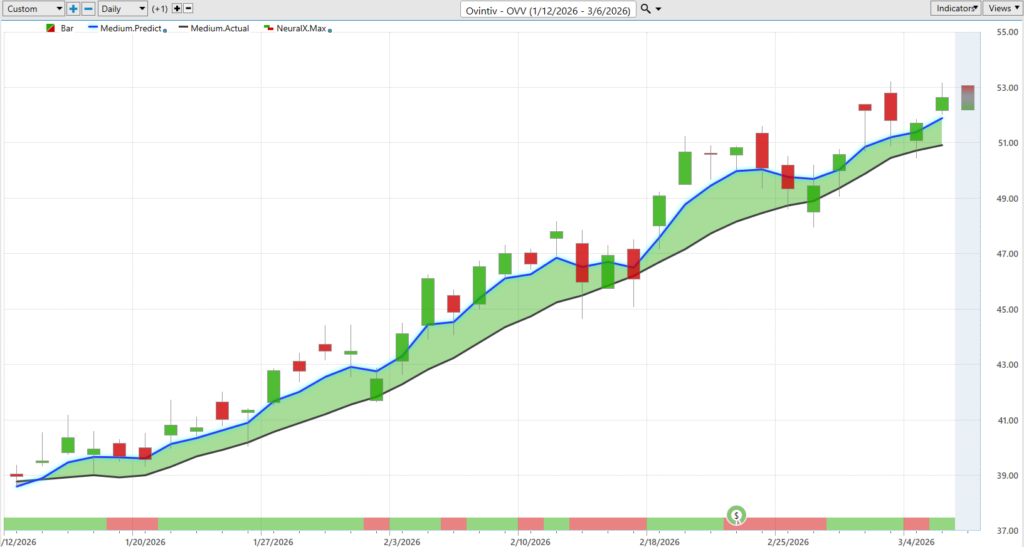
And shares of Ovintiv ($OVV) here. Energies obviously a place that’s doing very well off of a lot of this news. I think we looked at this actually a few weeks ago but here you see very clearly blue line over black line.
Of course you’ll get these periods where that neural index goes bearish and you see that sideways price action little consolidation here after earnings. But overall the trend very much bullish here and offering up levels where traders can accumulate a position.
Here you see actually gapping down to this previous predicted low level probably through a weekend there. So you get some really advantageous levels to really pay attention to on the chart if you want to accumulate a position participate in an uptrend here.
So of course we see oil going higher here and some good opportunities even this past week. Buying down here towards 51 and seeing the market recover pretty quickly up about 3.8% and of course on Friday energy is going much much higher here.
So overall got a very nice push here in shares of Ovintiv ($OVV) going all the way back to about 35 trading days. Markets up about 32%.
Williams Sonoma ($WSM)
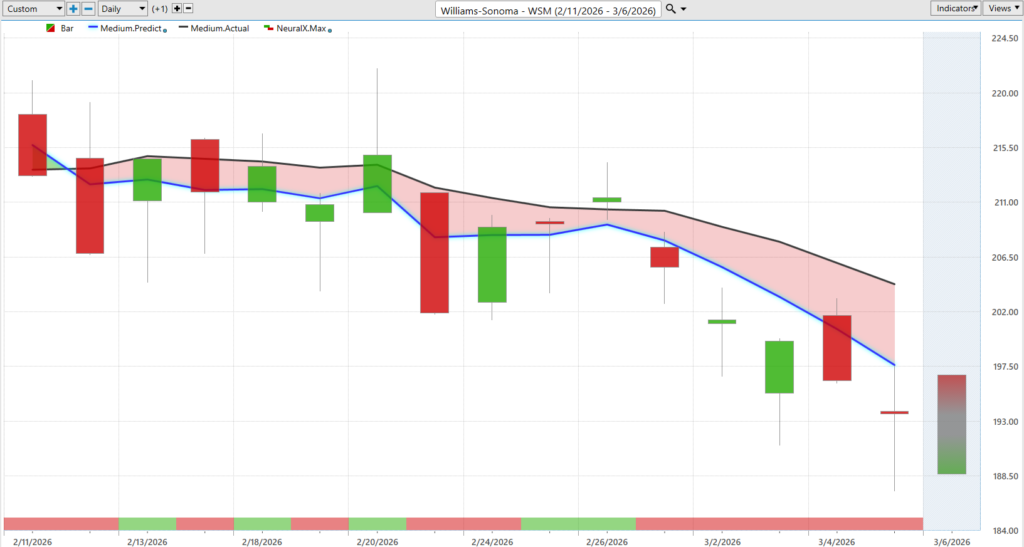
And lastly here William Sonoma ($WSM). So we actually got some weakness in retail sales here.
Really for the past 3 weeks William Sonoma ($WSM) that blue line has been solidly below the black line. You get a little bit of conflict here right that neural index bullish neural index bullish.
And you see how what are you getting? Well sideways price action but skewed to the bearish side where you’d want to be shorting and taking profits on short positions if anything.
And of course we can use those predicted highs and lows as always offering up some really great levels to short take profits on short positions.
And we see that downtrend resuming. So even just this past week there’d be Monday Tuesday Wednesday and now we see Wednesday really offering up the high of the market right at that predicted low and that downtrend continuing here.
So really solid stuff out of the VantagePoint forecast.
But of course traders need to be ahead of these moves. So as we see a lot of volatility kicking into shares you really need the tools that are going to allow you to skew those odds into your favor make sure you’re on the right side of some of these markets like ServiceNow ($NOW) they’re starting to move higher but very defensive on some of the broader market that’s been moving lower and where we’ve seen some weakness here.
So go ahead and leave it there for today but once again this has been the Hot Stocks Outlook for March 6, 2026. Thank you all for watching. Best of luck out there and bye for now.


