


Register for a Free Live Training
The Hot Stocks Outlook uses VantagePoint’s market forecasts that are up to 87.4% accurate, demonstrating how traders can improve their timing and direction. In this week’s video, VantagePoint Software reviews forecasts for PowerShares $QQQ ($QQQ), Centene ($$CNC), Amazon ($AMZN), Kopin ($KOPN). Vishay Intertechnology ($VSH), Atkore ($ATKR), Nucor ($NUE), Microchip Technology ($MCHP)
VantagePoint AI Hot Stocks Outlook for May 1, 2026
Hello again traders, and welcome back to the Hot Stocks Outlook for May 1st, 2026. I hope you all have had an excellent week out there in the financial markets, and as always we are here to cover the most recent VantagePoint AI predictive forecast.
So, if you haven’t already, be sure to go ahead and click the link down in the description below and get signed up for a live demonstration where you’ll learn how all of these predictive indicators and artificial intelligence technology is helping traders make much better trading decisions out in the marketplace.
And so I thought it would make sense to just take a quick peek here at the broader stock market via the Q’s or the NASDAQ.
PowerShares $QQQ ($QQQ)
And we’ve highlighted this over this past several weeks, both in the spy and the Q’s, all the way back here at the beginning of the month where we recognize that, look, the market is starting to turn higher. This is where traders can look to start taking those bullish trading opportunities.
And of course that roadmap provided by our predictive highs and lows really offered some excellent entries to participate in this really nice rally. And so what this information helps traders do is identify that, hey, there’s a lot of markets actually creating fresh signals through these predictive indicators.
And so it’s through this Intelliscan feature that traders are actually able to set this all up, really set up a process for yourself and identify, hey, where is the market starting to shift to really help improve that timing and then narrow in on some individual opportunities, which we’ve also gone ahead and highlighted in these previous weeks.
Centene ($$CNC)
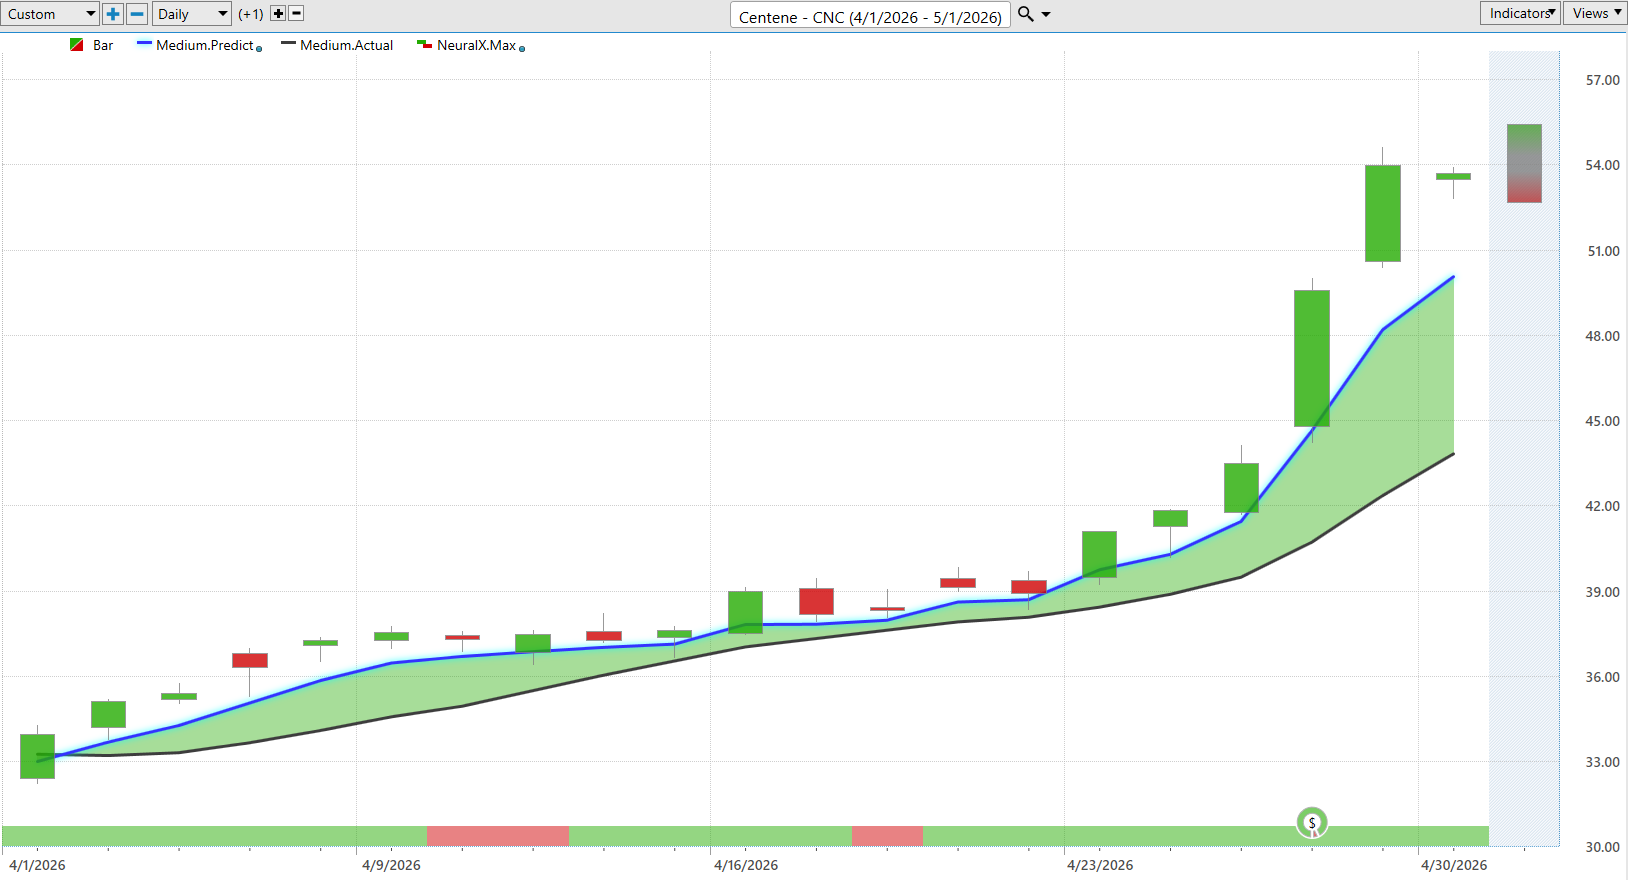
Another individual stock here where we have all of these predictive tools looking very bullish. But how does this work on a day-to-day basis?
So now of course what we’re looking at here is daily bars and candles. All these predictions work off of that end-of-day data. And the first thing that we want to understand is what this black line and blue line values are on the chart.
And so what the black line is is actually a simple moving average. So this is a very common technical analysis indicator. In this case it’s a 10 period. So it just looks at the previous 10 close prices, adds them all together, and then divides by 10.
And really the weakness with traditional technical analysis like this is that all of this data really just comes from the past. It’s already occurred and has no predictive capability. But VantagePoint traders are able to use that as a baseline and compare it to this proprietary predicted moving average highlighted by the blue line.
And so whenever we see this blue line cross above or below the black line, what’s suggesting average prices are going to start moving higher, and that’s where traders can look to take a bullish position in the market.
Now it doesn’t just arrive at that like traditional technical analysis by looking at past prices. This is where the technology of artificial neural networks come into play. And they’re performing what we would call intermarket analysis.
And so what that means is that rather than just looking at past price data, VantagePoint is looking at the data from dozens of other markets that are known to drive and influence the future price of, in this case, our target market.
Now this can be things like the broader indices. This can be things like ETF groups and even other individual stocks that show an important correlation. That could be a positive correlation, inverse, leading, or lagging relationships.
And this is where artificial intelligence has an edge, taking in huge amounts of data and generating highly accurate predictions. But it’s not just confined to things like the US stock market. It looks globally at things like major currencies, global interest rates, and even major commodities where applicable.
And we’ve seen a lot of movements in the broader commodity space around energy and oil. But how does that factor in specifically to the markets that you’re trading? Well, that’s where you want a tool that really figures out what’s important here.
And so as long as that blue line in this case stays above the black line, well it’s suggesting that these average prices are going to start moving higher and traders can look to take a long position. You see shares up about 56%. So obviously these individual names can outperform the index here on the same 20 days moving up about 56%.
But that’s not the entirety of our predictive forecast. We also have this bar you see at the bottom of the chart. It can go from green to red, back to green.
Well, this is updated every single trading day, and it’s tuned to solve a different problem, and that being just short-term strength over the next 48-hour window. This is an extremely accurate indicator that gets this right via geopolitical risk, Fed announcements, earnings reports.
So when you start to see some potential weakness inside the trend, you understand, hey, the trend is up here, but expect the market to run a little sideways. You see this selling pressure coming in over the next couple of days, but you see quickly as it gets bullish again.
Well, 48 hours later, what’s happening? The trend is continuing higher. And of course, lastly included in all of this, we have our VantagePoint predicted high and predicted lows.
Well, 48 hours later, what’s happening? The trend is continuing higher. Uh, and of course, lastly, included in all of this, we have our VantagePoint predicted high and predicted lows. So now we’re down to intraday price action that traders can use as a road map to go ahead and execute their strategies. And so this is what’s so exciting about this is as we look back and say, well, how accurate are all of these predictions against the actual market data? Uh well, if you want to go ahead and trade that crossover, get a a really core position established, that’s fine. Uh but then you have this road map that really says, “Okay, well down to intraday price levels. Where do you want to be focused in on to potentially scoop up some shares, potentially add to an existing position, uh and really see how this works?” You get about five entries here before this momentum really kicks in. Pretty much a straight bullish forecast here for about the last 10 trading days. Uh and you see as we go through earnings, the market propels higher. Uh moves into that 56% profit uh on the upside here.
So now we’re down to intraday price action that traders can use as a roadmap to go ahead and execute their strategies. And so this is what’s so exciting about this.
Kopin ($KOPN)
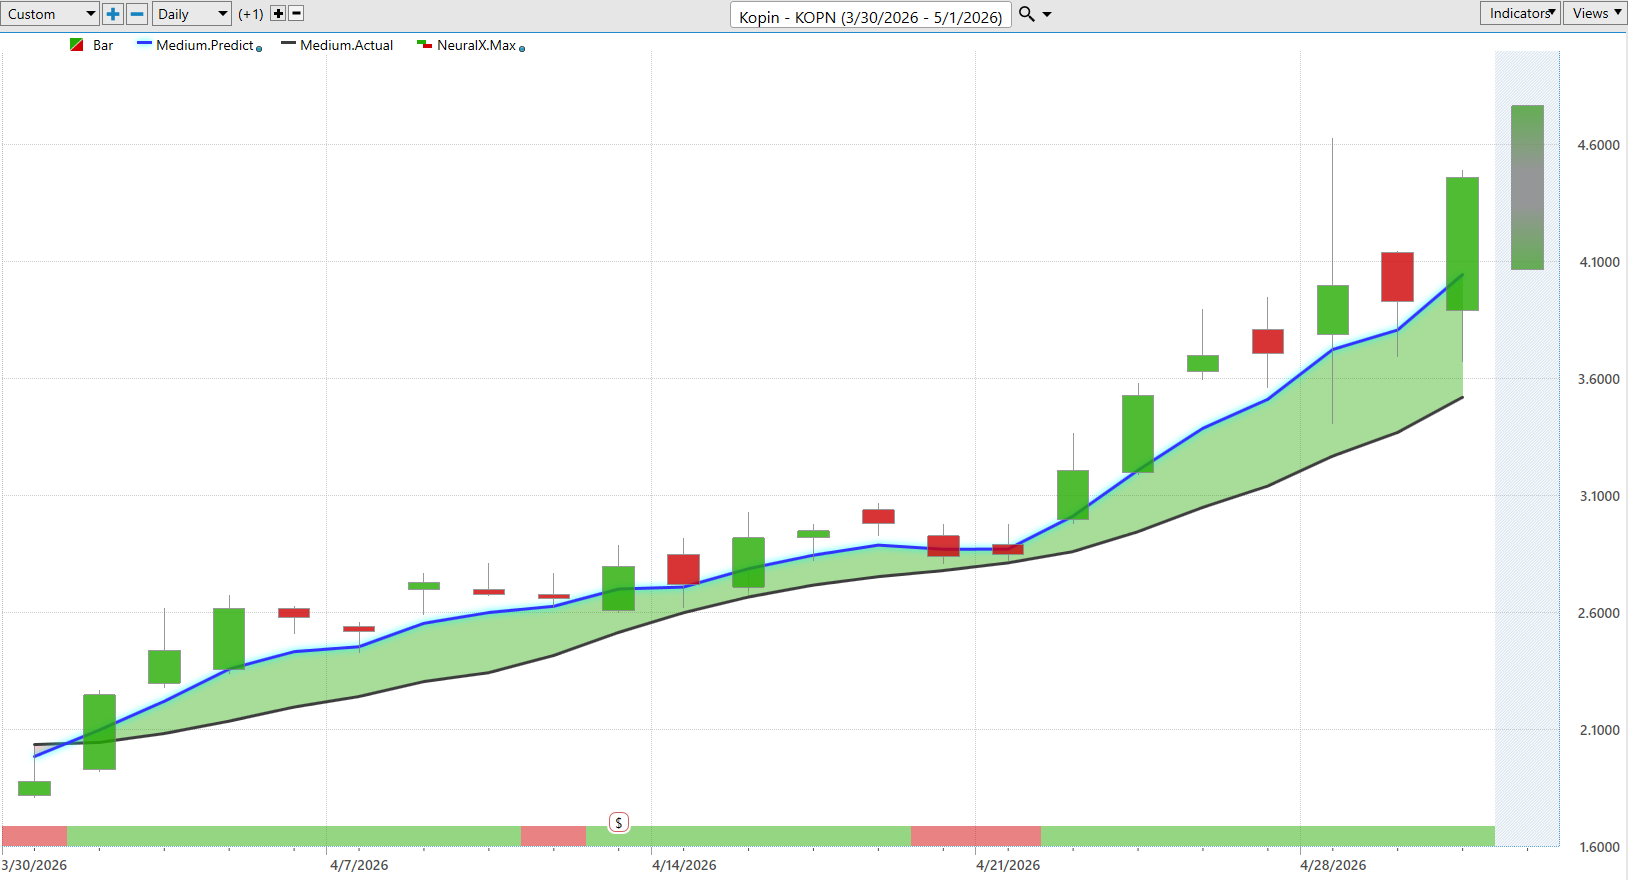
Now let’s move forward to Kopin because it’s the exact same thing. We recognize, hey, there’s strength across the broader market.
And sometimes these lower price stocks can offer some really nice trading opportunities even with a relatively modest position size. So we see that blue line crossing above the black line.
You actually see earnings here right in the middle of this move. And you see even through that, we get strength over the next couple of trading days. A little bit of weakness here, but overall the trend bullish.
A little bit of weakness here, but overall the trend bullish. Uh, and this is where again these percentage returns are pretty exciting here. About 105% rally here over the past 22 trading days. This hasn’t just been confined to tech. There’s just a lot of markets performing extremely well here. But 105% move there. And of course, if we want to bring this down towards those predicted highs and lows, well, we can see how accurate all of these predictions were before the actual trading day. And so, this is where this gets really exciting is we’ve got a new predicted high and a new predicted low. Well, those values are going to stay fixed. That’s the prediction. And then we’ll see the actual market data fill in and see how accurate today’s prediction is. But we see that going back does a very good job of identifying these very important trading levels even through volatility here. You see a big range day. But once it got down to that predicted low, that’s where we see the buyers come in. And even here as a day trade moving down to the predicted low and continuing that uptrend, that is a very, very strong move. Let’s just go ahead and take a look at this. just yesterday here. Uh market moving up another 17 was 18% into yesterday’s close.
And this is where again these percentage returns are pretty exciting here. About a 105% rally here over the past 22 trading days.
Vishay Intertechnology ($VSH)
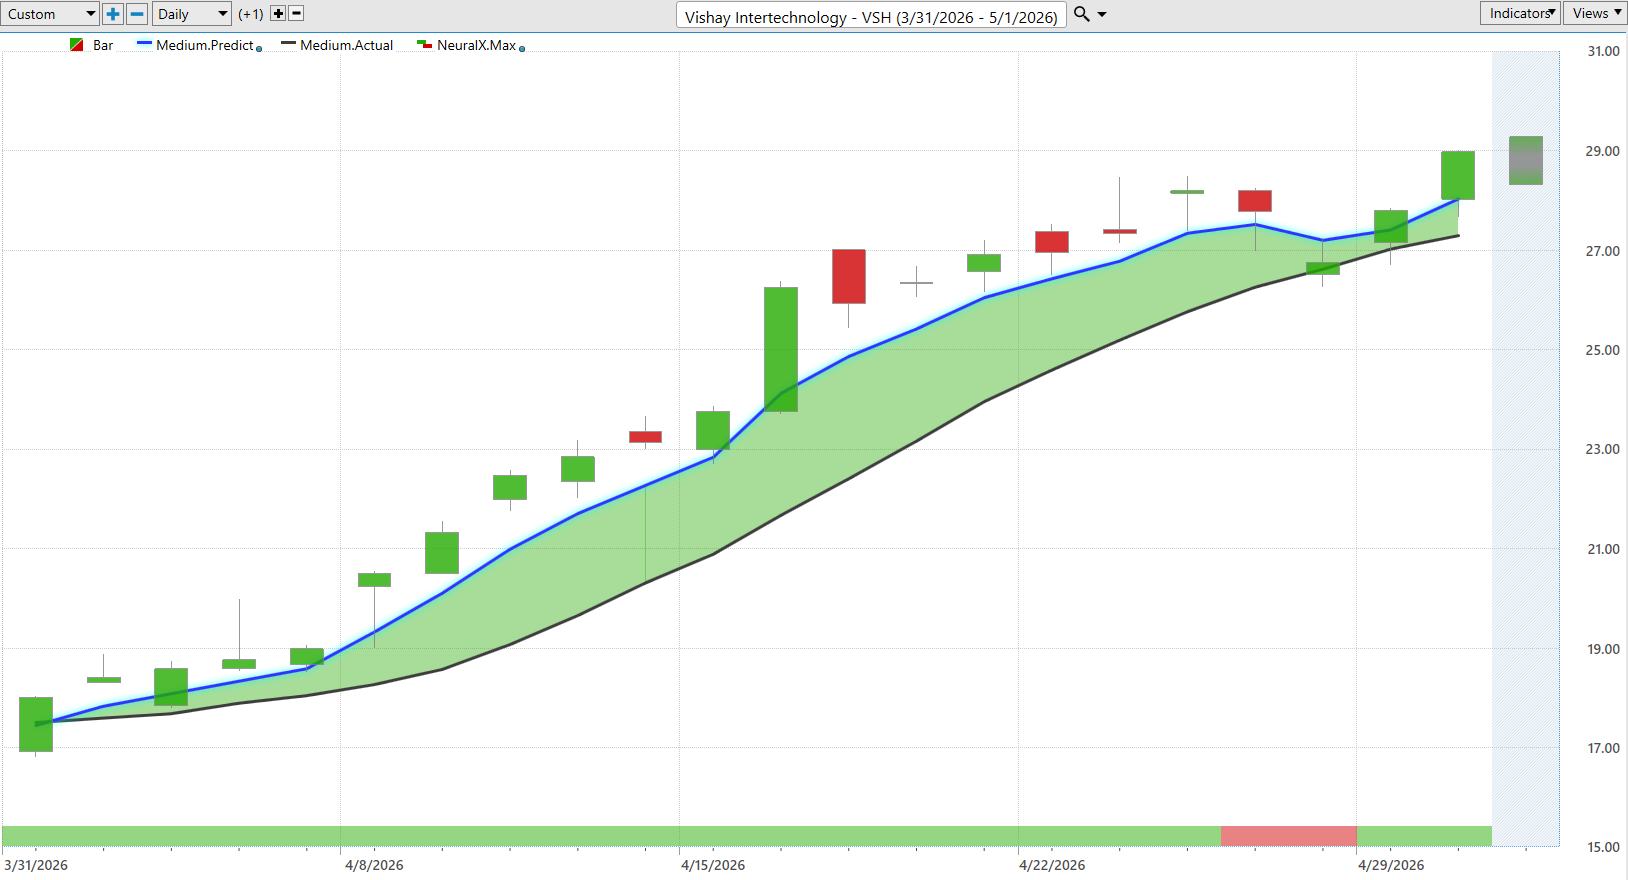
Here’s Vishay Intertechnology. Another tech stock. You see here blue line over black line coinciding with all this strength we’re seeing across the major indices.
And look at all this strength. Pretty much a completely bullish forecast until we get some lower lows over the subsequent 48 hours of trading. But the overall trend very, very bullish.
Well some lower lows over the subsequent 48 hours of trading. the overall trend very very bullish. Uh and I actually wanted to bring this through because even these predicted highs and lows sometimes when they look a little inaccurate like you see this market where we trade outside of the full range. Well, we see this all the time where when you get bullish price action especially towards the end of the week uh where we don’t have make any move towards that predicted low oftent times going across the weekend through that Friday period you see these levels get filled and that’s exactly what occurred here. So you see this going back to levels would have been last Thursday and Friday. Sure enough, gap down, but what happens after the gap? Immediate strength uh as we see the markets continuing to propel higher. So really nice move here in shares of Vshay. Uh up another 56% move here over the past 21 trading days.
Amazon ($AMZN)
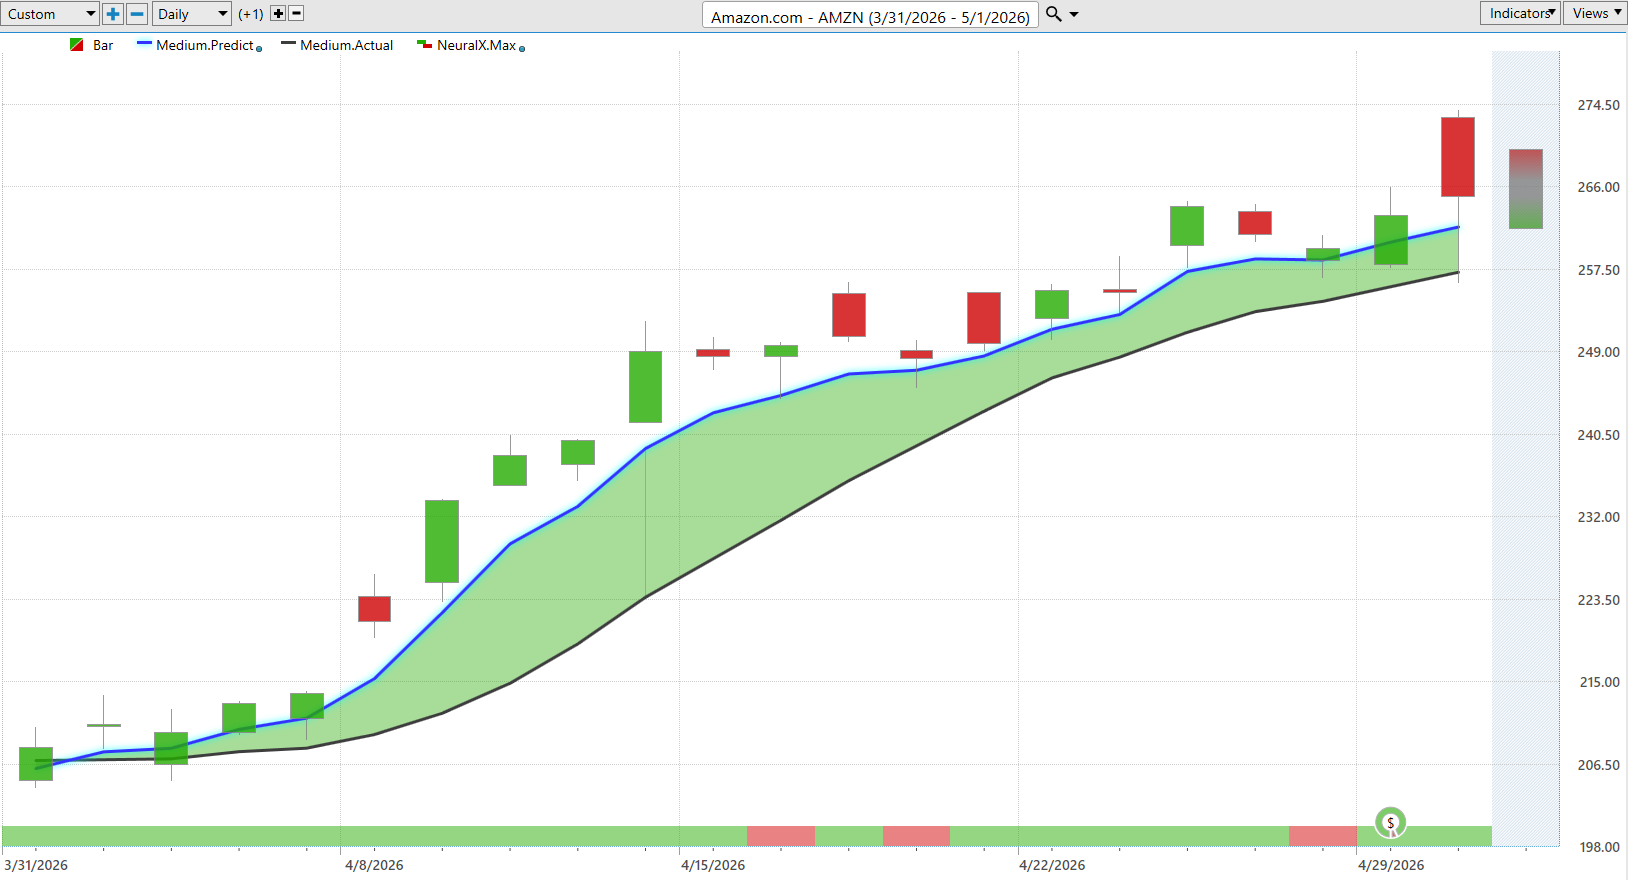
Here’s Amazon. Just a quick revisit. We saw Amazon go through earnings here.
And I just again wanted to highlight these predicted highs and lows. You see that even with all of this illiquid trading after the earnings report, traders rushing in there at the open trying to buy, while the market wants to go ahead and move down to this predicted low and then continue on its uptrend.
So really exciting stuff here again. And you see how these previous levels aren’t hitting. You see there’s a little bit of a dip going into the beginning of the week here, but overall these trends are bullish.
And so we’ve seen this in shares of Amazon, Nvidia, the broader stock market, and then those even smaller cap markets doing extremely well here. A 27% rally in just the past 20 trading days.
Atkore ($ATKR)
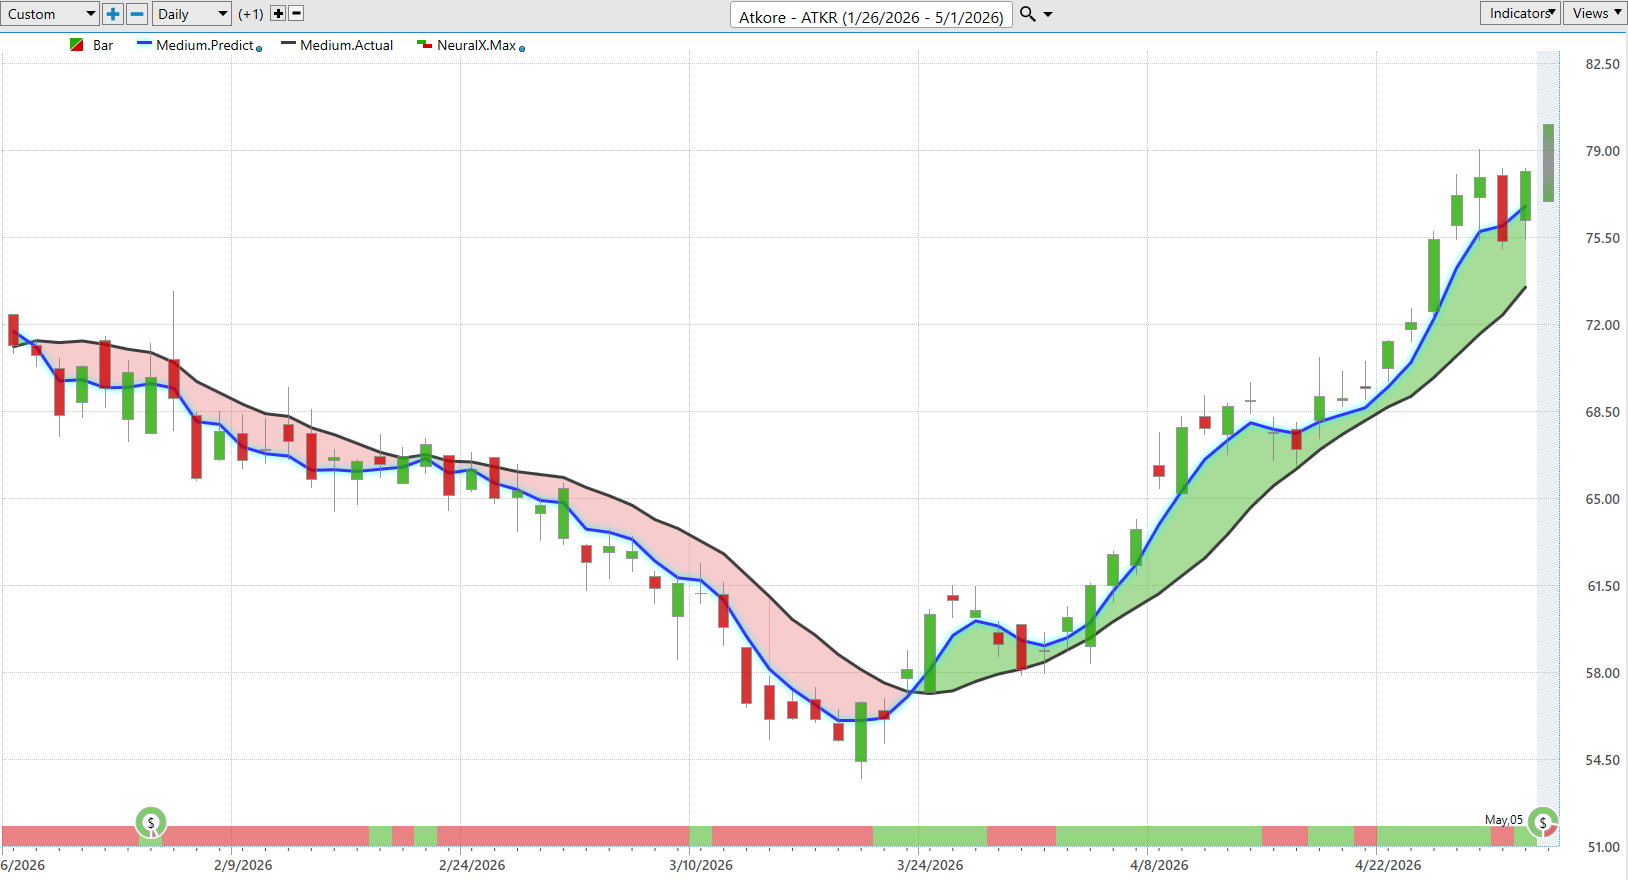
Here’s Atkore. I just wanted to highlight that it’s not just confined to tech. This is a material home builder-related company here.
But you see that when we had the market weakness moving into those lows, very clearly here what it looks like when the market is in a downtrend. And as the market propels forward, even through earnings, you see that this predicted high does a great job of pinpointing levels where all you want to do is short and take profits on shorts.
But as things shift, this is where tools like VantagePoint and Telescan really start indicating that things are starting to shift in this market and many tech stocks.
You get a couple of days of weakness here, but overall the trend here very much in a bullish uptrend going into earnings next week. Uh we really see how all these levels work very early on saying look expect the range to go lower. Mind you, you have all these levels before the trading day. And that’s obviously the important part that you have this information in advance. Uh can set limit orders, really have a game plan going into that next trading day. And we see here that shares really, you know, overcoming that downtrend in pretty short order here up about 36% after a couple of months of some really terrible price action. But really nice move there in shares of at core. We also seen things like invitation homes do really well. So again, it’s not just these tech stocks, but here we see microchip. Well, a lot of tech stocks here, blue line over black line. Neural index very bullish. You see this neural index gets bearish warning you, hey, expect some lower lows over the next trade a couple of trading days, but that very quickly corrects and we see that momentum and uptrend.
Microchip Technology ($MCHP)
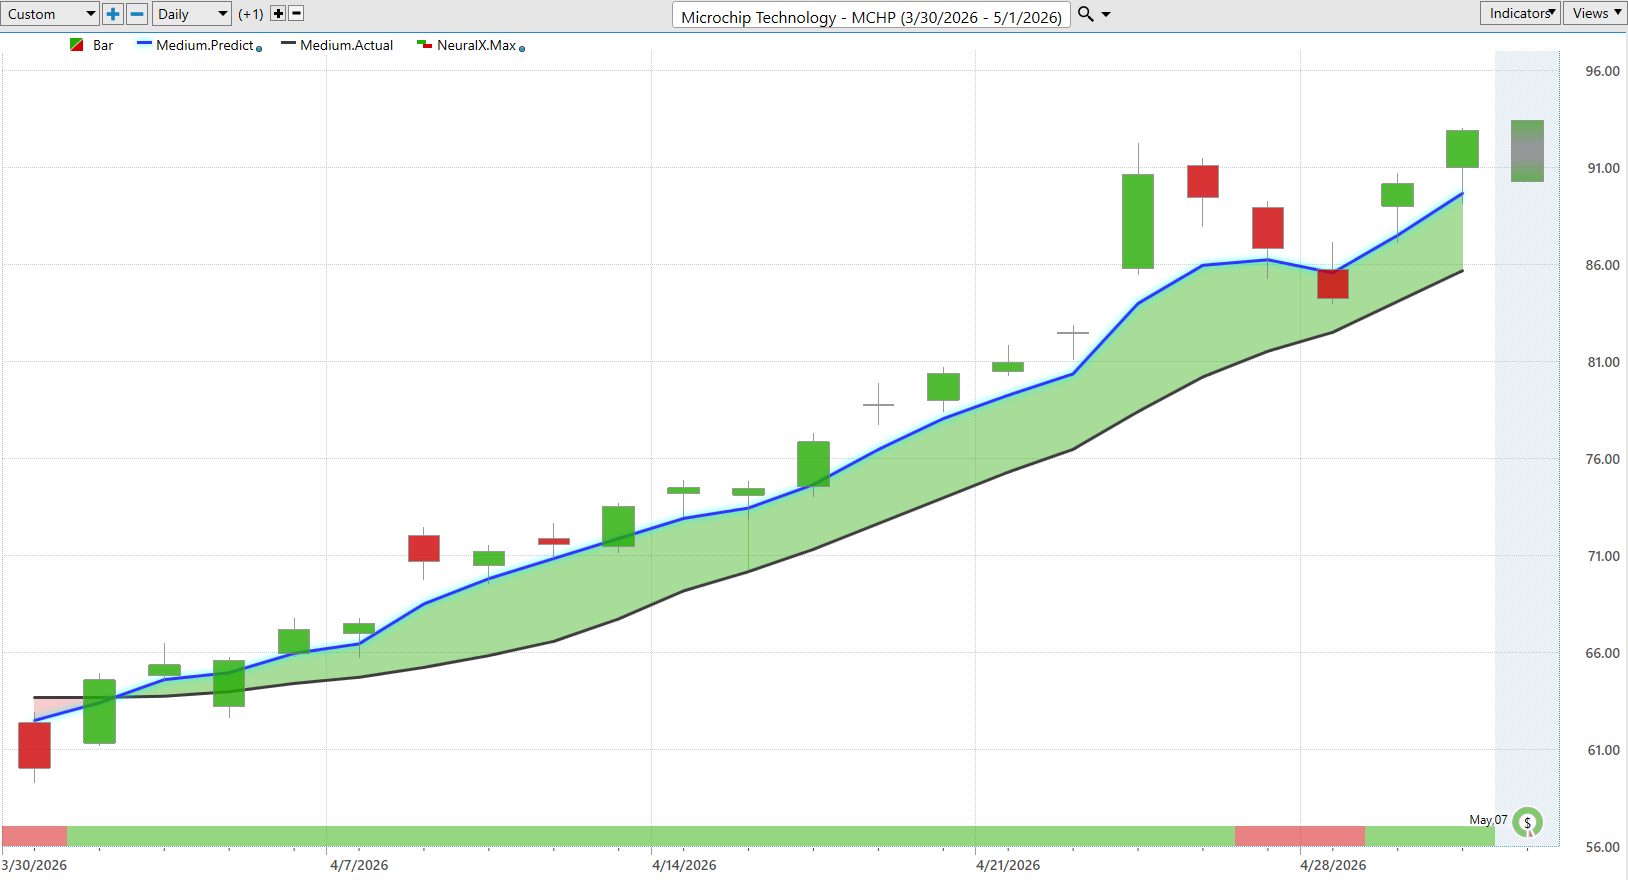
Here we see Microchip Technology. A lot of tech stocks here. Blue line over black line. Neural index very bullish.
You see this neural index gets bearish, warning you, hey, expect some lower lows over the next couple of trading days. But that very quickly corrects and we see that momentum and uptrend continue here in shares of Microchip Technology.
And so again, we can see just how accurate all of these levels are for traders, really helping you get involved in the trend early and take on this volatility.
Nucor ($NUE)

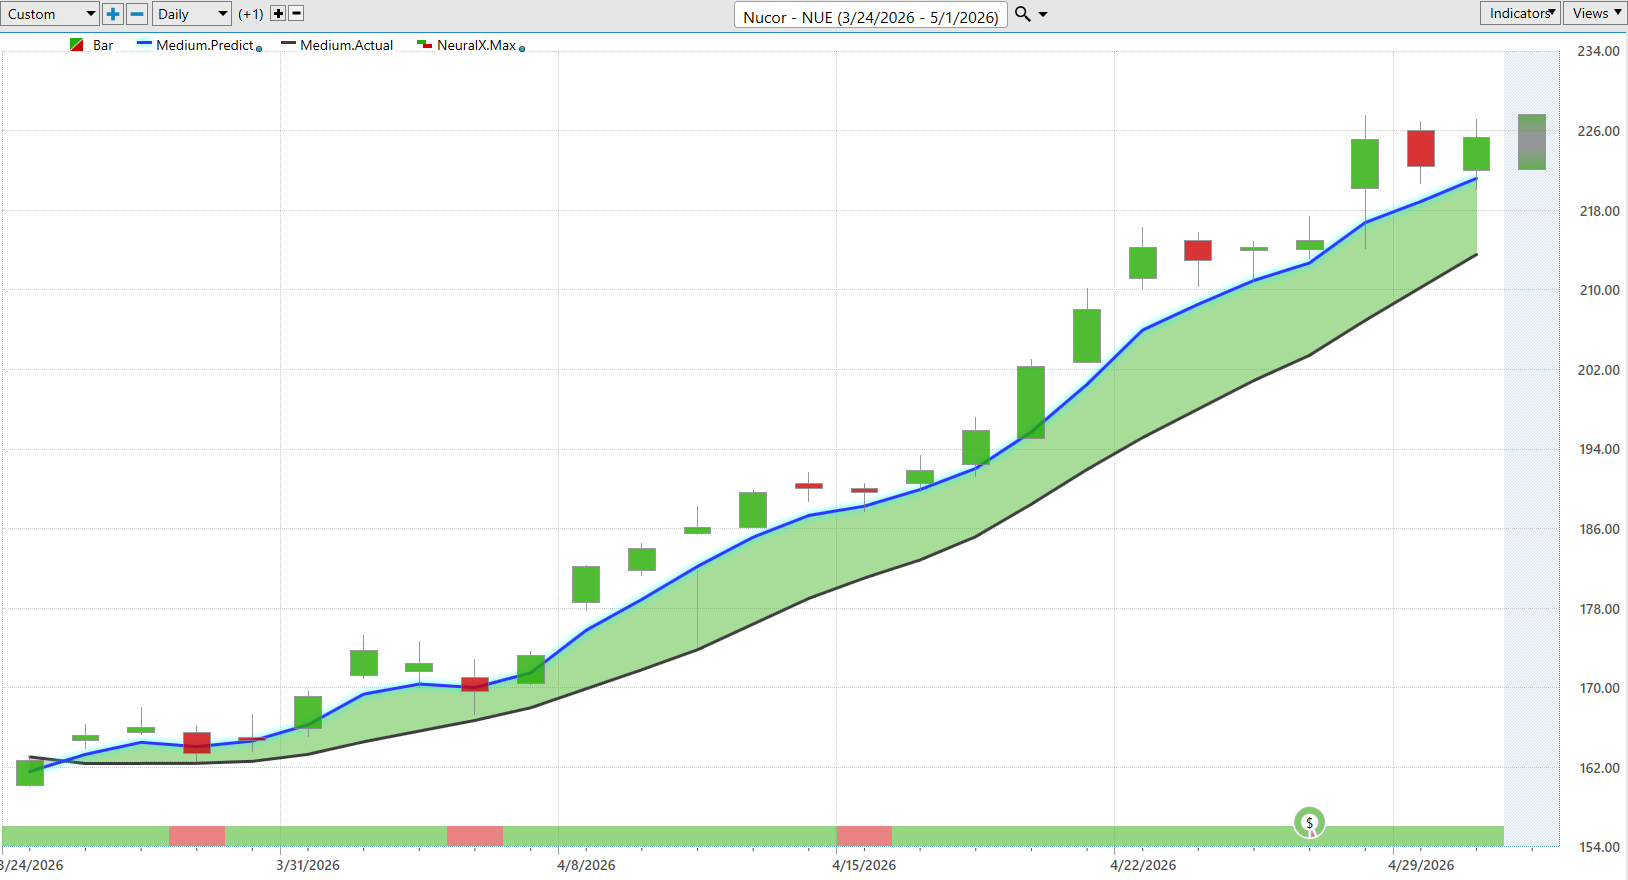
Lastly, Nucor. I always like to bring in very recent stocks we looked at last week. And again, this is even through earnings.
So even with all that volatility, you’ve got a very bullish forecast here. Really only a couple of trading days where the neural index even got down to that red configuration, but you see within a day moving back to bullish and then the uptrend resuming.
And again, you see this gap up in the market. A lot of traders potentially chasing that trade. Well, look how the market just wants to come back in, fill the range, and then continue on that uptrend.
So it does a very important job here getting traders prepared for that next trading day, staying very patient, and then really knowing how to stick with a game plan as all this technical analysis is really handled for you.
Once again, this has been our Hot Stocks Outlook for May 1st, 2026. Have a great rest of your week. Thanks again.


