Welcome to the Artificial Intelligence Outlook for Forex trading.
VIDEO TRANSCRIPT
Wisdom Tree US Dollar Bullish Fund – $USDU ETF
Okay, hello everyone and welcome back.
My name is Greg Firman and this is the VantagePoint AI market outlook for the week of April the 20th, 2026.
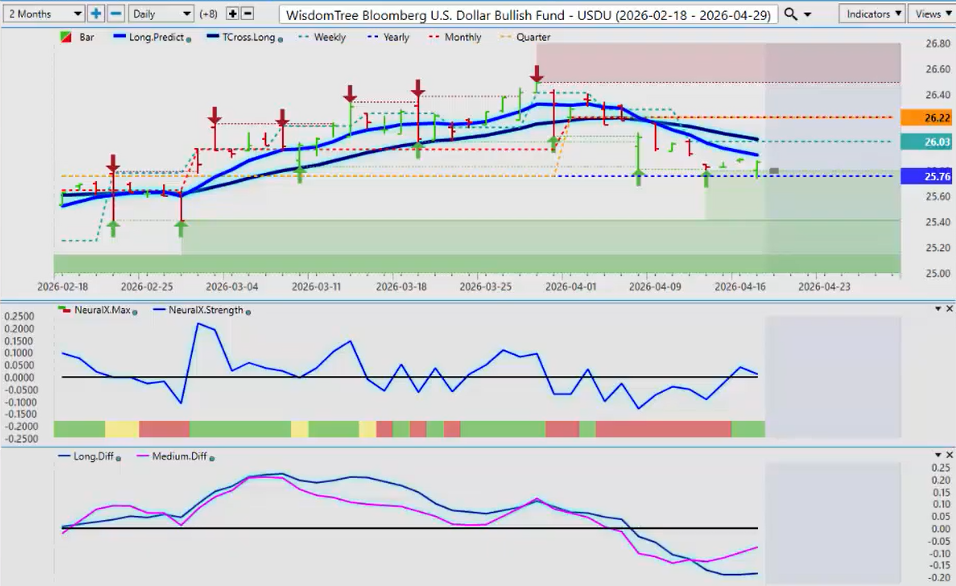
Now, to get started this week, we’ll begin where we always do with that very important US dollar index. Now, bit of an anomaly this week. We’re going to look at a broader look at the US dollar via the ETFs and on the futures side. So, the USDU, we’re sitting just above the yearly opening price. We have an MA diff cross and again this is pointing towards some type of dollar strength. Now the straight of Hormuz my understanding is it’s closed again. Tensions are escalating. So that does support fundamentally for the dollar to move higher. Now when I look at the UUP which is the dollar bull fund, it too remains above the yearly opening price.
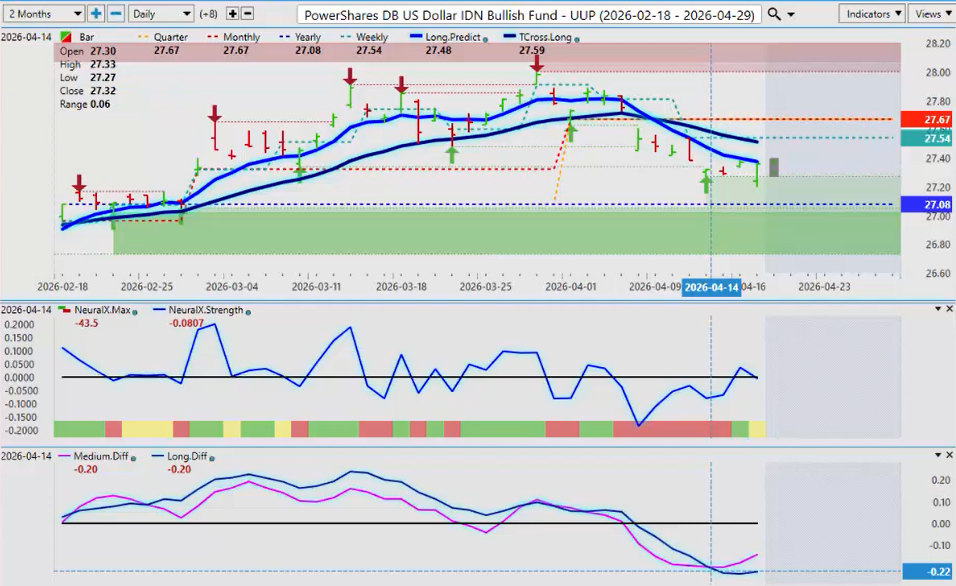
It too also has an MA diff cross to the upside with the neural index turning green. So again what the anomaly that I’m seeing in over the last week or two is the dollar bear fund is also above its yearly opening price. This is a new one. I haven’t seen this one before not or at least not in a very very long time because one is a bear fund one is a bull fund. They can’t both be positive here guys.
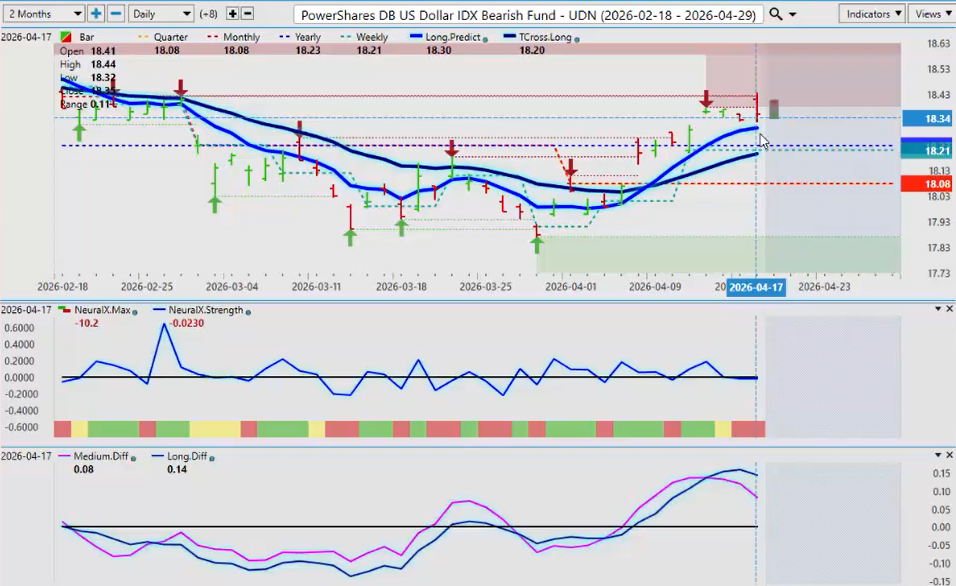
So I think the warning sign with that same MA diff cross to the downside is indirectly supporting dollar strength. Now if I do a quick look at that via the cash price it has slipped below the yearly opening price. So again, a very mixed bag, but even on the cash side, the VP is basically saying there’s going to be some type of, if nothing else, a corrective move higher on the dollar potentially as early as next week.
Gold ($XAU/USD)
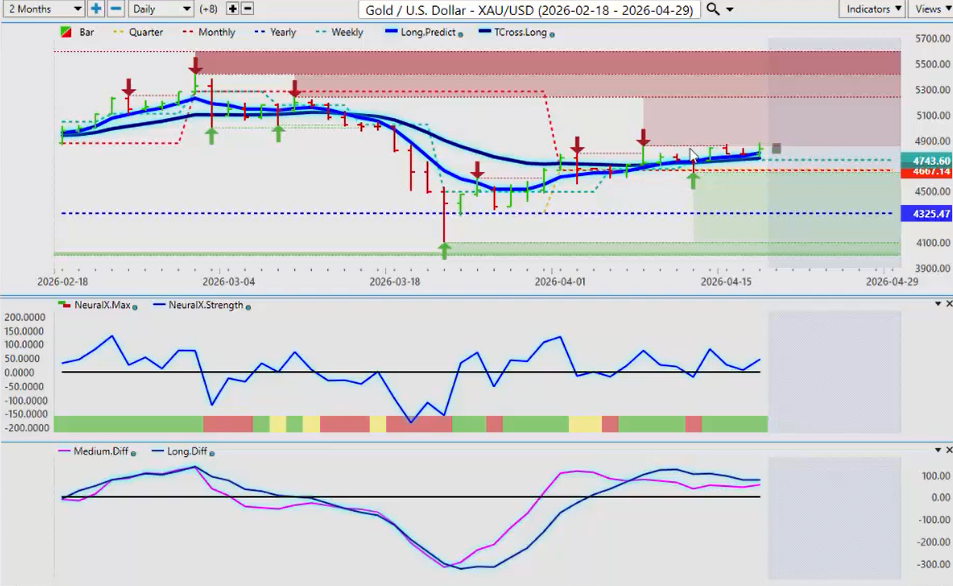
So with that said, we want to take a closer look at gold. With gold next week, this is a very solid structural bias for the upside here. We’re above the yearly opening price at 4325 but we’re also above the quarterly opening which is very important 4667. Now we have our TCross long at 4761. So that is the first level of support. The quarterly is the second and the yearly is the final line in the sand. So right now the indicators in VP remain net bullish but again we could see some dollar strength coming which could push gold down but that would only be corrective in nature.
United States Oil ($USO)
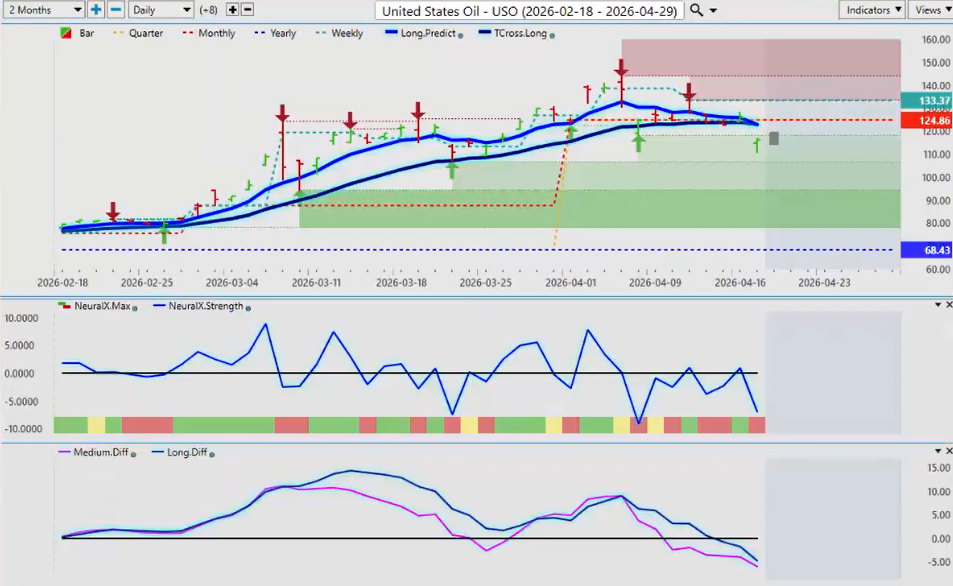
Now again looking closer at oil prices going into next week I suspect that oil prices could move back to the upside as early as Tuesday Wednesday. So, we’ve broken down below the quarterly opening price on USO, but we’re still firmly above the yearly opening at 68.43. So, if we can get back up above the TCross long at 12285, this bull move in oil is likely to continue.
Bitcoin ($BTC/USD)
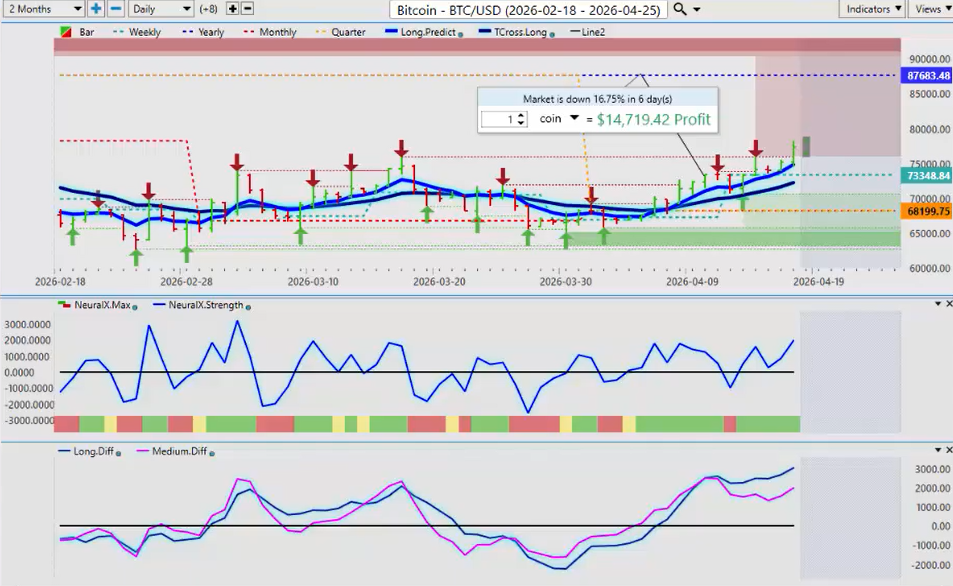
Now, again, with this past week, Bitcoin has fared very well. But that likely is going to come to an end as early as next week. Again, remember guys, we’re still in a downtrend in 2026. I do think the fourth quarter of 2026 will be very good for Bitcoin and 2027 will be very good, but it’s still going to struggle for probably a few months here. Now, if things heat up between Iran and the US, that would likely be what drives Bitcoin down next week. So, be very very cautious if you’re long right now. But on a positive note, we’re above our TCross long at 72,246 and we’re above our quarterly open at 68199. But I anticipate both of these two levels could be tested by midweek next week.
Russell 2000 Index ($IWN)
Now, how is all of this going to affect the equity side? While the equities have enjoyed a very strong move up under the assumption that the US, Iran, Israel, Lebanon, all this is going to get sorted out, but it’s certainly not looking that way over the course of the weekend here, guys. So, again, right now, I do anticipate that the S&P 500 is overstretched. We’re going to pull back, but the yearly opening price 68571 NRT cross long, that’s the key area to keep your eye on for next week. But there’s definitely a bearish tone to it. If I was looking at the spy’s, the NASDAQ, the Dow, etc. The Russell is still more attractive in my respectful opinion only than the S&P 500, the NASDAQ, and the Dow.
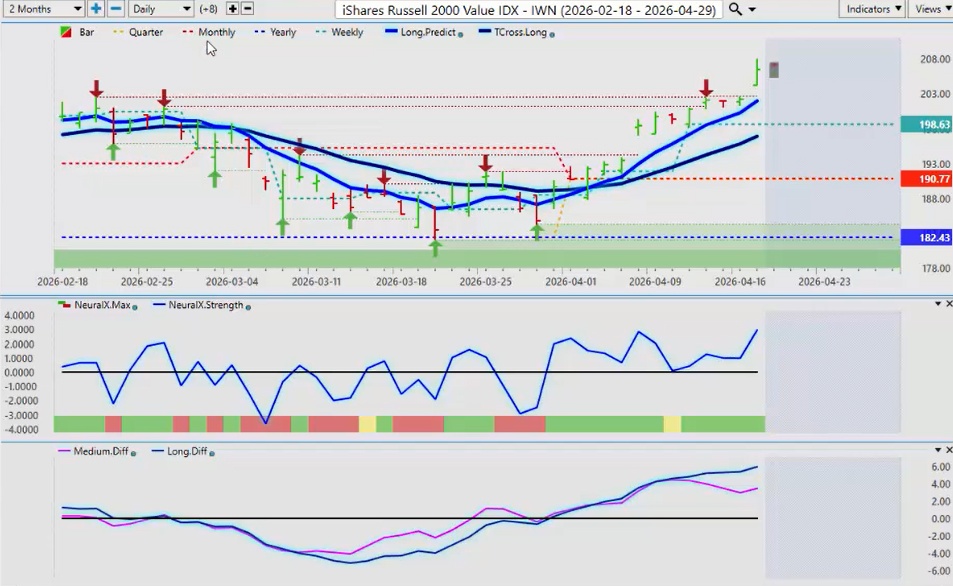
So if the global equity markets slide, I believe that the Russell is the better place to be long because again the structural bias we have our TCross long our long predicted here quarterly opening at 190 yearly at 18243. So again still bullish but we are likely to see a retracement at the first part of the week.
DAX
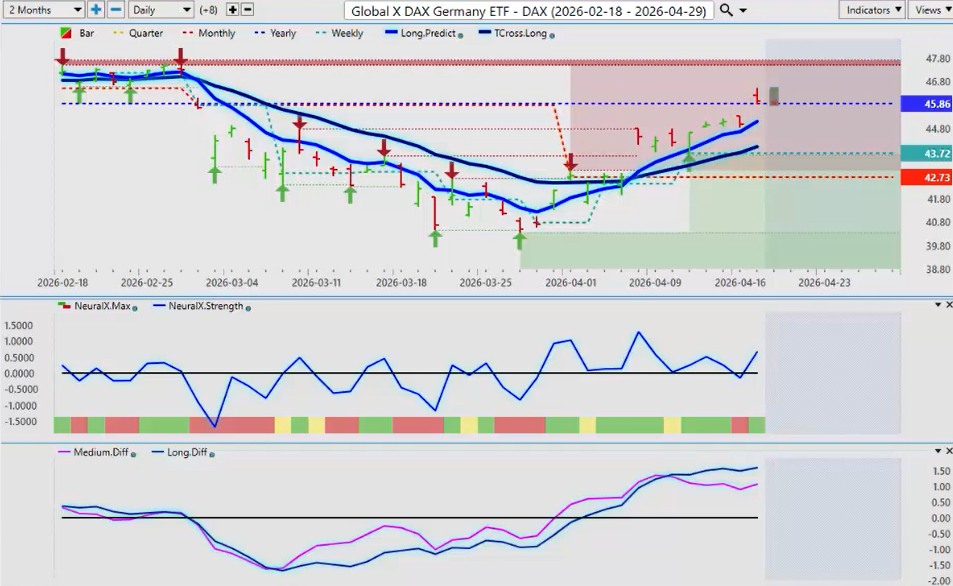
Now again with the DAX, the DAX has moved higher strongly with the euro currency very much like the Footsie and the British pound which we’ve been working on in the VP live training room. But now the question is can the euro and the DAX hold these gains? If things don’t settle down between Iran and the US then the answer is no. That fundamental will push both the euro lower and it’ll push the DAX and the Footsie lower also. So, we want to look. We’ve got an MA diff cross from VP that occurred several days ago. I believe there’s something to this crossover to the downside, guys. So, be very careful up here. But for next week, the yearly opening price on the DAX is your critical level. 45.86. I believe the futures side is going to be very, very choppy.
Volatility Index ($VIXY)
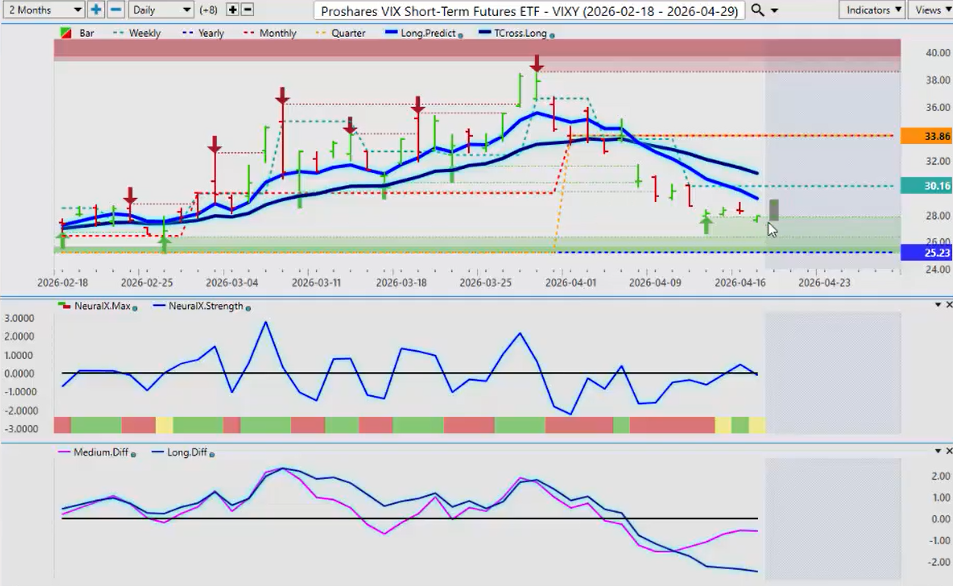
Now again looking at that VIX for next week the VIX pushing down towards its yearly opening price 2523 the short-term VIX futures ETF that is but again an MA diff cross to the upside the pink line over the blue line is a warning sign that this is likely getting ready to turn back up. So if the global equities start to tank here guys then this is a great ETF to be looking at for next week.
Euro versus U.S. Dollar ($EUR/USD)
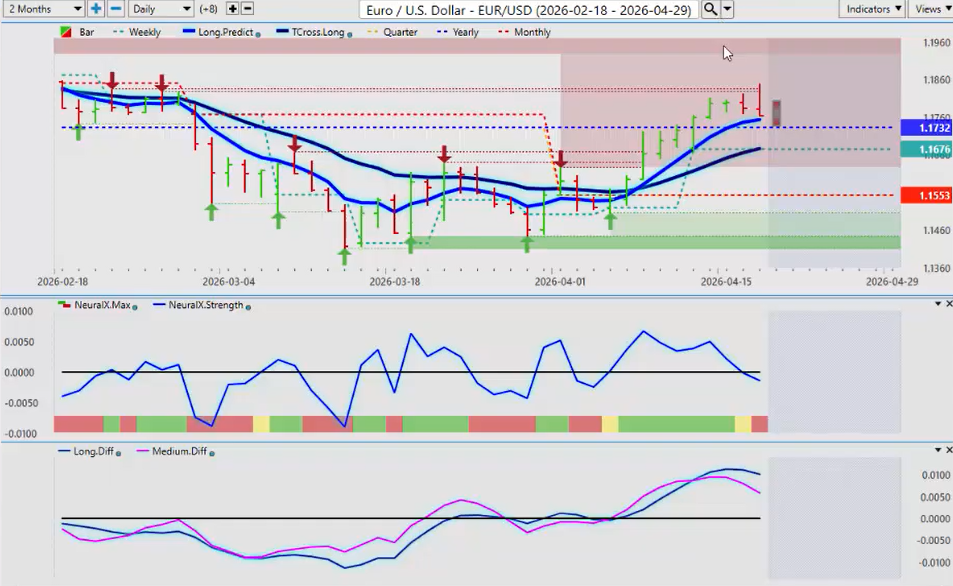
Now, as we look at some of our main forex pairs, all eyes will be on the euro here, guys. But once again, you can see it pulling back on Friday off these verified resistance highs going back into February of 2026. But again, if things fall apart with peace talks, then the euro is on its way lower. Guys, I believe that VantagePoint on Saturday evening is already giving us a warning sign before the market already opens. So, again, 11732, I believe, if nothing else, we’re likely going to retrace back to the VPT cross long at 11676, and we can reassess from there.
U.S. Dollar versus Swiss Franc ($USD/CHF)
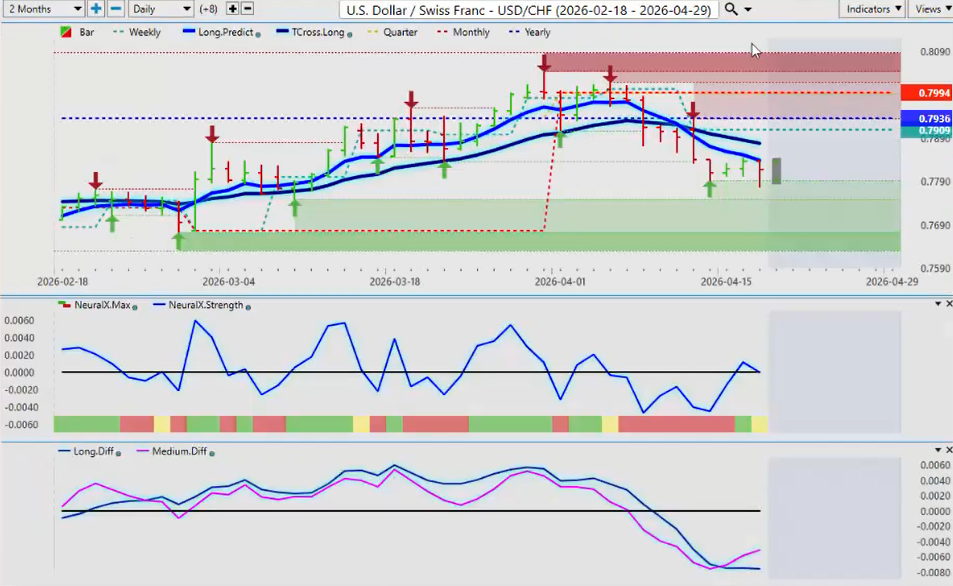
Now the US Swiss Franc again structurally it looks very good to the downside but that MA diff cross down here this is a reversal indicator in this particular case when we have the pink line over the blue line what that means is the medium-term trend is weakening against the longer term trend which is clearly down. So that tells me that we’re going to have a retracement back to our TCross long 7877. If we break through that, then we head back to the yearly and the quarterly opening. That’s entirely possible, guys. If we get a bout of dollar strength. So, and I think we get that either way at the end of the month.
British Pound versus U.S. Dollar ($GBP/USD)
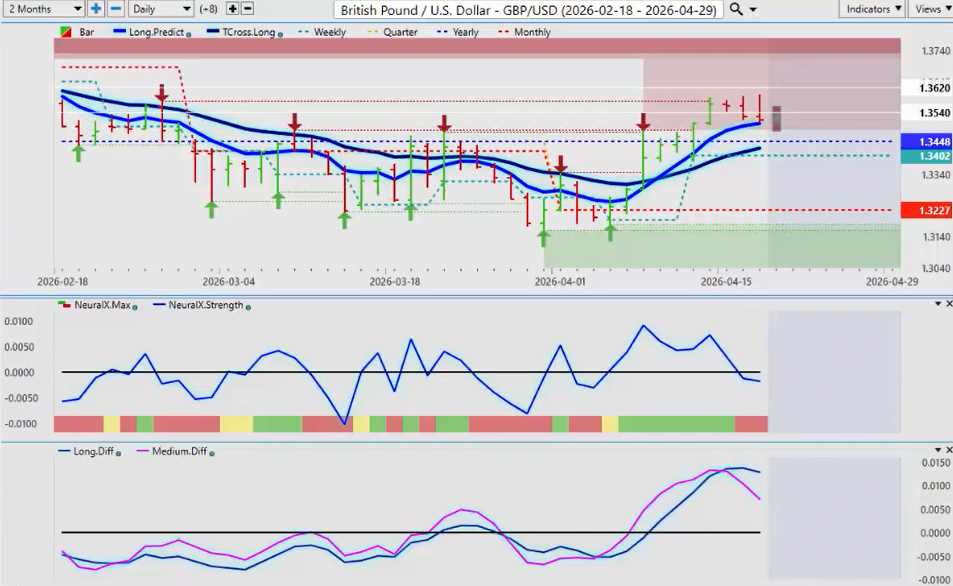
Now the pound dollar again like the euro has enjoyed a very strong move up from last week’s update but I don’t believe that this week it’s going to fare quite as well. I believe the pound dollar is actually on its way back down with the conflict reigniting again a very strong MA diff cross that is developing here before not after the market has made its move because again just a reminder guys this is an outlook for next week’s trading. It’s not a recap of something that’s already occurred in the previous week at the end of the week. Just a reminder. So again, resistance is building up here and fundamentals will be the driver, but the neural index is down. The neural index strength is down and a very strong MA diff cross, which again would tell me we this is a retracement back to 13425.
U.S. Dollar versus Japanese Yen ($USD/JPY)
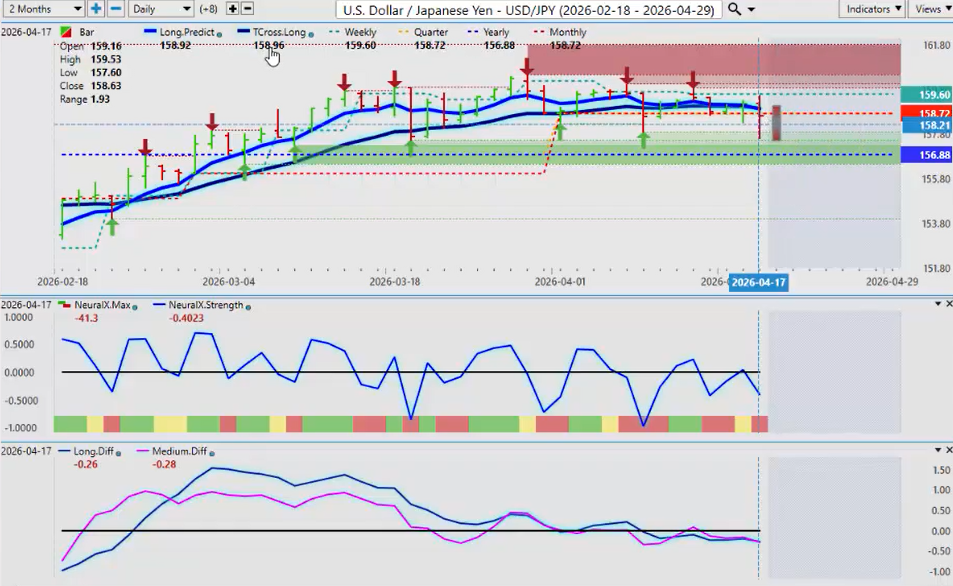
Now with the dollar yen again the dollar yen also under pressure this week with some pretty serious dollar weakness but again 156.88 we’re holding above the yearly opening price. The dollar very very likely to rebound here next week. So watch your TCross long. That’s the key level here. We put it on the on our last bar. Our TCross long 158.96. That is where we are likely going to retrace to. Another savvy trader can put in buy limit orders just above that say 15910. The market goes past that goes screaming up you have a buy limit order ready to go right above that level. So again it’s always important to have strategies before these moves occur not after.
U.S. Dollar versus Canadian Dollar ($USD/CAD)
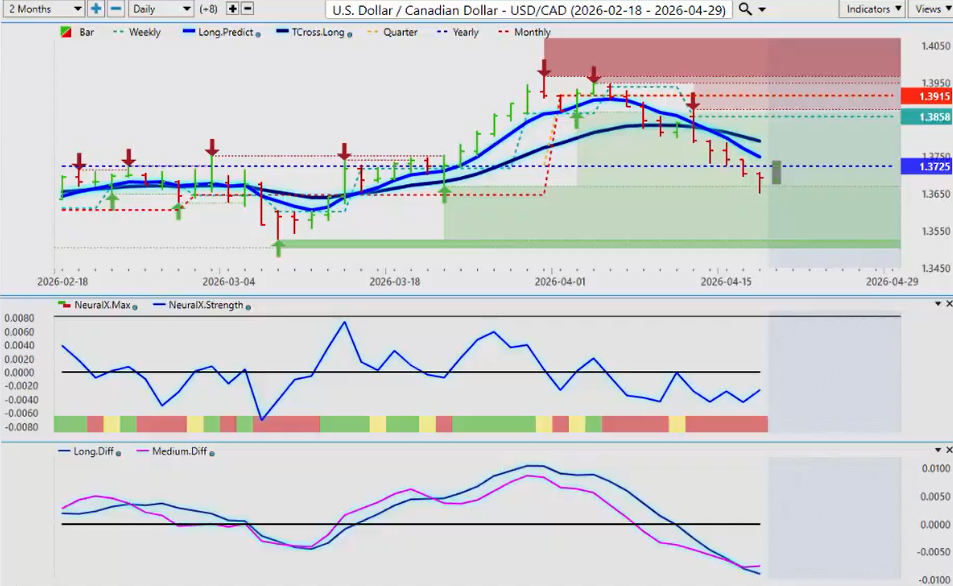
Now, as we look at the US Canadian pair and our main equity based currencies, I believe that all three of them are going to be in trouble next week if this conflict continues. So, US Canada has broken down below its yearly opening price. But make no mistake, guys, this is not about Canadian dollar strength. This is about US dollar weakness. Canadian economy doing very poorly under the current administration. So again, we’ll see how this one plays out. But the beauty of the VP software, guys, when it’s supplied properly, always gives early warning signs of something that when it doesn’t quite look right, because again, there’s very little reason why the Canadian dollar should strengthen. And I believe that this MA diff cross is correct. And we are going to move back, if nothing else, back to the TCross long 13791.
Australian Dollar versus U.S. Dollar ($AUD/USD)
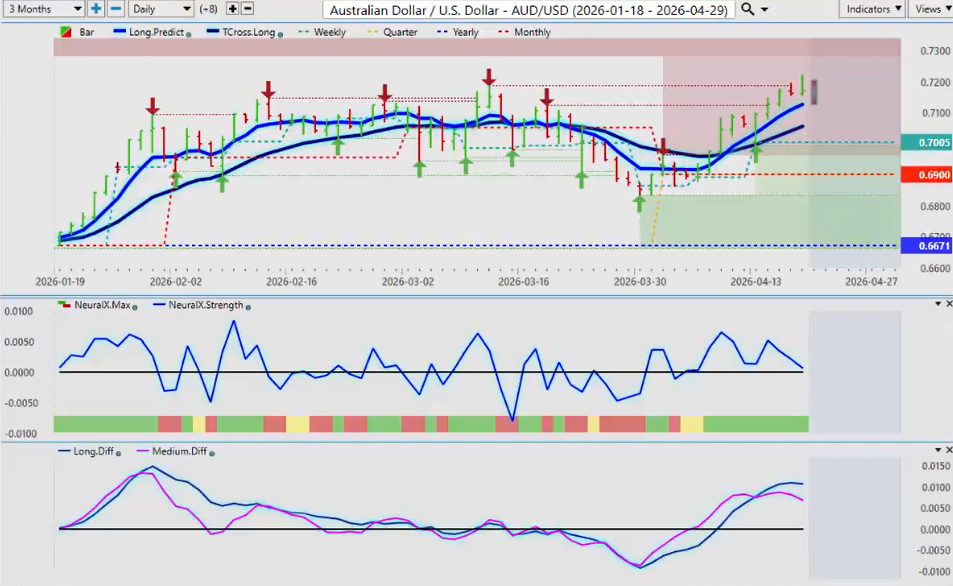
Now with the Aussie and the Kiwi, more specifically the Aussie US pair, it has largely remained positive during this conflict. So a retracement is healthy and I believe we will get that next week. Our two retracement points, the long predicted and the TCross long 7127 and 7056. So yes, we can sell down to those levels and then buy back if there’s new developments, positive developments on the warfront between the US and Iran. That could turn things around very quickly. But ultimately, in my respectful opinion, as we move forward into the year, the Aussie is the stronger currency of the equity commodity based currencies.
New Zealand Dollar versus U.S. Dollar ($NZD/USD)
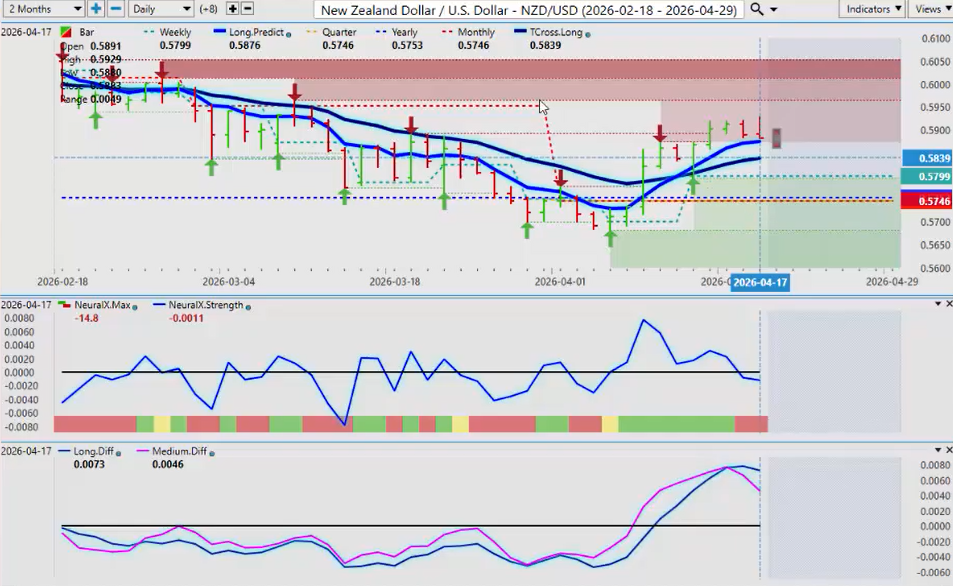
Now, the Kiwi could enjoy some of that strength too if the bank, a very confused bank of New Zealand decides to hike. So that’s what the market believes. But right now your quarterly and your yearly opening both sitting down here 5746 5753. But the first move that we are likely going to gravitate towards would be the TCross long at 5839. That’s the immediate area you want to keep your eye on. But again an MA diff cross to the downside on the Kiwi. And then we have again an MA diff cross on the Aussie to the downside. And when you look at the CAD, these three highly correlated currencies with Canadian dollar being the weakest, that one and not the base currency. It’s the quote currency. So the MA diff crossed to the upside. All three of these currencies are likely to lose momentum unless we get some miraculous settlement on Monday or Tuesday, which I think at this particular time is highly unlikely. But with all these events, there will always be opportunity using the VP software. So, with that said, this is the VantagePoint AI market outlook for the week of April the 20th, 2026.