Register for a Free Live Training
The Hot Stocks Outlook uses VantagePoint’s market forecasts that are up to 87.4% accurate, demonstrating how traders can improve their timing and direction. In this week’s video, VantagePoint Software reviews forecasts for SPDR SPY($SPY), NVIDIA ($NVDA), WNS Holdings ($WNS), Texas Roadhouse ($TXRH), Taiwan Semiconductors Manufacturing ($TSM), HESS ($HES), Amazon ($AMZN)
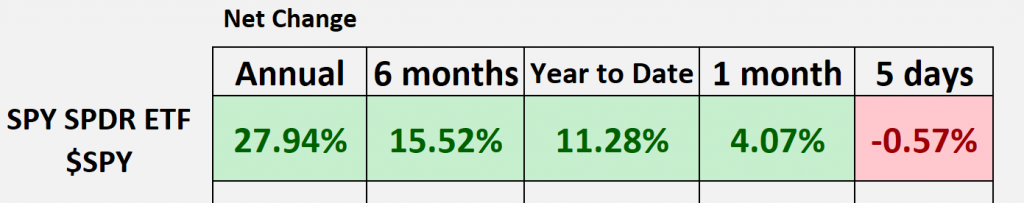
SPDR SPY ETF ($SPY)
Hello again, Traders, and welcome back to the Hot Stocks Outlook for May 24th, 2024. I hope you’re all having an excellent week out there in the financial markets. As always, we’ve got plenty to cover here in this week’s Hot Stocks Outlook. So, if you haven’t already, make sure you go ahead and click on that link in the description below. You can sign yourself up for a live demonstration and learn all the specifics about how these predictive tools and technologies can help you make much better trading decisions out there in the marketplace.
Now, as we typically do, we like to take a look at the SPY ETF to get a sense of where that broader equity market has been. The things that really stand out here, as we can see year to date, are that we’re up a little over 11%. We’ve actually seen certain markets get a little toppy here, and so this is where the short-term predicted forecast from Vantage Point is really helpful to help traders hedge, get in front of some of these big trend shifts, and take advantage of some of these really nice opportunities in the equity space.
We can see now, going back 12 months, we’re up almost 30%, and so that means there have been ample opportunities spread out throughout the marketplace.
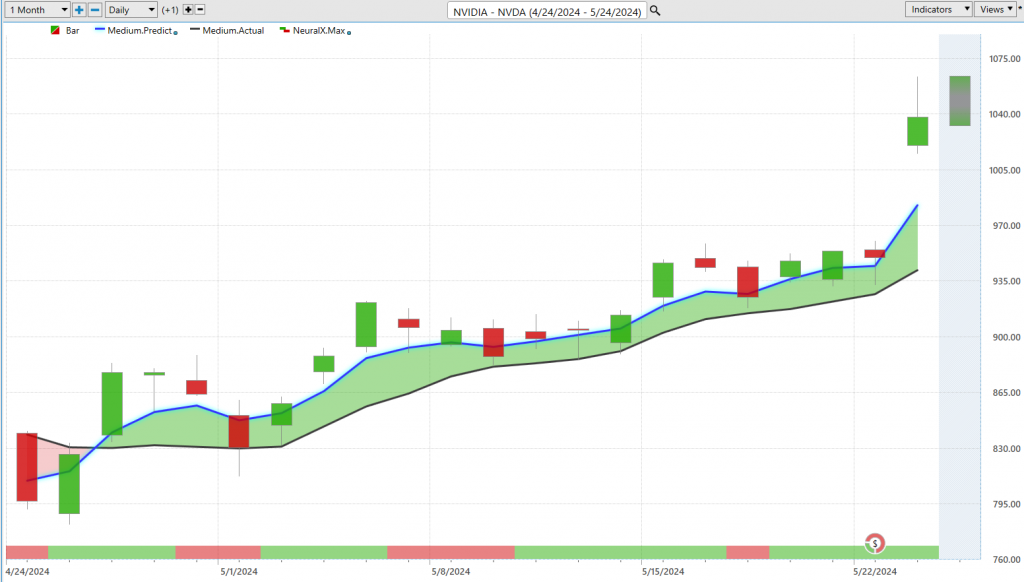
Let’s take a look at one of those opportunities here in shares of NVIDIA ($NVDA). We got a lot of attention here around earnings, but I think it’s a good opportunity to take a look and say, “Okay, well how have the past several weeks been as far as the Vantage Point predictive forecast of these indicators that we look at every week?”
What we have with NVIDIA here is daily price action. Each one of those candles that you see represents a full and complete trading day. Right up against that price data, the first thing you’ll notice is there’s a black line and a blue line value. The black line that you’re seeing there is actually a simple moving average, a very common technical analysis indicator. In this case, it’s a 10-period, so it looks back over the past 10 closes, adds those all together, and divides by 10.
The weakness with technical analysis tools like this is that all the data to generate that value comes from the past, so it’s really just summarizing what’s already occurred. The other primary weakness is that it’s only looking at what’s happened in shares of NVIDIA as though NVIDIA trades in a complete vacuum. What we understand is that there are important market relationships that are known to drive and affect the future prices of NVIDIA shares. This can be things like ETF groups within the semiconductor or technology space, other individual stocks like these big AI stocks such as Microsoft and AMD, the value of the dollar index, global interest rates, as well as things like crude oil or gold or commodity prices.
It takes this global approach to understand specifically what are the drivers affecting future prices in NVIDIA, and then it summarizes that with the help of these predictive indicators. It’s taking this global approach, looking at all these intermarket relationships, and that’s essentially the datasets that are being plugged into these neural networks to solve some of these difficult trading problems. Whenever we see this blue line cross above the black line, it’s suggesting average prices are starting to move higher. This is where, when we can get a jump on prices and get involved in trends early, it can make all the difference. So whenever that blue line crosses above the black line, it’s suggesting average prices are going to start moving higher and you might want to start executing those bullish strategies. So, we see here in the past 20 days we’ve gotten a 22, almost 23% advance in shares of NVIDIA, but that’s not it here, right? So, yeah, there’s been a nice move over 20 days, but how are things changing day-to-day for the trader and affecting their analysis?
What we can see here is if we look at the very bottom of the chart, you’ll see this bar that goes from green to red back to green. This is another indicator, but it’s tuned to solve a different problem for the trader. It’s really just looking two trading days ahead for short-term strength or weakness in the market but still using that neural network approach of looking at those intermarket relationships to solve this very difficult problem. This indicator has an extremely high level of accuracy, upwards of 86-87%, across a very wide number of markets and forecasting whether you’ll get that short-term strength or weakness over the subsequent 48-hour period.
So, as we look again at these subsequent trading charts, what you’ll see is that when that neural index goes bearish, you sometimes get these dips where you move below that Vantage Point predicted moving average. You see it again here, but this is where it’s really helpful. Not only do you have that information of when to really look to buy on the dip scenario, but you’re also provided a predicted high and a predicted low. These are essentially intraday price levels that traders can use to accumulate a position and make some trading decisions.
You see here that as the market starts to move higher, we have these previous predicted lows that weren’t here. We get this dip after our neural index gets bearish, and that’s the day you want to get involved because we very quickly accelerate. You see that as all that volatility comes through and shares waddle around, look again at how the market closes at that predicted high and then reproject. Say, “Okay, expect the market to move down to these predicted lows.” This is where your places of value intraday are to scoop up shares. Of course, we get that move after earnings that really seals the deal here as far as seeing a really nice advance in the stock. This is how we combine this suite of indicators to identify that trend shift, exploit that opportunity, and minimize the risk to be around for this really nice opportunity. See, again, about a 500-share position is about a $100,000 move, so really nice opportunities opening up recently here all throughout the equity space.
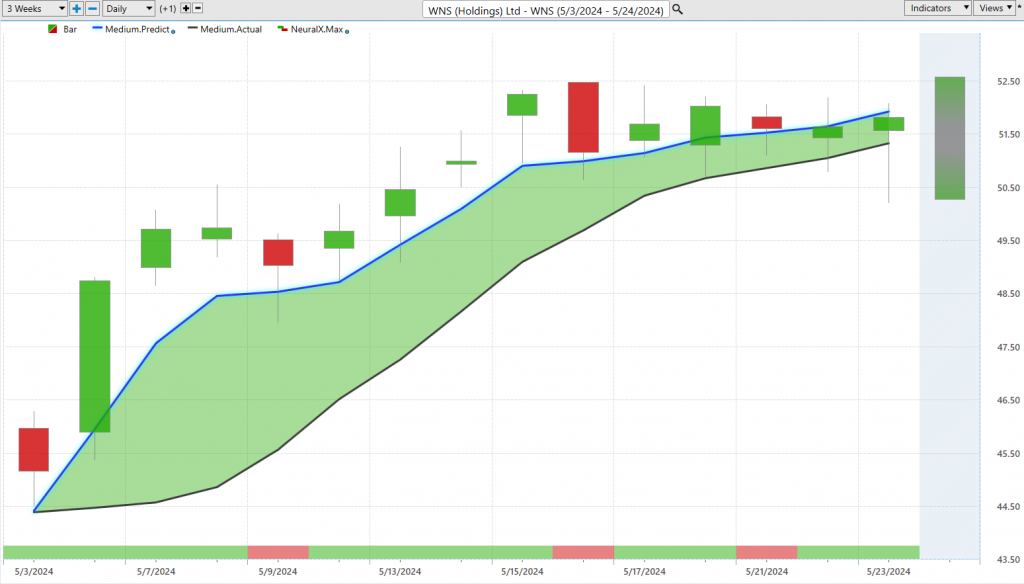
Here’s another opportunity here in WNS Holdings ($WNS). Again, just a good example of some of these things where we see this predicted moving average get a very quick crossover, and we’ve seen a really aggressive advance in the share price here. This is an example where we can see since that crossover has come through, you’ve got about a 12, almost 13% rally over the past 14 trading days. In this instance, we can zoom in a little closer on things like those Vantage Point predicted highs and lows. You see how this works as the market starts to advance. You’ve got a lot of distance between that predicted moving average and the actual moving average, and you can identify intraday levels to go ahead and accumulate a position. You see over the past couple of days moving down to the lower part of this range and the overall trend to the upside here, so potentially a nice opportunity here in WNS.
Taiwan Semiconductors Manufacturing ($TSM)
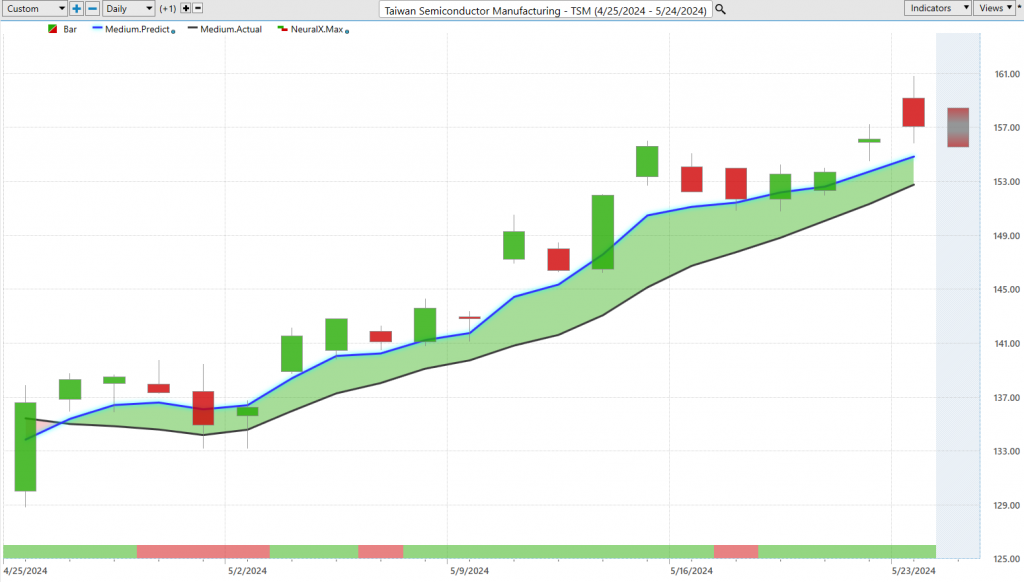
Last week we looked at Taiwan Semiconductor Mfg. ($TSM). These semiconductor stocks are getting on the radar. Tech as well. Here you see that blue line crossing above the black line again, similar price action with that neural index getting bearish and seeing some subsequent sideways price action. But let’s look at how accurate again these predicted highs and lows are. When you understand that something’s going on in tech stocks and semiconductors, we’ve got these predicted moving averages on TSM, on NVIDIA, on the bullish side. Intraday, remember you’re provided these predicted high and low levels before the trading date even occurs. Like you see in this instance, it’s a shadow candle. The actual trading day will fill in when we get the real trading market data here, and we’ll see how accurate all of those previous predictions are. But what we can see is that, okay, over the past few weeks here now, as far as stocks, where has it been saying we want to accumulate a position in this individual stock and benefit as things appreciate here? Very similar move again. We’re seeing a lot of the semiconductors have a very similar move because they share those intermarket relationships. In the same way that we can get clues on where NVIDIA is heading by price action in TSM, it goes back and forth. They really divulge some of this useful price information that the neural networks can pick up on.
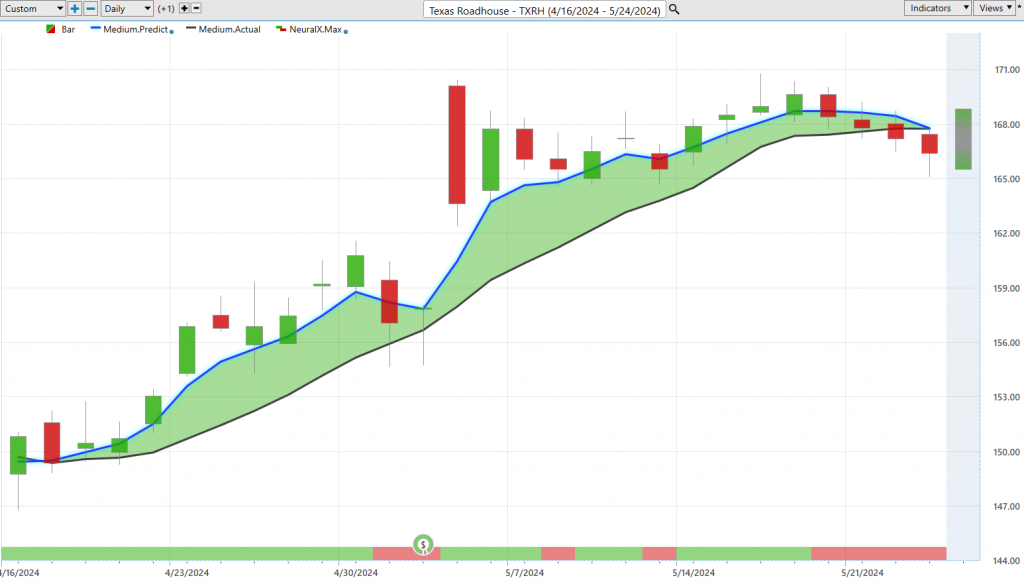
Here’s Texas Roadhouse ($TXRH). One of the few restaurant stocks where we’ve seen the blue line over the black line, neural index very bullish here. But this is what I mean by this recent weakness that we’re starting to see. There were some reasons why it looked like, okay, well up towards the predicted highs on Monday and Tuesday, we might see some weakness here. You actually see this blue line getting very close to the black line, neural index very bearish here for the week. Of course, highlighting that at least in the very short term, you can look for cheaper prices here in Texas Roadhouse. We can look at those predicted highs and lows and see a lot of noise around these earnings, but again, very clearly, you want to be a buyer taking profits on long positions. I actually want to point this out. There’s a lot of noise around earnings here, but you see this a lot where this is a Thursday, that’s a Friday, volatility coming into the beginning of the week, and then the overall trend playing out. We see that a lot where it looks like this level doesn’t hit because all the price actions gaps up and bullish, but it’s just frothy price action. These levels become relevant, and they’re important to have again on your radar and understand that they’re there. We see some of this weakness coming in, and the market again moving down towards these predicted lows. So, really nice opportunity here in shares of Texas Roadhouse. We see overall, again, this very similar move, but identifying where are those markets where we’re seeing strong uptrend, strong neural index, that’s where you want to be involved. You see about a 12% pop in the stock.
This was really interesting, and I wanted to bring this in because we actually had a little bit of short-term strength into energies. Here what we could see is that actually this looks very, very weak here, right?
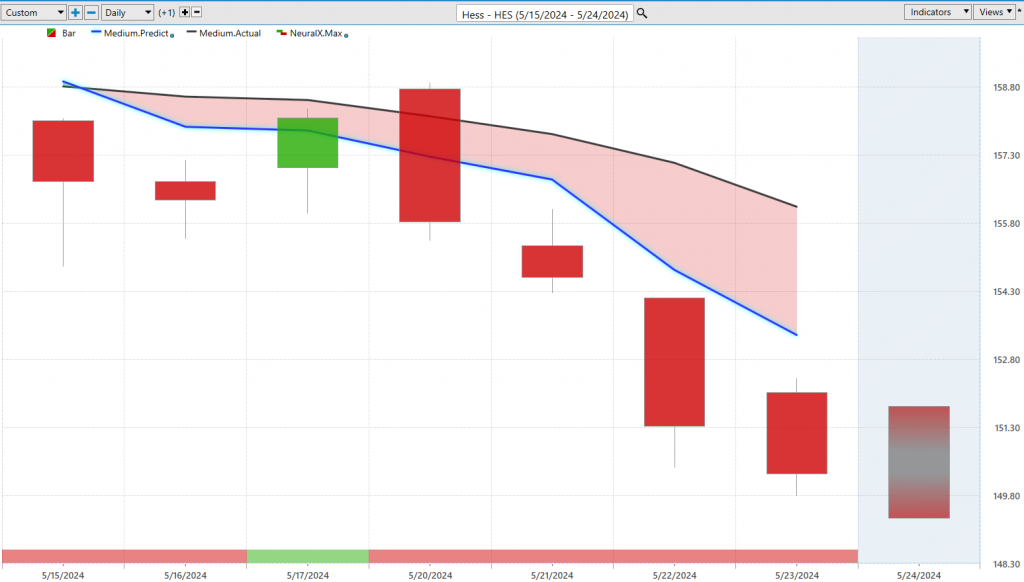
So you actually see Hess ($HES) blue line crossing below the black line, neural index bearish. Even going into the week, you can identify that, okay, well, we’re actually moving up towards these predicted highs and failing. You’ve seen that the previous few days here, Tuesday, Wednesday, Thursday, seeing energies go lower, in this case Hess stock go lower. Again, a very interesting clue that this may be why you’re seeing bullishness broadly across stocks but some things turning lower. We’re seeing risk off, or risk on in a way, like gold’s easing, commodities are easing, and certain stocks are going to do real well there. About a 5% decline here just in the past six trading days. So clearly, semiconductors is a place to be, energy on the stock side a lot more dangerous here.
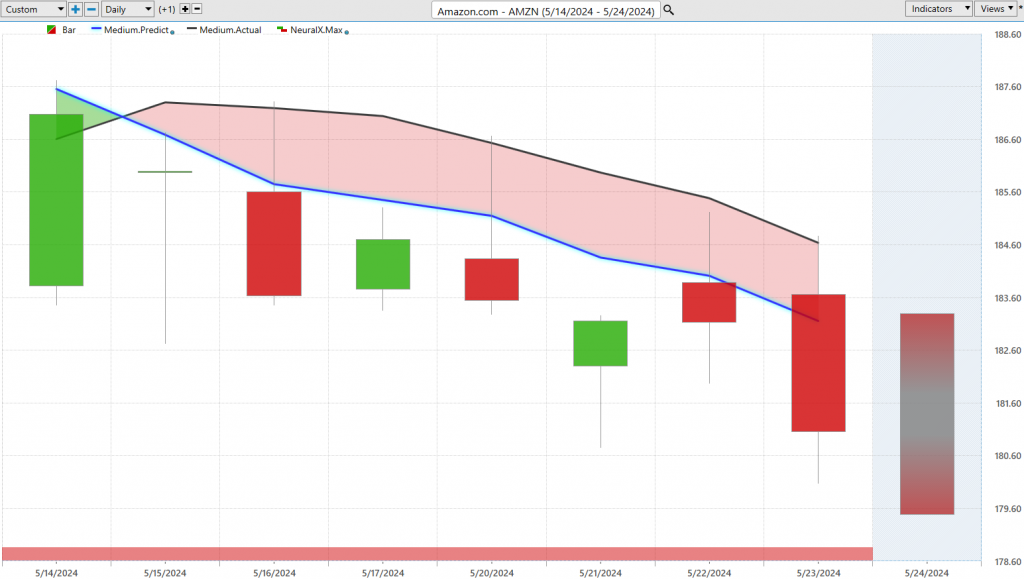
Here’s Amazon ($AMZN), again, a really popular stock. We’ve seen a lot of the broader market do well here, but Amazon‘s got something going on here. We’ve had two weeks now where the neural index has been bearish every single day. Our predicted moving average is bearish, and of course, for those really short-term traders maybe looking to trade options, here you have these levels. When you’re trading options and things like this, if you can go ahead and potentially buy those put options when you’re up at these predicted highs, it’s a great way to hedge the portfolio and make money on a potentially directional bet as we see the accuracy of these Vantage Point predictive indicators. A little decline here in Amazon shares, off about 3%, but it’s very clearly not a place you want to be when we look at some of these other opportunities opening up throughout the equity space.
So, I’ll go ahead and leave it there. Once again, this has been our Hot Stocks Outlook for May 24th, 2024. Thank you all for watching. Best of luck, and bye for now.