


Register for a Free Live Training
The Hot Stocks Outlook uses VantagePoint’s market forecasts that are up to 87.4% accurate, demonstrating how traders can improve their timing and direction. In this week’s video, VantagePoint Software reviews forecasts for Incyte ($INCY), Lumen Technologies ($LUMN), Copart ($CPRT), Roblox ($RBLX), Alphabet ($GOOG)
Hello again traders, and welcome back to the hot stocks outlook for November 7th, 2025. Hope you all have had an excellent week out there in the financial markets. And as always, we’re here today to take a look at the most recent Vantage Point AI predictive forecast. So if you haven’t already, be sure to go ahead and click the link down in the description below and you can get signed up for a live demonstration to learn all the specifics about how these predictive indicators and technologies are helping traders navigate the financial markets.
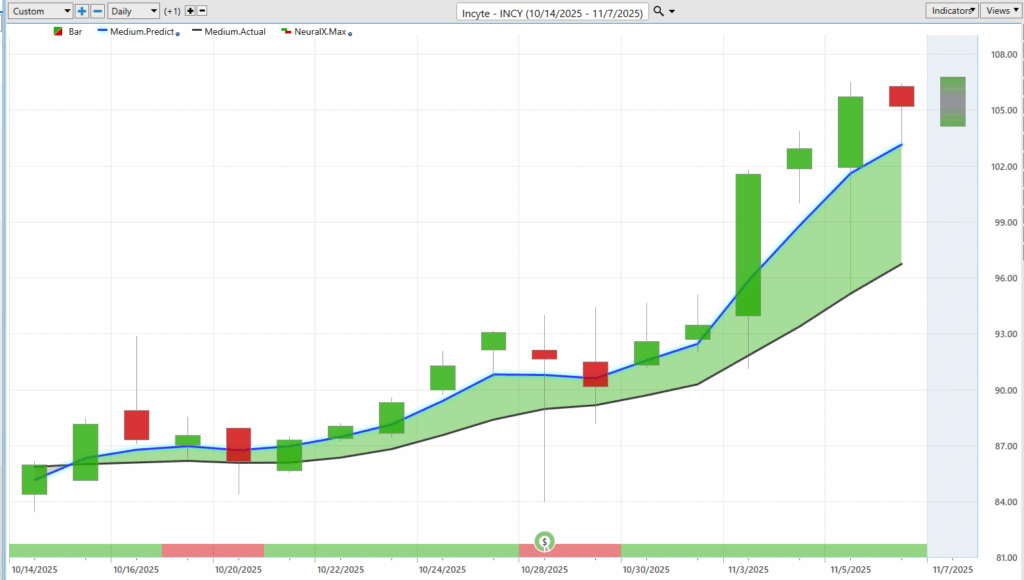
And so we have some really great examples of how really this suite of predictive indicators works together. Uh, and so we can start out here with Incyte (INCY) Pharmaceuticals. And so we have really about a month of data on the chart. We’ve got earnings right in the middle of the chart here. Uh, but what you’re first going to notice against all of these daily bars and candles is that there’s a black line and also a blue line value.
And so what that black line that you’re seeing is, is actually a simple moving average. So this is a very common technical analysis indicator. Uh, and for Vantage Point users, this is what we really use as our baseline, right? It takes the previous 10 closed prices, it’ll add those all together and then divide by that number. And really, the weakness with traditional technical analysis like this is that all the data comes from the past. And it only looks at one market in isolation, right? It’s not going to be able to account for how other markets may drive and influence shares of Incyte (INCY).
And so, Vantage Point traders want to use that as our baseline, again, letting us know where market prices have been. But obviously, traders need to be ahead of that next move in the market, understand where prices are likely to go next. And so what we can do is actually compare that black line value, or what we might call the lagging moving average, to the Vantage Point proprietary predicted moving average.
And so for this number, which is essentially a price that gets calculated and plotted on the chart every evening, well, this is where the technology steps in and it’s performing what we would call intermarket analysis. And so what that means is that rather than just looking at past prices to really arrive at whatever that averaged-out number is, Vantage Point’s tools are looking at other markets that are known to drive and influence future prices in a significant way.
And so, this can be other individual stocks. This can be ETFs that are going to wrap up a large sector, maybe in the pharmaceutical space in this case. Uh, but this can also be things like global currencies, global interest rates, and even global commodities where applicable. Right? If you’re trading gold mining stocks or oil servicing stocks, obviously those moves in the commodities can have a big influence on how the stock price moves next.
Uh, and so what Vantage Point traders are able to do is actually identify where these predicted moving averages are creating fresh crosses above the actual moving average through a lot of these scanning features. So we can really hone in on exactly what short-term predictive forecast you want to utilize for your trading, uh, and really identify where that is occurring in the marketplace.
And so again, whenever we see that blue line cross above the black line, well, it’s suggesting that these average prices are going to start moving higher and traders may want to look to take a long position. So we see as that forecast comes through, uh, we get about 17 trading days. Shares are up about 22.5%. And again, we see that that blue line remains above the black line over the duration of the past few weeks of trading.
Now, that’s not the entirety of the forecast though. There’s just some other tools that really solve different problems for traders. And so if you look at the bottom of the chart, you’ll see this bar that goes from green to red and back to green. Uh, and this is also utilizing that neural network approach. It’s doing intermarket analysis as well, but it’s tuned to solve a different problem for traders. And that problem is just short-term strength or weakness over the next 48 hours. So you can really think of that as a couple of candles looking out ahead into the future.
And so when we combine these forecasts of the overall trend direction along with the neural index, we can anticipate some of that short-term weakness in the market, uh, but understand that the overall trend remains in this case to the bullish side. And we have a good example here of really how this works. Right? Neural index goes bearish. You get a couple days of sideways price action where there’s really not much acceleration in price until that neural index goes bullish again.
We see that momentum kicks into the market again here around earnings. You’re always going to get a lot of, you know, volatility potentially and some illiquidity around earnings announcements. Uh, and so that’s when we’re going to see that just, you know, we see this very large wick candle here, but overall the trend is to the bullish side. And you see we spend another trading day just sort of settling around before that neural index goes bullish and that momentum kicks in as the uptrend and that short-term forecast move to the bullish side.
Uh, and so within that, the overall trend direction, the neural index next 48 hours, uh, we’re also provided a Vantage Point predicted high and low. So we’ve got this overall trend. We’ve got 48 hours. And we’ve also got an intraday predicted high and low which offers some very advantageous levels for traders to put on their radar.
And again, we can look back and say, “Well, how accurate have all of these predictions been before the trading day actually occurred?” So here we see going into Friday, this is the predicted high and predicted low. Uh, and we can say how accurate are all of those predictions before that trading day occurred.
Additionally, when you see things like the predicted ranges slope start to go higher, that’s a good indication that the forecast is getting bullish once again. So we see how this works. Uh, moving down towards these predicted lows, things start to slant higher and you see how this momentum kicks in. Uh, earnings again, a lot of volatility. But notice how quickly after the earnings report, the software gets back online and says, “Look for the range to go lower this next trading day. Look down towards these predicted lows.”
But again, we start to slant higher, slant higher, slant higher. Uh, and all that momentum kicks back into the market. So, really effective tool for traders to navigate individual markets that they might be trading. And again, here seeing a very nice push just over a pretty short period of time here. And so, really nice example there. Shares up about 22% again about 17 trading days.
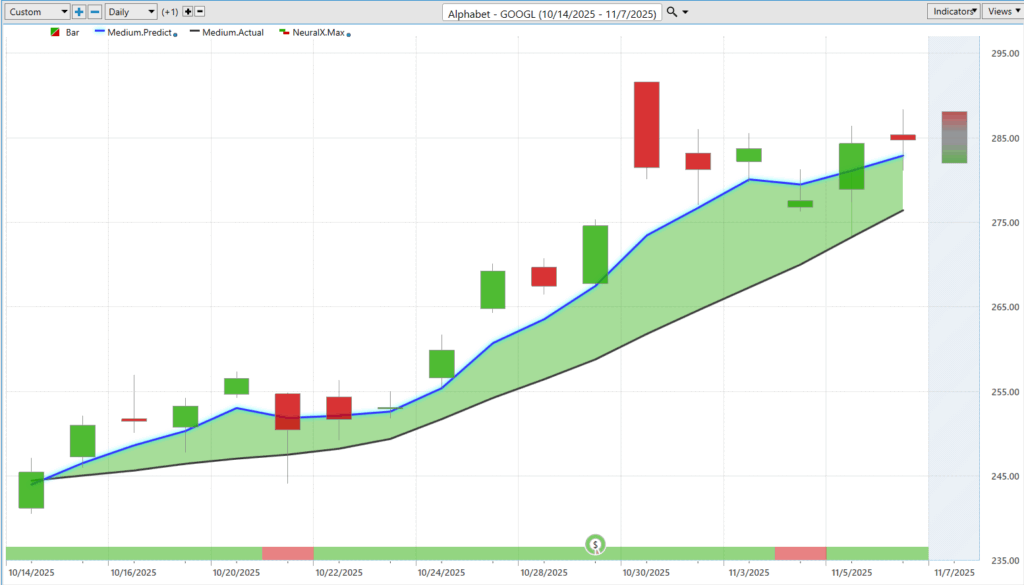
Now, much more popular Alphabet (GOOGL) stock here, shares of Google. And so once you understand one forecast, it really works exactly the same way regardless of the markets that you’re trading. Uh, and here we see with Google (GOOGL) that blue line getting freshly above the black line, neural index bullish.
And notice here where the neural index goes bearish, you get a couple of days where the market just settles sideways. But over those couple of trading days, what happens? Neural index gets bullish again, warning you of that upcoming strength. We start to get gap ups and momentum in the market. Again, here in earnings, you see you get a big gap up movement higher in the market.
But of course, we can take a look at those predicted highs and lows. And again, we really see how this works. Uh, you know, each week we always look at these opportunities where you move down to that predicted low. Some days when you get this choppy price action, you see we got a gap up. Well, what happens? The market needs to settle into that previous predicted low.
Again, overall, the trend very bullish here and moving up towards these predicted highs. Uh, so if you’re buying the market, taking profit at those predicted highs, uh, you know, that’s going to be a nice short-term trading opportunity. You see, even in this case where you move down to the predicted low, pretty quickly move up towards that predicted high the next trading day.
So a very nice tool to go ahead and set profit targets for your short-term trading here. And here we see Google moving up just over the past few trading weeks, up about 14 almost 15% here, just about three weeks of trading now.
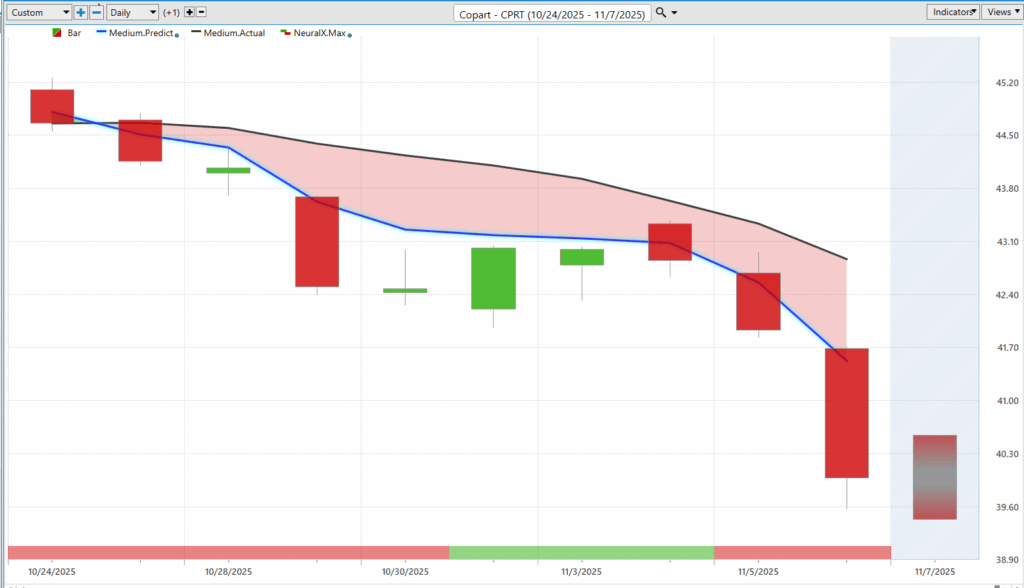
Now, broadly across the market, we’ve actually seen a lot of weakness, right? So you’ve seen a lot of the large cap stocks, uh, a lot of those stocks connected to data centers and AI really doing well. Uh, but broadly across the market, there is some weakness. Copart (CPRT). So, uh, car possessions are moving higher. And here we see Copart (CPRT) that is really an auction house that does a lot in this market.
Well, here we see this blue line crossing below the black line, uh, and exactly how these previous forecasts have worked. Right? Neural index is bearish, cross to the downside. Obviously a stock that you’d want to either short, certainly take profit on any long positions, but expect the market to go lower here.
Uh, and then you see here neural index gets bullish. You get a couple of days of strength, but very clearly there’s a lot of separation between that blue line and the black line. So it’s letting you know that that actual moving average is, well, in this case, above that prediction of the moving average. And we’d expect prices to continue to decline.
Uh, and then when we look at these predicted highs and lows, we again see how this works. Uh, moving down towards these predicted lows, really that momentum kicking in, and the software saying, “Okay, well, what should happen to the next day’s trading range? How can we really, you know, anticipate where this market’s likely to trade?”
And so you see even a strong closing day where you close up towards the high, representing an area where you’d want to keep shorting as this market remains in a downtrend. Uh, and then we’re seeing some really fresh crossovers across some of the indices. So, you know, some of these stocks that are already in downtrend may really start to move lower if we get some broad-based market weakness on top of what we’ve seen here.
So about a 10% decline just over the past nine trading days. So very significant move here just over about a week and a half.
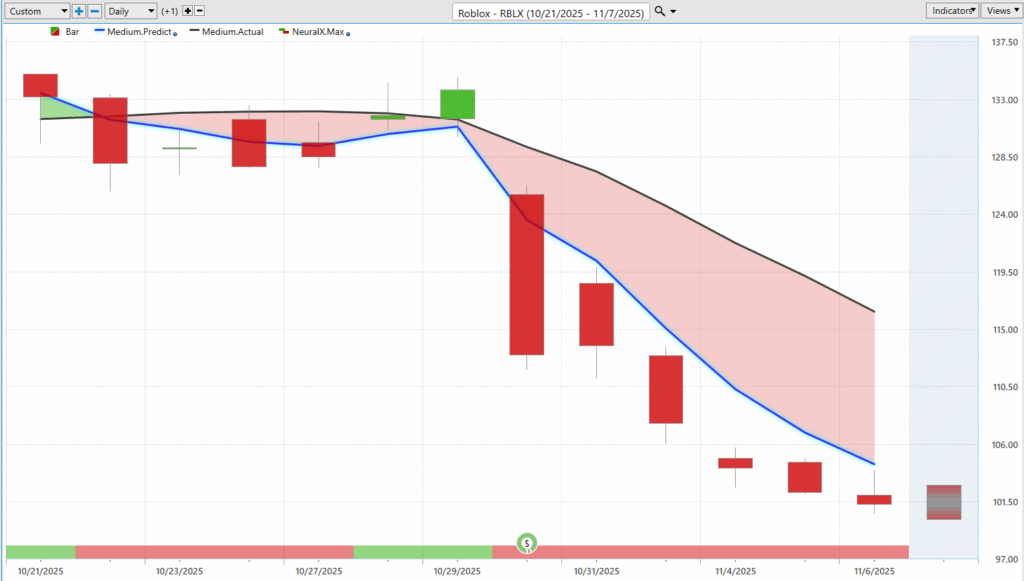
Here’s Roblox (RBLX), and I brought this through last week. A nice opportunity to update the forecast. Now, uh, you always want to be careful around these earnings reports, right? So this is a big earnings report day. Uh, obviously, the market was in a downtrend going into that.
You see the neural index telling expect strength over a couple of trading days. But once the earnings comes through, you really are kind of through that volatility catalyst. Then you understand that, okay, well now we’ve got this very effective tool that can guide our predicted ranges moving forward.
So if we want to go ahead and short the market, we see what really happens this next trading day as we gap up. And not an opportunity to get long on that gap. We see the market just continues to move lower down towards this predicted low and repeatedly pushing up against that predicted low offering some good bearish targets.
Uh, if you want to go ahead and short the market. But very straightforward opportunity here, but really match exactly how we look at these forecasts saying, “Okay, well, day-to-day we get a very strong forecast.” You want to be aware around those earnings reports because there’s a lot of illiquidity and very strong moves that are really sort of, you know, unpredictable about what’s going to be in those earnings reports.
But once you get through that, this software does an excellent job of really recalibrating and understanding, “Okay, well, where did this market move? How are those other markets weighing on the aspect of the market trading moving forward?” Uh, and then producing a very strong forecast for traders to really line up their trading opportunities.
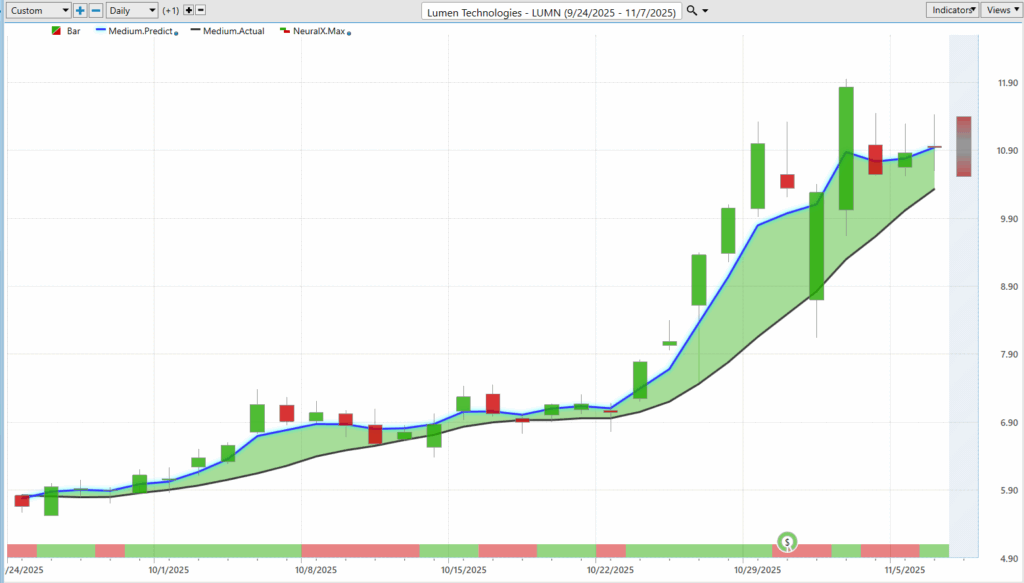
And lastly here, Lumen Technologies (LUMN). Here’s Lumen Technology. So a very aggressive moving stock. Uh, here we see this one of the few markets that are in an uptrend. Right? So we looked at Ciena (CIEN) last week has been a really strong stock. Uh, here’s Lumen (LUMN) as well.
Blue line over black line. Get these little blips where the neural index is bearish. And you see the market just sort of runs sideways for a while here and a lot of noise around earnings. But overall, the trend very bullish. So you see even going into earnings a ton of separation here between that predicted moving average and the actual moving average, indicating a very strong trend.
Uh, and of course, we can look at those daily predicted highs and lows. And so while it’s early on in these opportunities and you identify those fresh crossovers, the software does an excellent job of picking out what is likely to be the daily ranges. Right? So where several weeks before earnings is where you want to go ahead and establish a position and potentially get a lot of cushion so you can actually take on some of that volatility that comes around the earnings report.
Uh, and so you see here how really, you know, you get this noise around earnings. The software is really recalibrating here and then offering up some levels where we should expect that market to trade. So really effective tools here to help guide the trading decision-making process.
Uh, and overall here now Lumen (LUMN) just over the past month of trading here, about a month and a half, about 87% move higher from those initial predicted lows.
So we’ll go ahead and leave it there for today. But once again, this has been the hot stocks outlook for November 7th, 2025. Thank you all for watching. Best of luck out there, and bye for now.


