Register for a Free Live Training
The Hot Stocks Outlook uses VantagePoint’s market forecasts that are up to 87.4% accurate, demonstrating how traders can improve their timing and direction. In this week’s video, VantagePoint Software reviews forecasts for Lowes ($LOW), Tesla Motors ($TSLA), Hasbro ($HAS), Nucor ($NUE), Phillips 66 ($PSX), Steel Dynamics ($STLD)
Hello again traders and welcome back to the Hot Stocks Outlook for October 21st, 2022. Hope you are having a excellent week out there in the financial markets and as always, plenty to cover here in this week’s outlook. So if you haven’t already, make sure you click on the available link in the description, get a live demonstration and learn more specifics about how this technology is going to help you as a trader make better trading decisions each and every day in the marketplace. So we’ll go ahead and start out. We have shares of Lowe’s, a really good example of how the combination of these predictive tools work, but we’ll go ahead and move forward. We’ve got Tesla, Hasbro, Phillips 66, and Steel Dynamics. So just what I want to highlight is we’ve got this very obvious separation between a lot of these traditional sort of stocks, these high flying things that do well that usually get the attention and a lot of this more oil, basic material industrial stocks.

And really highlighted that last week with shares of new core and energy stocks as well. But this is a really great example here in Lowe’s of how all these tools work together. So what you’re seeing here is daily price action. This is real simple just looking at the past six or seven trading days. And what you have against that price action is you’ll see that there is a black line and also a blue line. So the black line that you’re seeing there, that’s actually a simple moving average. So that’s a very common technical indicator. And in this case, what it does is look back over the previous 10 close prices. So it’ll add those all together and divide by 10. And that works to smooth out the existing price action. And it lets us, as the traders know where market prices have been over a given period of time.
But obviously, the savvy trader needs to be ahead of that next move in the marketplace. And so what we’re able to do is actually compare that lagging, moving average to this blue line, which is a proprietary predicted moving average and for that number to get plotted and calculated and thrown up against the chart for the trader every evening, this is where the technology of artificial neural networks come into play and they’re performing what’s called Intermarket analysis. And so what that means is when trying to forecast for shares of Lowe’s, and you can think of related stocks like Home Depot, right? Well, when they’re making these forecasts, it’s looking at markets that are known to drive and influence this target market. So that’ll be things like different ETF groups, that’ll be things like individual stocks, maybe like Home Depot or some other individual stocks, so within basic materials or capital goods.
But there’s a lot of these big macro relationships, which if you’ve been trading in the markets, well, it’s quite obvious how dollar index is affecting your portfolio or the crude oil market or the value of interest rates and the bonds or just other global currencies. And so what it’s able to do is take all of this into account, the currencies, commodities, futures, ETFs, stocks, and it looks at how all of these markets are affecting the one target market that you’re trading. And this technology, what it does is it then takes that information, that raw data and uses it to generate very accurate price predictions. And it’s those price predictions that are used to construct these indicators. So rather than having tools that are just going to look back at the past and get yanked around by the recent close price, what we have is a forward-looking predictive tool.
So whenever we see that blue line crossing in this case below the black line, it suggests average prices are going to start moving lower and the trader can act accordingly. Now, at the very bottom of the screen, you’ll see you have this bar that goes from green to red and back to green. And this is another one of these predictive indicators but tuned to solve a different problem for the trader. And this gets updated each and every trading day, but it’s forecasting for the next 48 hours. So short-term strength or weakness in the market. And so you can see here as you get this blue line crossing below the black line, and what we can actually do is run these through and tele scan. So we actually see right when those signals come through right as they occur. And what we can understand is, all right, well, the overall trend is lower.
We see the neural index says there’s weakness over the next 48 hours. And what’s helpful to understand is this indicator gets this right, essentially four out of five times. It’s a very high accuracy well above 80 plus percent in most instances. And so you’re able to take that and work that into your overall strategy. So you see we have that blue line crossing below the black line, the neural index gets bullish you see on 10/17 and you get some higher highs over the next trading day. But the overall trend, right? The blue line’s still below the black line and letting you know the overall trend is still lower. So the trader needs to be aware of short-term strength or weakness in the marketplace within potentially that bigger trade or objective. And so with those two indicators, you see that you get a very good roadmap, but that’s not really it. The very right hand side of the chart here, you see you have this shadow candle and what this is providing is a intraday predicted high and predicted low for the upcoming trading day.
So it provides some very helpful levels to, again make these trading decisions from. And so what we can see with Lowe’s is as you get that crossover and suggesting the overall trend is to the downside, but every single day you get these updated forecasts from the predicted highs and predicted lows. And what they’re going to alert you to is, hey, if you’re looking to short this market, you may want to look towards these predicted highs and target things like the predicted lows if you’re very short-term or keep it open for a swing trade. And so here you see we get that neural index bullish and you see how the market performs intraday predicted high is doing an excellent job over the 48 hours warning you of this strength coming in. But the overall trend, the overall direction in the marketplace down. And you can take information not only from what you see here in Lowe’s but the broader markets and you can see, hey, how much of the market is vantage point says is shifting to the downside and what areas of the market should I focus on if I want to create that hedge portfolio where I can be short and see about a 9% move to the downside in the past nine trading days or maybe some other areas where I can get long and again, create that hedge portfolio and make money regardless of what the broader markets do.
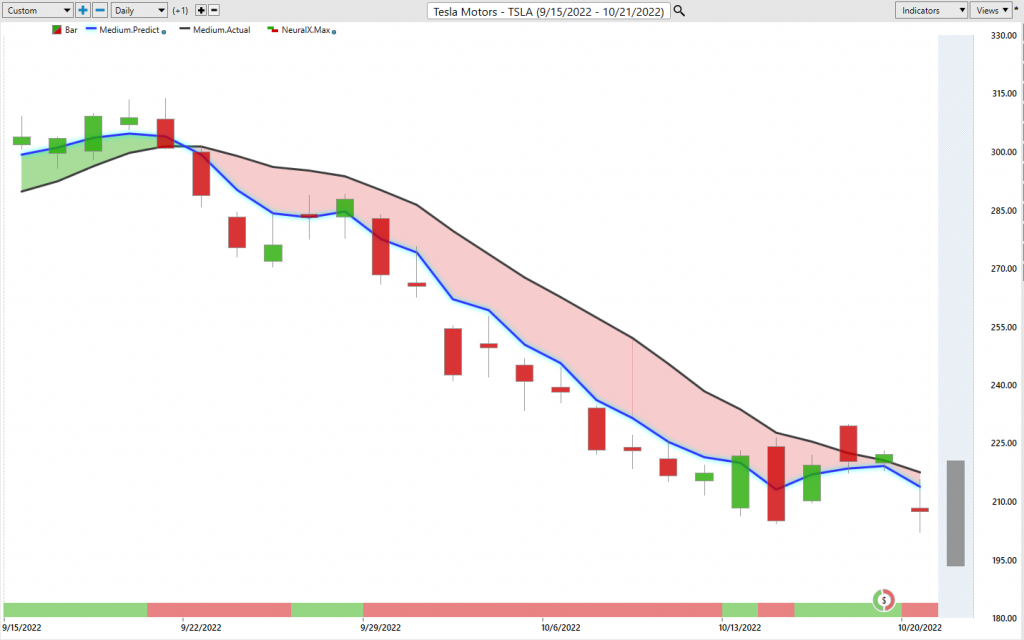
So we had a request about Tesla and Tesla Motor’s a very popular stock, but very clearly you can see going all the way back to late September, there’s a full month now in Tesla shares, it doesn’t get much more straightforward than this, the blue line crossing below the black line neural index bullish. Now you’ll see you get these little blips where the neural index goes bullish and just like Lowe’s, you get that 48 hours of subsequent higher highs over the next couple of trading days. Same thing here, we go into this earnings announcements and the market runs sideways and the software says, look for these higher highs over these subsequent 48 hour periods. But the overall trend is still very much to the downside. And this is where tools like even the neural index through earnings and through fed announcements and interest rate decisions and all this still has that extremely high level of accuracy associated with its indicators.
And so when you can take that and incorporate it into the markets that you’re trading and create that portfolio where you hang long over here, short over here, managing those positions. Well, here you see about a 30 and a half percent move over the past 21 trading days, just a couple of hundred chairs, there’s about $18,000 move. But very clearly you see that you’re not getting a crossover to the upside, right? So you’re going to see some volatility around these areas, but this is not an area where you want to be getting long in the market.
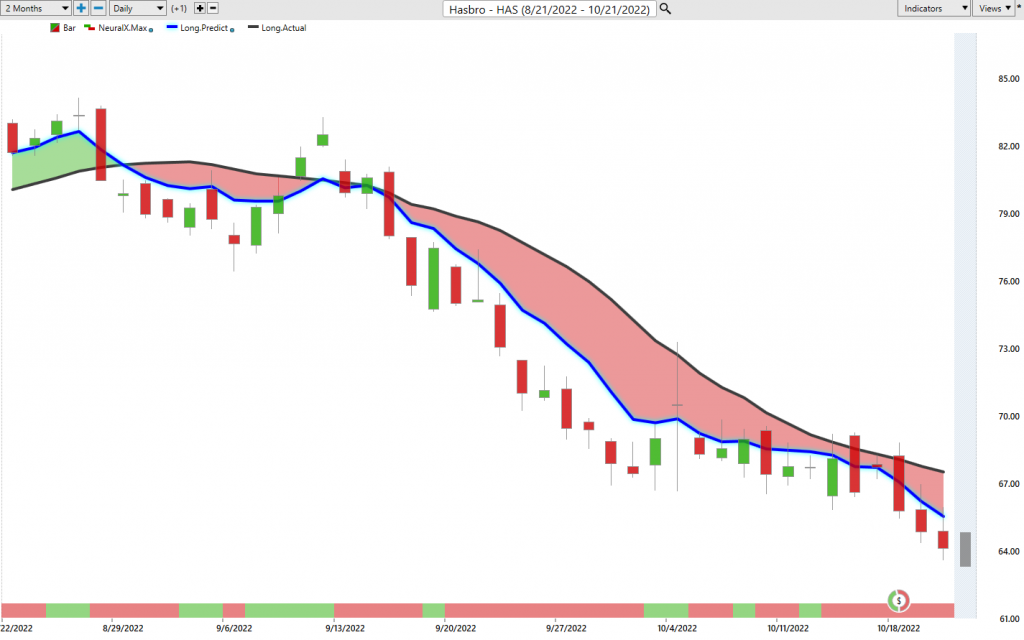
Now moving on to Hasbro, and again, you see a very similar sort of picture where we had that shift after the summer, right? Apple had a huge rally for two months into the summer. We got that shift lower. And what we’ve had is markets for the past few weeks run sideways, but most of the markets still in these down trends, right?
So we saw some of these markets that we’ve even brought through running sideways for this past few weeks and you see how markets have sort of fizzled out dollar weekend at $114 ran sideways for a while and that has effect on the markets that you’re trading. But clearly the overall trend here in Hasbro is still down. And when you’re taking these tools and using them day-to-day, that’s where these really come into play here, right? So when you have these tools and understand that, okay, well, I know I only want to be short taking profits on shorts and even through this volatility, see the past couple of weeks, every single day here doing a pretty dang good job at hitting those predicted highs. You got a little bit of volatility here, but that’s really the point is the software does an excellent job of even days where you see something a little bit surprising.
You see pretty close to the range and then the software updates. And so it has an excellent ability to adapt to those changing market conditions. Look at, hey, what happened at Hasbro? What happened to those Intermarket relationships? And let’s get these forecasts back on track so that trader can make intelligent trading decisions about what they should do and keep expressing in this case those shorts to the downside. So again, really big move. We’ve got a lot of markets that are still trending lower, but there’s been so many opportunities over the past few weeks to keep managing these opportunities and build that portfolio and build these positions. You see about a 20% decline, but a $3,000 move again just on a couple of hundred shares here in Hasbro. And there’s not too many areas where there’s strength in the market. And this is why for several weeks, we point out a few things as far as crossovers moving to the upside, but it’s pretty restricted to some narrow areas in the marketplace.
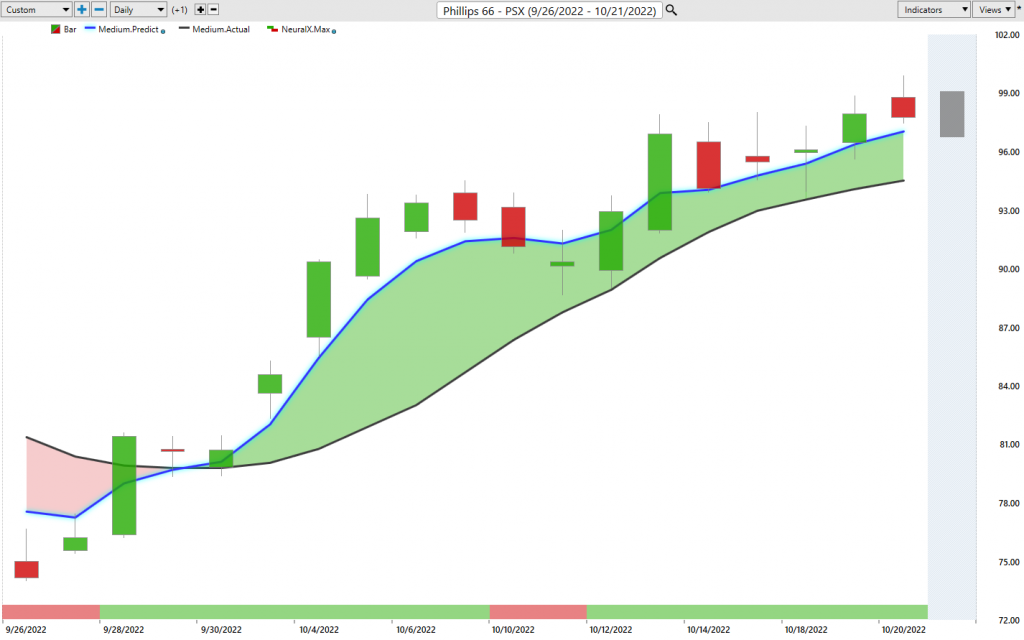
So here, we as Phillips 66, we looked at energy shares past couple of weeks, but the exact same thing, you see the complete opposite sort of forecast you have here, blue line over the black line, neural index, very bullish. We get this blip here where you see that 48 hours of weakness over the next 48 couple of trading days there. But then we can look at these predicted highs and lows as a roadmap that let you know every single day, Hey, look for this range. Hey, to dip a little bit lower, hey to dip a little bit lower, hey to dip a little bit lower, but the overall trend is still up. And you can use those levels again, adapting as the market adapts. Because if you go ahead and put on a position back here to get involved in the trend, well there may be some really great opportunities to manage that opportunity, right?
And build a larger position and make more money as that expectation plays out. So again, here in Phillips 66, really nice move here despite dollar firming up again, and that’s where you’re seeing a lot of weakness in stocks is dollar starts getting strong again. But here in oil in places that have been a lot more resilient, but a 21, 22% rally in just 15 trading days, and again, very small share amounts here, there’s not hugely priced stocks, but you don’t need a huge amount of shares to make a considerable amount of money when you’re getting these big sort of moves and where you can understand where to hedge your portfolio and make sure that you’ve got exposure to things that are working on both sides of that bigger move in the marketplace on the S&P. Lastly, here’s Steel Dynamics. So we looked at a new core last week and we’ve seen a lot of, again, just not many places where you’re seeing strong forecasts.
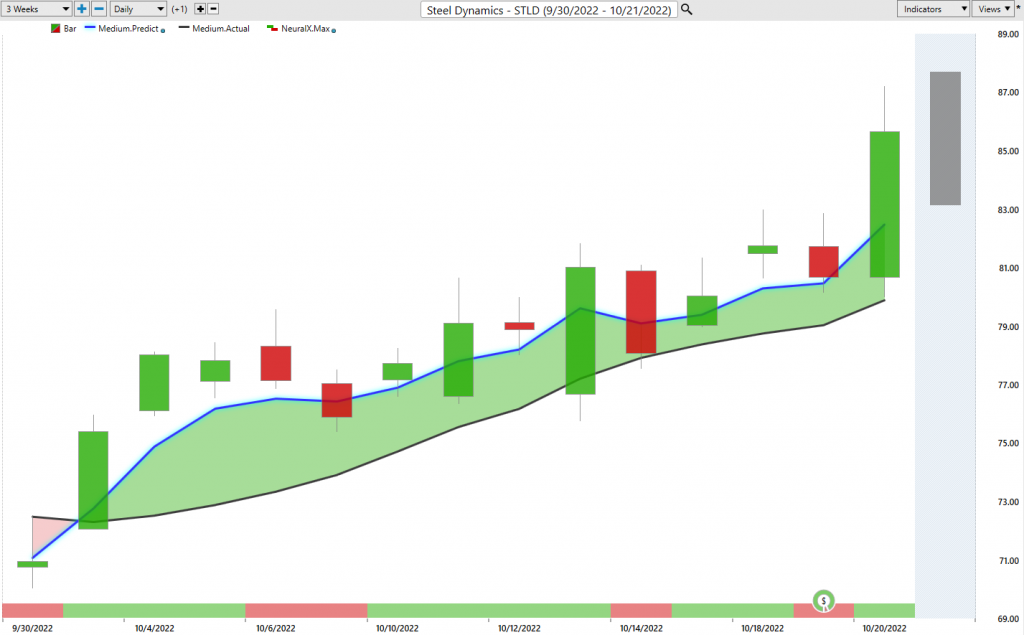
So here in Steel Dynamics, blue line over black line, and again, it’s not just about what’s happening today, right? It’s about… This is now three, four weeks old. And if you’ve been looking in these areas of the market, then you’ve had that roadmap that says, Okay, well, look towards these predicted lows to accumulate a position. You want to be a buyer in these areas of the market and a potential seller in some of these other areas. But intraday, you don’t know if you’re going to get that predicted high level where we can set some intraday shorts, but clearly in Steel Dynamics here, over the past week, it’s highlighting these entries way down here at 78 and now you see recently the market really accelerating up into the eighties, but creating some bullish opportunities where the markets aren’t performing all that well on a broad-based view here, right?
So here’s Steel Dynamics up to 17% in just 14 trading days. And again, just a couple of hundred shares moving on about $2,500 there in pretty short order. So we’ll go ahead and leave it. There’s some really interesting, and exciting things playing out, but you really need to know where to look. And this is where tools like Vantage Point are very good at skewing into those areas where there’s support and where those trends are playing out and where you can expect that expectation to continue. And areas where clearly we’re having some real problems and we can wait, right? Just get out of the way and wait for things to improve or short the market and make money on the downside. So once again, this has been the Hot Stocks Outlook for October 21st, 2022. Thank you all for watching. Best of luck and bye for now.