


[fusion_builder_container hundred_percent=”no” equal_height_columns=”no” hide_on_mobile=”small-visibility,medium-visibility,large-visibility” background_position=”center center” background_repeat=”no-repeat” fade=”no” background_parallax=”none” parallax_speed=”0.3″ video_aspect_ratio=”16:9″ video_loop=”yes” video_mute=”yes” border_style=”solid” type=”legacy”][fusion_builder_row][fusion_builder_column type=”1_1″ type=”1_1″ layout=”1_1″ background_position=”left top” background_color=”” border_color=”” border_style=”solid” border_position=”all” spacing=”yes” background_image=”” background_repeat=”no-repeat” padding_top=”” padding_right=”” padding_bottom=”” padding_left=”” margin_top=”0px” margin_bottom=”0px” class=”” id=”” animation_type=”” animation_speed=”0.3″ animation_direction=”left” hide_on_mobile=”small-visibility,medium-visibility,large-visibility” center_content=”no” last=”true” min_height=”” hover_type=”none” link=”” first=”true” border_sizes_top=”” border_sizes_bottom=”” border_sizes_left=”” border_sizes_right=””][fusion_text]
The Ins and Outs of Volatility Trading
Over the last twenty years, the investment landscape has been altered by two massive trends. The first is the shift from single stock and mutual fund investing into exchange-traded products (primarily exchange traded funds (ETF’s) and Exchange Traded Notes (ETN)). The second is the emergence of volatility as an asset class. Volatility describes how quickly and how much price of a market index or security changes over a period of time. This definition is very much linked to how risk is traditionally defined in financial markets.
First off, Exchange Traded Funds create trading instruments where the average investor can trade the same sectors of the economy as a very well capitalized, institutional client. These instruments originally were introduced as a simple way to trade a basket of the S&P 500 Index and has since evolved into a marketplace that offers a huge diverse number of products and strategies. ETFs are used to gain exposure to everything from grain futures contracts, crypto and third world government bonds to merger and acquisition arbitrage companies and increases and decreases in market volatility.
The primary method of tracking and measuring volatility has been through the Chicago Board Options Exchange (CBOE) referred to as the VIX. In 2004 the VIX based product became tradeable. The CBOE launched VIX futures and options in 2005. While most traders are not likely to trade options or futures, what this specific launch did was allow Exchange Traded Funds products to be created. These products have opened volatility trading to a very broad audience and has firmly established VOLATILITY as its own asset class.
I like to refer to the VIX as the heartbeat of the market because it resembles what an Electro Cardiogram looks like, short spurts of hyper activity followed by declining levels of activity and rest.

Volatility is defined using the statistical measure of standard deviation, which measures how far away the current price trades relative to its average. By definition, volatility is the range of returns over a specified time period compared to the average return. Volatility attempts to measure the unpredictability of stock returns while ignoring direction and trend. For those interested in what the number represents, here is a very simple way of thinking about it. The VIX represents the S&P 500 index +/- a percentage move, annualized This value represents one standard deviation from the average. If the VIX is currently at 20, this means that based upon option premiums in the S&P 500 Index, that the S&P is expected to stay within a + or 1 20% range over one year, 68% of the time (which represents one standard deviation).
The primary factors which influence the volatility of financial markets are news reports, earnings, macro-economic data, and political elections and national economic factors. Traders who trade volatility are not interested in the direction of the price movements. They make a profit on increased volatility, whether the price goes up or down. Before the creating on ETF’s and ETN’s based upon volatility measurements the only way to trade volatility was through the purchase of options. When Volatility increases options premiums increase. When volatility decreases option premiums decrease.
Volatility products have become very popular for multiple reasons. Buying volatility is an additional means of hedging risk in the market. Volatility usually goes up when stocks go down. Selling volatility can also provide a very valuable income stream.
Here is a chart from the Vantagepoint Software with the artificial intelligence forecast attached, of TVIXF (Velocity Shares 2x VIX Short Term). This graphic represents how much volatility increased in February 2020 when the pandemic began to hit the United States earlier this year and the economic lockdown was on the horizon. This ETF could have been purchased on February 21st, 2020 at a price of 50. 17 short days later it traded at a price of 1,000. This represented a 1,950% gain!
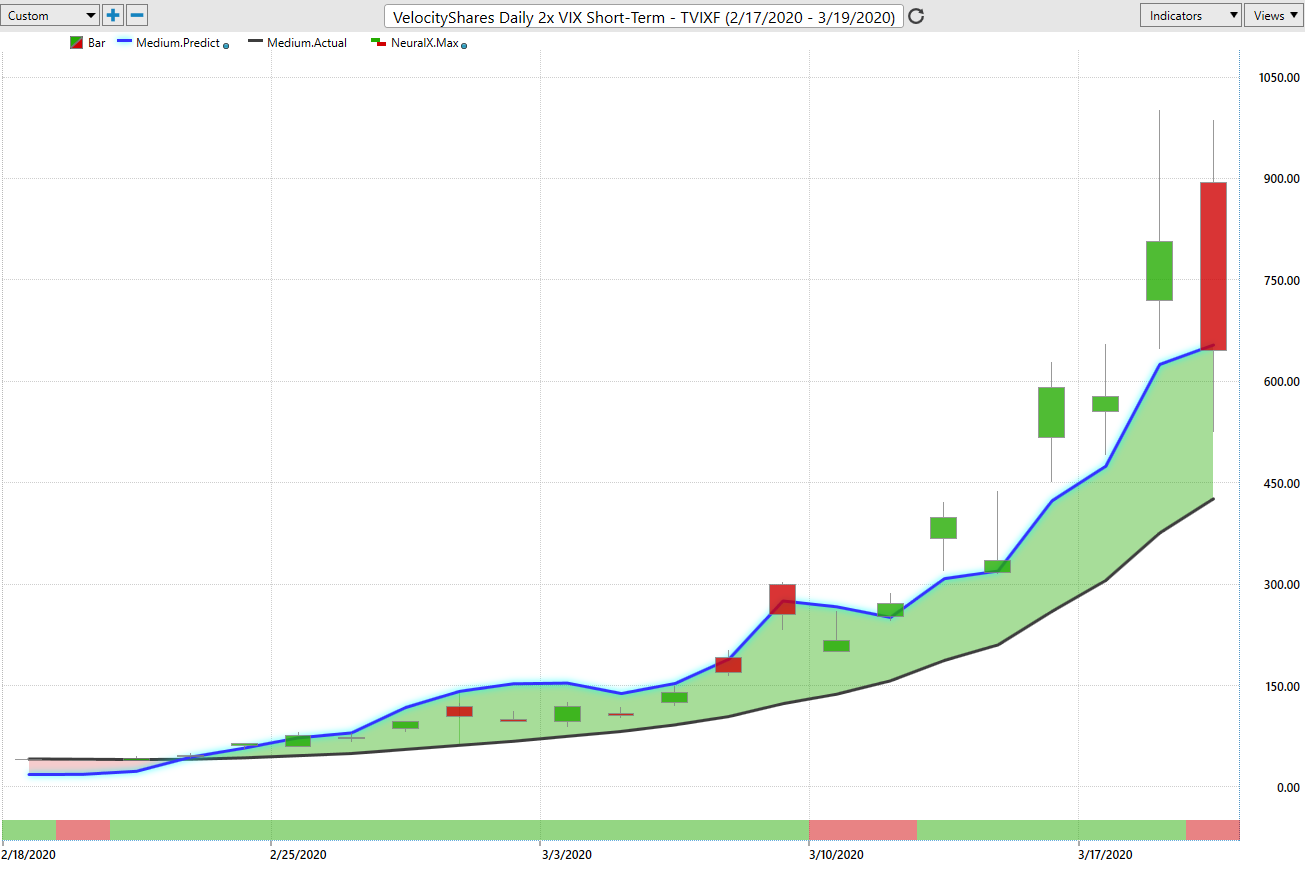
Many Power Traders look specifically for only these opportunities to trade volatility. What causes these spikes in volatility are things like unusual major news reports, uncertainty, earnings and elections.
So how can traders trade the VIX? You can trade VIX futures, but those are generally out of reach for the average investor with a discount brokerage account.
There are ETFs and ETNs that are wonderful and liquid instruments for traders who want to take advantage of the VIX.
Today, most traders use these ETF’s to trade the VIX.
Long VIX
TVIXF (Velocity Shares 2x VIX Short Term)
VXX– iPath S&P 500 VIX Short-Term Futures ETN
VIXY– ProShares VIX Short-Term Futures ETF
UVXY– ProShares Ultra VIX Short-Term Futures ETF
Short VIX
SVXY– ProShares Short VIX Short-Term Futures ET
Often when a stock market selloff occurs it will drag down the entire market. This makes it much, much harder to try and pick individual companies for your portfolio because everything will have a tendency to go down in unison.
Traders can learn a tremendous amount by simply watching the VIX and its corresponding effect on option premiums. Be very careful about trying to pick individual stocks when the VIX is rising sharply. Be extremely cautious about your positions in the market when the VIX is making a 52-week high.
To get a good idea of how VIX can be traded here is a chart from the Vantagepoint software of the VIX, with the A.I. forecast coming in to the 2020 Presidential election. Two weeks ago the VIX was at 27, and while I write these words, two weeks later it is over 37. Emphasizing what this means, two weeks ago, normal was defined that the market would be 27% higher or lower annualized. Today that forecast has increased to 37%.
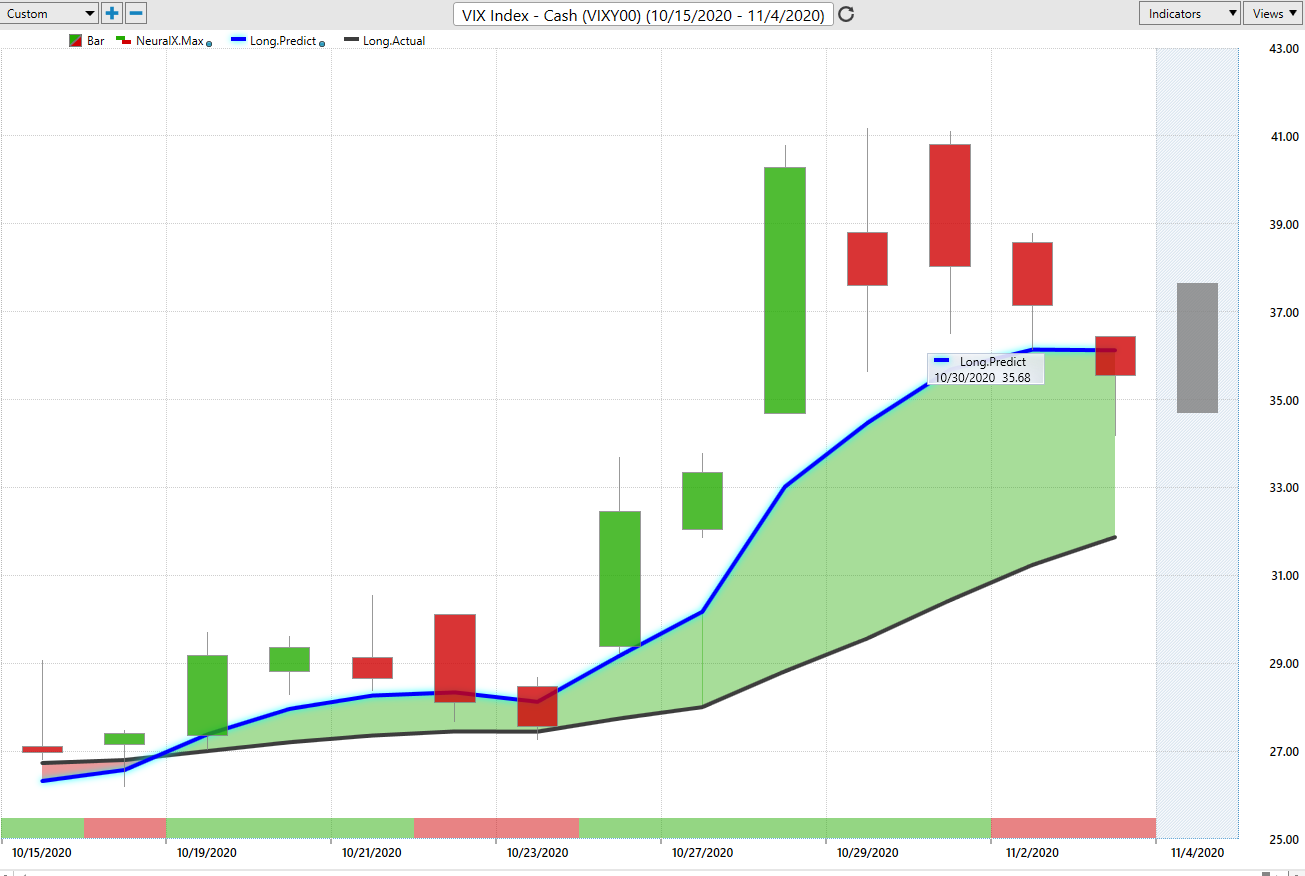
Had a trader purchased the VIX at 27, they would be sitting on 37% profit. What makes that possibly enticing is that it occurred in a very short time frame of two weeks. Instead of having to purchase a stock or other underlying asset, a trader was simply speculating that the risk would increase in the market as we approached the Presidential election.
This is how Volatility is often traded by professional traders. Huge uncertainty provides an opportunity to for a trader to simply get long the VIX. Likewise, after a huge burst up, there is a very high tendency for the VIX to return to its long-term average and this gives traders the opportunity to SELL the VIX short.
One final analogy is in order.
I want you to think about VOLATILITY like the temperature on a thermometer. Regardless where you live in the world you probably know what the extreme temperature points are for your region of the world. Nationally, if it is August and 120 degrees Fahrenheit outside, it could get hotter, but the historical probabilities clearly would favor that the temperature longer term will get cooler. Likewise, if it is 20 degrees below zero, in January, the probabilities historically favor a warming trend.
Here are four points to remember about volatility if you’re new to it:
- Volatility usually increases when the market falls.
- Be aware of extreme points in volatility to look for opportunities to buy and sell the VIX.
- Volatility increases during events/reports which promote uncertainty and rapid change.
- The VIX measures annualized volatility and risk.
- Increases in Volatility make it harder to effectively pick individual stocks.
Volatility trading can be a very profitable way to trade the markets. One key advantage is that it doesn’t matter whether the market swings up or down. All that matters is that it swings. This makes volatility trading very attractive for many traders.
Combining Volatility Trading with Artificial intelligence can be a very powerful niche of the market for you as a trader to exploit.
Remember that A.I. is so powerful because it learns what doesn’t work, remembers it and then focuses on other paths to find a solution. This is the Feedback Loop that is responsible for building the fortunes of every successful trader.
Artificial Intelligence applies mistake prevention as a continual process 24 hours a day, 365 days a year towards whatever problem it is looking to solve. A.I. is particularly powerful at forecasting changes in volatility as well.
It’s a game-changer and a winning combination.
Find the trend in volatility.
Scrutinize the 1-3 day forecast.
Enter a risk managed position with very limited risk..
Be beautifully positioned before the herd even knows what happened.
Lather. Rinse. Repeat.
The Answer A.I. offers may surprise you.
This is how small traders grow their accounts by finding small exploitable niches where they have a unique, distinct advantage.
Today Artificial Intelligence, Machine Learning and Neural Networks are an absolute necessity in protecting your portfolio.
I, like everybody else, have my opinions about what will happen next. But I never let my opinion get in the way of what the artificial intelligence is forecasting.
While reporters, talking heads and analysts want to discuss esoteric economic ideas, my only loyalty as a trader is to the trend! This is how Vantagepoint artificial intelligence simplifies and empowers traders daily!
Intrigued? Visit with us and check out the a.i. at our Next Live Training.
Discover why artificial intelligence is the solution professional traders go-to for less risk, more rewards, and guaranteed peace of mind.
It’s not magic. It’s machine learning.
Make it count.
IMPORTANT NOTICE!
THERE IS SUBSTANTIAL RISK OF LOSS ASSOCIATED WITH TRADING. ONLY RISK CAPITAL SHOULD BE USED TO TRADE. TRADING STOCKS, FUTURES, OPTIONS, FOREX, AND ETFs IS NOT SUITABLE FOR EVERYONE.
DISCLAIMER: STOCKS, FUTURES, OPTIONS, ETFs AND CURRENCY TRADING ALL HAVE LARGE POTENTIAL REWARDS, BUT THEY ALSO HAVE LARGE POTENTIAL RISK. YOU MUST BE AWARE OF THE RISKS AND BE WILLING TO ACCEPT THEM IN ORDER TO INVEST IN THESE MARKETS. DON’T TRADE WITH MONEY YOU CAN’T AFFORD TO LOSE. THIS ARTICLE AND WEBSITE IS NEITHER A SOLICITATION NOR AN OFFER TO BUY/SELL FUTURES, OPTIONS, STOCKS, OR CURRENCIES. NO REPRESENTATION IS BEING MADE THAT ANY ACCOUNT WILL OR IS LIKELY TO ACHIEVE PROFITS OR LOSSES SIMILAR TO THOSE DISCUSSED ON THIS ARTICLE OR WEBSITE. THE PAST PERFORMANCE OF ANY TRADING SYSTEM OR METHODOLOGY IS NOT NECESSARILY INDICATIVE OF FUTURE RESULTS. CFTC RULE 4.41 – HYPOTHETICAL OR SIMULATED PERFORMANCE RESULTS HAVE CERTAIN LIMITATIONS. UNLIKE AN ACTUAL PERFORMANCE RECORD, SIMULATED RESULTS DO NOT REPRESENT ACTUAL TRADING. ALSO, SINCE THE TRADES HAVE NOT BEEN EXECUTED, THE RESULTS MAY HAVE UNDER-OR-OVER COMPENSATED FOR THE IMPACT, IF ANY, OF CERTAIN MARKET FACTORS, SUCH AS LACK OF LIQUIDITY. SIMULATED TRADING PROGRAMS IN GENERAL ARE ALSO SUBJECT TO THE FACT THAT THEY ARE DESIGNED WITH THE BENEFIT OF HINDSIGHT. NO REPRESENTATION IS BEING MADE THAT ANY ACCOUNT WILL OR IS LIKELY TO ACHIEVE PROFIT OR LOSSES SIMILAR TO THOSE SHOWN.
[/fusion_text][/fusion_builder_column][/fusion_builder_row][/fusion_builder_container]


