


Welcome to the Artificial Intelligence Outlook for Forex trading.
VIDEO TRANSCRIPT
Hello everyone. Welcome back. My name is Greg Firman, and this is the VantagePoint AI Market Outlook for the week of June 1st, 2021.
U.S. Dollar Index
Now, to get started this week, we’re going to begin where we always do at that very important US dollar index. Now, this coming week is a make or break week for the dollar. It’s going to be heavily data dependent on the nonfarm payroll number to see if the labor market is actually improving in the US. Will the fed start to loosen its grip on the market and start again even just think about raising rates here or changing their opinion? But that’s a whole nother session in itself.
Now, again, this outlook is primarily based on the VantagePoint software. You can add additional tools that you may be using, financials, wave theories. A number of different other tools that you can use, but this is predominantly using the VantagePoint software in its forecasts.
Now, when we look at the dollar, we’ve had a move up as I stated it in last week’s weekly outlook. I anticipate the dollar would strengthen by the end of the week as we look at these cycles in the dollar. Now, in most cases, the cycle in the dollar is the dollar is strong at the end of the month into the first week of the new month. But we do not see this cycle in July, in August. We will reach that cycle of dollar buying will likely resurface back probably in September again. But for now again, in the month of June, that dollar buying cycle has been accurate about 70% of the time.
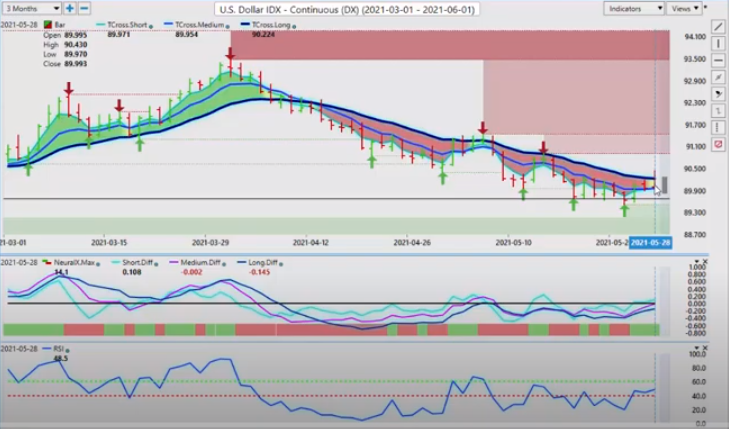
So we’ve already seen a big spike down in the Euro on Friday. Gold is holding its value. But again, when we look at the dollar, the exact failure point is 9022. Now, as the dollar comes up and attempts to break through that VantagePoint level, we had a significant failure going into the end of the trading day, closing the day at 8999.
Now, we’ve held above this yearly opening price. The entire week, you can see the bulls and the bears are fighting it out pretty heavy right around this year of the opening price. A clean break of 8990. We’ll see this go much lower. Now, some of the tools, different tools that people use. Somebody had stated on here giving Elliott Wave Forecast. When we look at dollar institutional buying, that’s almost impossible for something like Elliot Wave to forecast that because you’ve got large institutional funds that are required to buy dollars. Governments, hedge funds, settling trade balances, all of these things.
Usually these orders come in when the dollar appears to be at its weakest, when it appears there’s going to be a breakout. We saw this past week with the Euro-US pair is it broke above the yearly opening price at 122.38, was an absolute bull trap up there. We’ll look at that in a minute, but for now, I believe we are coming into a holiday short week. The ADP report is pushed out until Thursday. Then we have the nonfarm payroll number on Friday. We are going to see a very, very volatile week.
Now, in last month when the US was supposed to come up with about a million jobs and only came up with 240,000, we saw a spike in gold prices prior to that number being released. We actually saw that spike on the Tuesday, which I found very, very odd. So I would advise everybody to keep a very close eye on the correlated markets this coming week to see if there’s anything kind of funny going on there, because I believe that number was leaked before that. And that’s why money was moving out of the dollar and into gold, when in most other cases in that particular week, you’ve got institutional buying.
So if we can clear 90.22, the dollar may come off, but either way, the dollar usually does not have a great month in the month of June. So when we click on our F8 in our VantagePoint software, we do have a two-day close above the long predicted. Now, this is a two day rule that I’ve often discussed at some of the seminars in Tampa and the VantagePoint live training room. I don’t like to bite on the first time we move above this. I want confirmation that we’re holding above this.
So our support for the dollar comes in at 89.94, the yearly opening price at about 8980. We know exactly where our support is, but we must break through the 9022 area. Our neural index is positive, but we are not holding above 50 or the 60 level, and the predicted RSI. The predicted differences are rising and they’re pointing upward. So these are all good signs that the dollar will strengthen next week, at least up until the Thursday prior to the nonfarm payroll number.
S&P 500 Index
Now, when we look at the stock market going into next week, continue yet another new triple EMA cross from VantagePoint, but we do a very stiff resistance on this verified high at 4238. We must break through this level if the equities are going to continue to move up. I believe it’s unlikely that that’s going to be next week, but it could be the week after if we get a payroll number. Now, the signal to watch here on stocks where I could be wrong and we could be moving lower is we do have the medium term crossing the longterm predicted difference to the downside. But it’s not with the neural index. We need the neural index to be in agreement with the MA div cross. If that completes, then we would at least have a retest back down to the 4170 area.
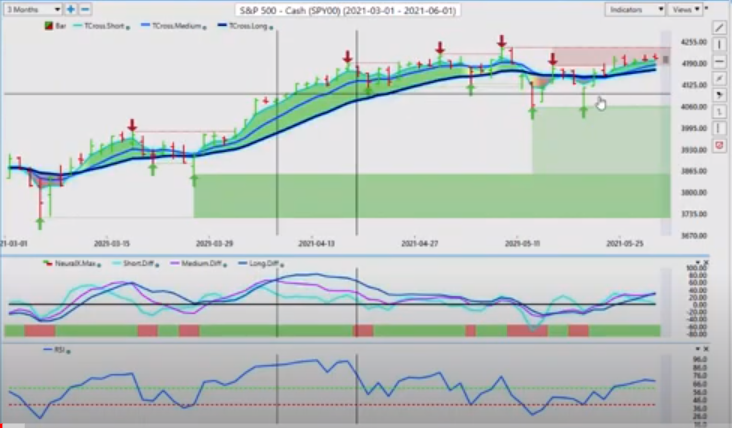
Now again, when we use that predicted moving average by itself, we’ll be looking for the S&P 500 to hold above 4190 to confirm it’s still bullish, but that very ominous verified resistance high at 4238. We need to get through that very, very soon.
Now, as we look at some of our main commodities starting with gold, now, arguably there could be a seasonality in play here, but part of that seasonality, I would also argue is that we don’t have a dollar buying cycle in July and August. And I’m simply putting that out there that, that could be one explanation for that seasonality is that there isn’t dollar demand around at the beginning of July and the beginning of August. The dollar demand buying dries rate up. So that could assist this.
Gold
Now, if we get a poor non-farm payroll number on Friday, you can pretty much take it to the bank that Gold is going to blow through the yearly opening price. But as you can see, once again, we had a false break above 1904, the yearly opening price only to retreat back inside of it, but a very, very shallow retracement here guys. When we look at this, we’re holding along the VantagePoint medium T cross. When we click on the key VantagePoint level or T cross long, 1862.
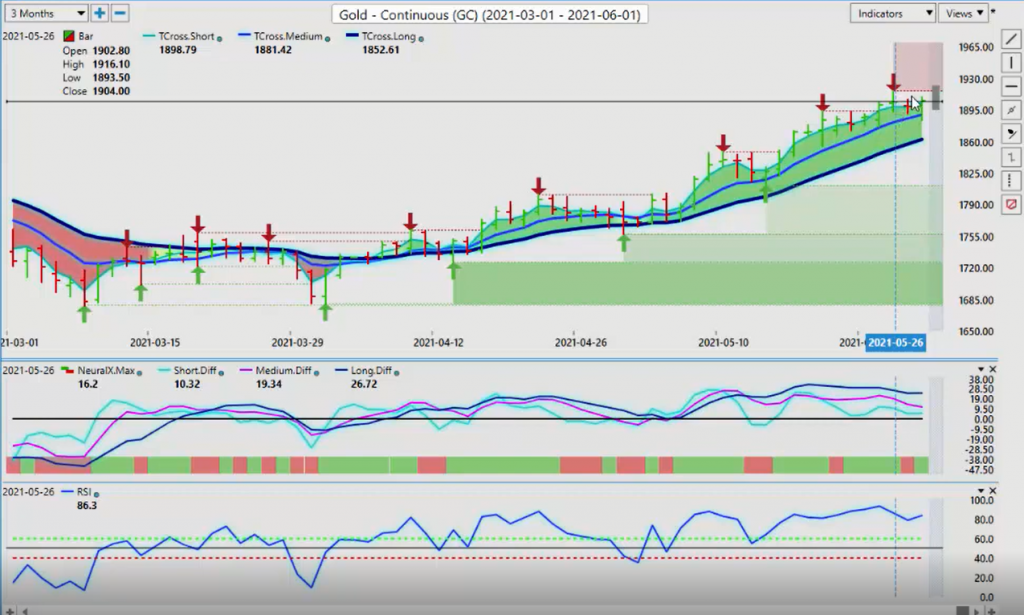
Longs are still in play in gold while we’re above that level. When we click on our F8, you can see gold continuing to hug this along. We broke down below this, but this guys is intraday noise. Okay? Because we broke down below that predicted moving average, we did not break down below the T cross long, and we did not close below this blue line. Using that predicted moving average by itself, you can see that’s a highly effective entry point.
So when we look at gold to start the week, our predicted low on gold is 1895 and our long predicted is also at 1895, making that a very reasonable entry point for a long trade. Now, the only downside to that potential long trade is the time of the month that we’re in. Because remember when we look at all of these conventional theories, Gann theory or Elliot Wave. Elliott Wave is largely based around impulse buying and selling. But we’re not dealing. An institutional flow of dollar buying is not impulse buying or selling or retail traders, it’s institution. It’s a blind order that starts coming into the market that most retail traders don’t see.
So that could cause gold to pause out here, or maybe pull back towards that 1862 level prior to the market actually getting ready to advance the other way. So we want to make sure we’re being very, very cautious around that, that there’s a bull trap or a bear trap forming in that particular area. And again, for now, gold remains along for the time being.
Crude Oil
Now, as we look at oil going into next week, once again, oil is getting very, very toppy up at these particular lofty levels. So when I look at the oil contracts again, we’ve got some strong verified resistance up there, and that particular risk resistance is coming in on this swing high, that high at 6702. So we don’t have a lot of buyers up here at the current time, but the VantagePoint indicators still remain firm that oil is going higher.
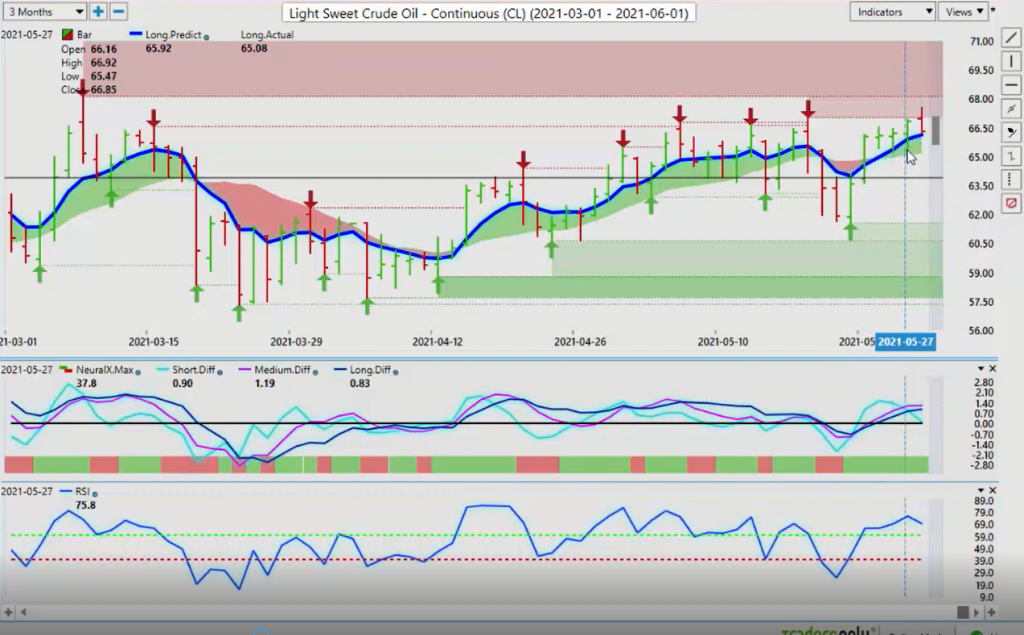
So we can see we’ve got our medium term crossing our longterm predicted difference. Our neural index remains a solid green. We’re holding above our T cross long at 6521. But the one you really want to watch here, guys, the key level is 6613, the long predicted. You can see that the market is using that VantagePoint predicted moving average as a pivot point actually for buyers to come back in.
We continue to make new highs, but we’ve got to close above that swing high at 6702 if we’re going to have any shot whatsoever of taking out this additional swing high at 6811. Now, a lot of heavy resistance in here, and I believe that 6811 ultimately either way is going to hold.
Bitcoin
Now, as we look at one of my favorites here, Bitcoin, under pressure, again, this week, a lot of back and forth with this, but once again, with Bitcoin, we remain firmly above that yearly opening price at approximately 29,000. We had a big sell off almost right down to that level, only for the market to turn around and go right back up again.
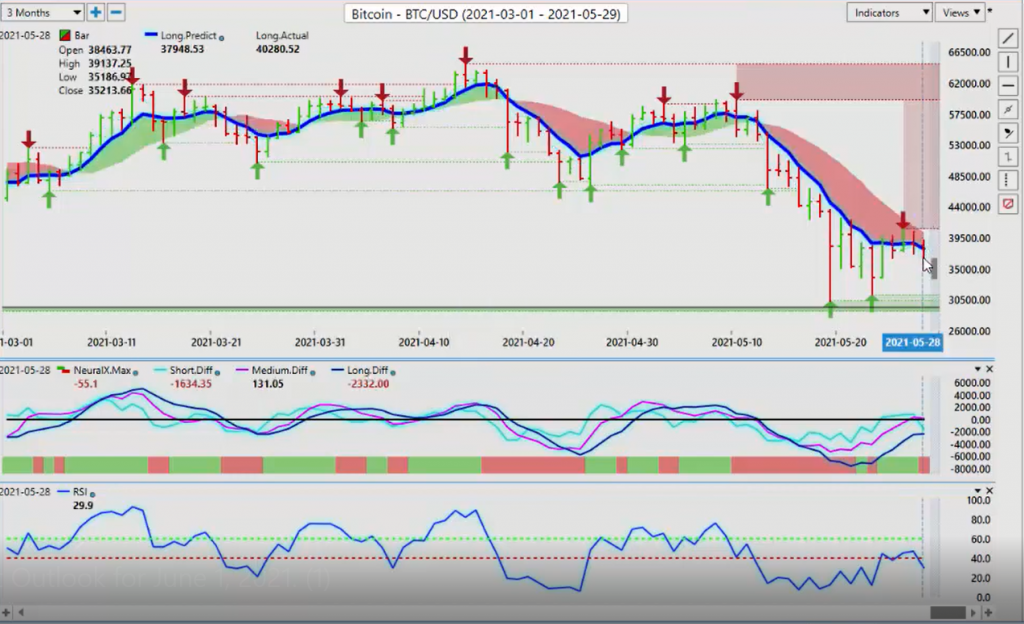
But we’re not clearing these key VantagePoint levels. The T cross long 42,338, one of my favorite plays here. Two ways we can do this guys. We can stay out of this chop down here and put our limit orders to buy this at about 42,350 or in the alternative. Again, one of my favorites is putting limit orders just above the long predicted at 37,984. Sort of approximately 38,000. A buy limit order is sitting up there, but this particular level here, this verified high at 4077 is a little concerning to me.
So again, I think I would be if I was using that straddle strategy, I think I would be more inclined to use the about 40,750, 40,780, somewhere around that area. If we can clear this verified resistance, then we should move higher. But the VantagePoint indicators are not overly supportive of further longs on Bitcoin at this time as our neural index is down. We’ve had a failure at the 50 level and the predicted RSI. And the predicted differences are starting to flatten out and potentially getting ready to turn to the downside.
Euro versus U.S. Dollar
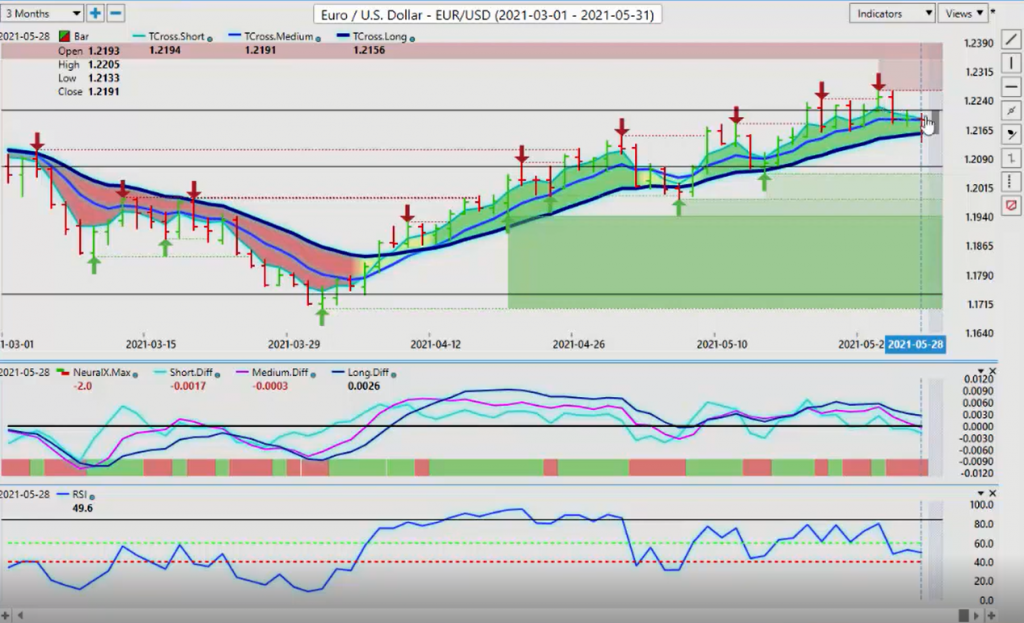
Now, as we come into some of our main Forex payers here, once again, we start at the top of the food chain here, the number one traded Forex bear, Euro-US. Now I warned everybody in last week’s weekly outlook of a bull trap being set up here. I believe that there is still a strong possibility that the Euro can move above the 12240 area in the month of July and August. But it needs to get moving and it needs to get moving very fast.
Now, this move will be completely data dependent. If we get a very, very strong nonfarm payroll number, that should hammer the Euro down. But you can see what they’re doing to you here. On Wednesday or Tuesday and Wednesday, I believe it was Tuesday, they pushed the Euro all the way up to a high of 12266. But you remember what I’ve also stated that we’re looking for that two day close above the yearly opening price that a move off of that level or retracement back to 12240, and then we’re going to go higher probably towards the 124 area, but we’re not getting at this time.
Basically, what they’ve done is they’ve purged the market of any longs up here. And this is a classic broker bait and switch here. What this often happens here is that they flush out all the longs. When they drive the market lower, wipe out all the stops, then the brokers get long themselves on this and make money. So there’s a very strong possibility that that level is going to be breached again. Actually believe it or not, we’ve had a strong close on Friday. Not strong close, but we’ve come back to at least where we opened and that’s… Again, finishing off the day is pretty impressive there because we did end up closing out at 12191 after a pretty significant sell off all the way down to 12133.
Now, the indicators from VantagePoint are mixed here, but again, the predicted differences are down. The neural index is down. Our RSI is at 49.6. But remember, we’ve got the Memorial Day in the US on Monday, a holiday short week. Be very, very cautious with this pair until at least Wednesday. Once the market has had a chance to settle or even midday Tuesday, once all markets are back in and we see if we’ve really got buyers on the Euro and not.
And once again with this payer, keep a very close eye on gold contracts. If gold does not hold this level, the Euro is absolutely, absolutely going lower. But if gold does break out to the upside, you want to get long the Euro pretty quick. And I would watch this 12156 area very closely. That’s the line in the sand between bullish and bearish. When we click on our F8, you can see that this is very ominous here that we’ve closed below that long predicted three days in a row, but we must breach the VantagePoint T cross long if short trades are actually viable.
U.S. Dollar versus Swiss Franc
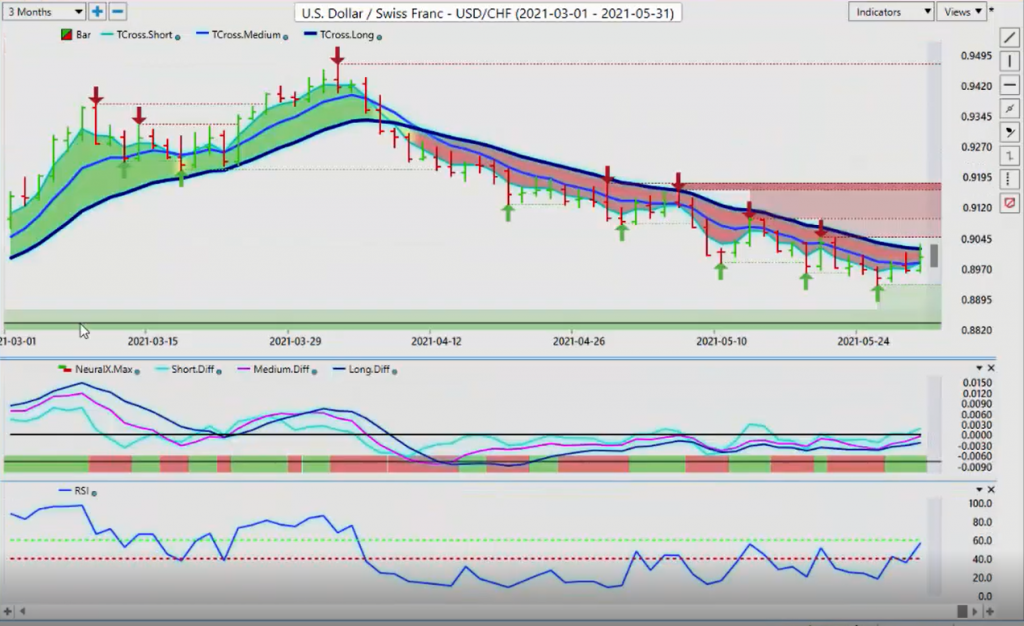
Now, if we’re looking at places of value to buy dollars during a period of known dollar strength, US Swiss Franc is always at the top of the list, because the Swiss Franc is a very low interest rate against… The US is not a high interest rate, but it’s much higher than the Swiss Franc. So what we’re doing is looking for a break of 9020. If we can break above 9020, we have four staggered levels of resistance that go all the way up to the high of 9181. I believe we have a real shot of getting up to that level by Friday, but I also don’t believe that will likely hold up there for very long.
The Tuesday after the non-farm payroll number. In most cases, the dollar sells off either way, but in mid to late June, the dollar is at an even bigger susceptibility of a sell off. So keep that in mind. But the immediate move here is definitely up our medium term crossing, our longterm predicted difference. Neural index is positive, rising RSI. When we click on our F8, we’ve also managed to close above this.
So to start the week, the level that I would watch very closely is 8982. If we can hold above that longs, we’ll definitely be good for at least three or four days here, guys. Now, the same thing would apply to the dollar yen. You can see that both… And this is very strange because as I’ve often said, I’ve seen the us dollar and gold move up and down together for upwards of two months at a time over the many years that I’ve been doing this, but this is odd that gold is moving up and US-Swiss Franc is moving up and Dollar-Yen is moving up because usually when gold is strong, so is the Swiss Franc and so as is Yen.
U.S. Dollar versus Japanese Yen
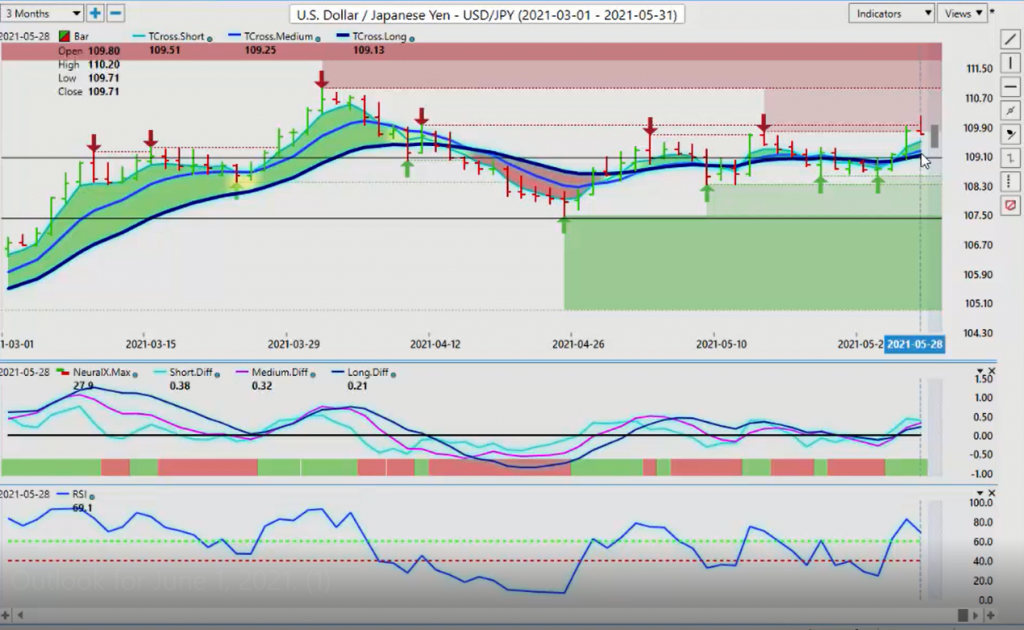
So we may be just on borrowed time with these longs, but the yen did make a very strong move up on Thursday, little bit of follow through on Friday, not the best. We’ve just got to get above this verified high at 10996. If we can get above this area, then the Dollar-Yen should move aggressively higher. But if we get a bad nonfarm payroll number here, guys, and again, we’re going to keep saying this. We’re in a week where we’re data dependent, right? We’ll be back at 10913 in a heartbeat. And again, keep an eye on rising gold prices because they could be the trigger that we’re looking for to actually set shorts, reversal shorts on this particular pair.
British Pound versus U.S. Dollar
Now, once again, what the pound dollar here, the pound is just simply unable to breach this 14240 area. If we think of it in Forex and it’s basic terms here, which is buying or selling US dollars in places of value to do that, let’s assume that the Euro does go higher. But remember, if the Euro goes higher, Euro, great Britain is going to go higher. So they’re going to be buying Euro US and selling Great Britain-US.
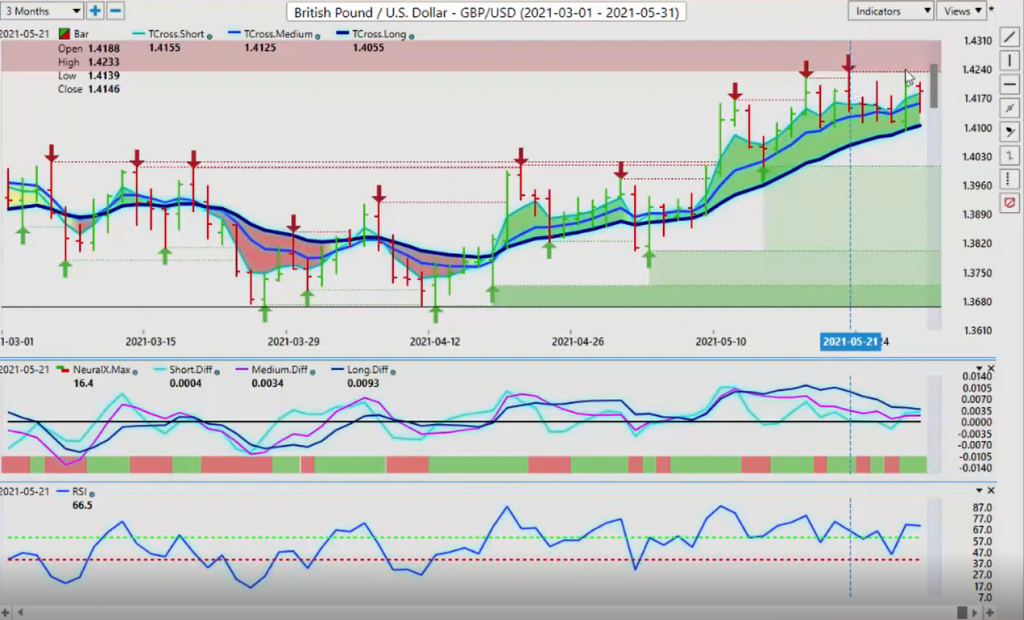
Now, if that’s the case, and we’re in a period of known dollar strength, our short at around 14240 could be a very, very good short-term play just for the week. So again, watch for a breach of the 14233 area by about I’m guessing 30 to 50 pips. And then a violent reversal, much like what we saw on Euro-US on Thursday. I would be willing to bet that that’s what actually happens because the powers that be that need to buy dollars, they’re looking for places of value to do it. And this very well could be a place for that. So watch that level very closely.
Currently, we do have EMA div cross to the downside, which is a good thing. Our neural index is still up, but our RSI is telling us we have very, very little momentum here. Now, if we click on our F8 on this one, you can see that we’re on either side of this predicted moving average. We are not in a trending move. We are basically at a standstill. So we’re looking for it to either hold above 14172 or hold below 14172. That’s the play here guys.
So pick your poison. My view is that there’s going to be more pressure to the downside than the upside just for this coming week. Now, as we look at one of my least favorite pairs these days, which is the US Canadian pair continues to grind lower and for reasons that are simply… It’s very, very odd.
U.S. Dollar versus Canadian Dollar
As I’ve stated many times, Canada, for the most part is still in lockdown. We’re not doing that well with COVID at all compared to the US and some of the other countries. But the Canadian dollar got a huge boost of strength based around the comments from the Bank of Canada that they plan on raising interest rates before the US.
I don’t believe that that is what will happen one bit. I believe the US will raise rates long before Canada will. And Canada is going to be… They’re going to have to leave rates… Because again, our economy has been shut down for well over a year here. We’ve had bits and pieces where we’ve opened up only to close down two weeks later. So once again, we’ve got heavy, heavy support building down at the 12012 area.
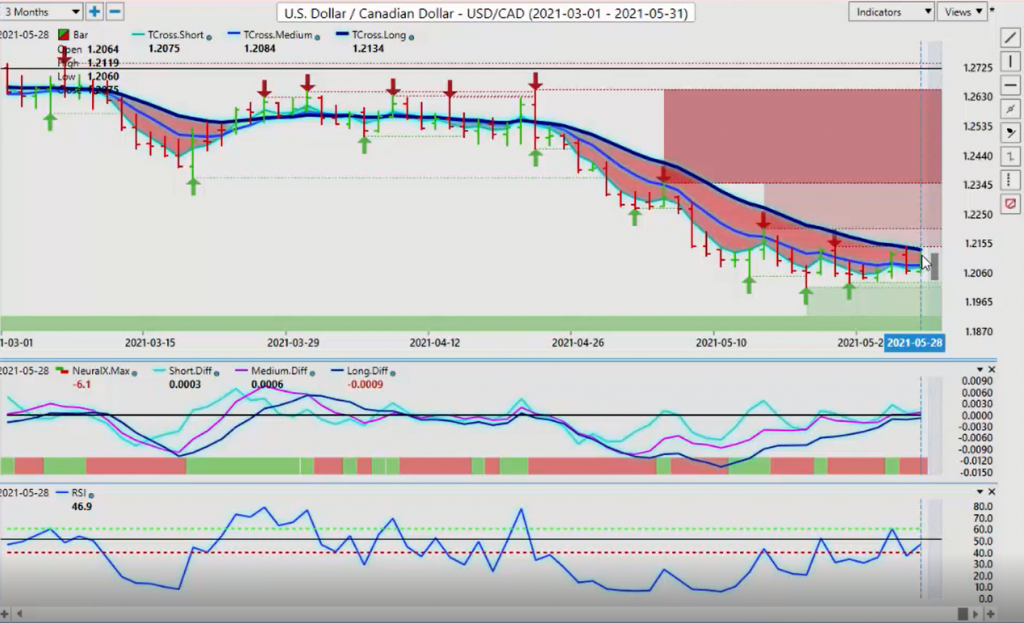
In my respectful opinion, only longs are viable while this support holds. Our predicted differences in a very sneaky way are rising above the zero line. And again, this is why we use alternate indicators measuring two different markets, meaning the medium term crossover and the longterm crossover is built in to these predicted differences.
Now, our neural index is still down, but very often when I’ve seen this reverse check mark like this, this is usually a warning sign that this move to the downside has peaked, and that’s about it. So we’re looking for a reversal. I would like to see us break and hold above 12134 and then we should be good to go for longs. Now, when we click on our F8, you can see if you want to get closer to the fire here, that pivot level is 12080.
Australian Dollar versus U.S. Dollar
I will argue that if we can hold above 12080 by Wednesday, we have a real shot of taking out these two verified resistance highs. So again, keep an eye on these key VantagePoint pivot levels and know how to use them in your trading. With Aussie-US and New Zealand-US, the New Zealand is the winner between these two, and that’s largely based around the selloff on the Australia New Zealand pair.
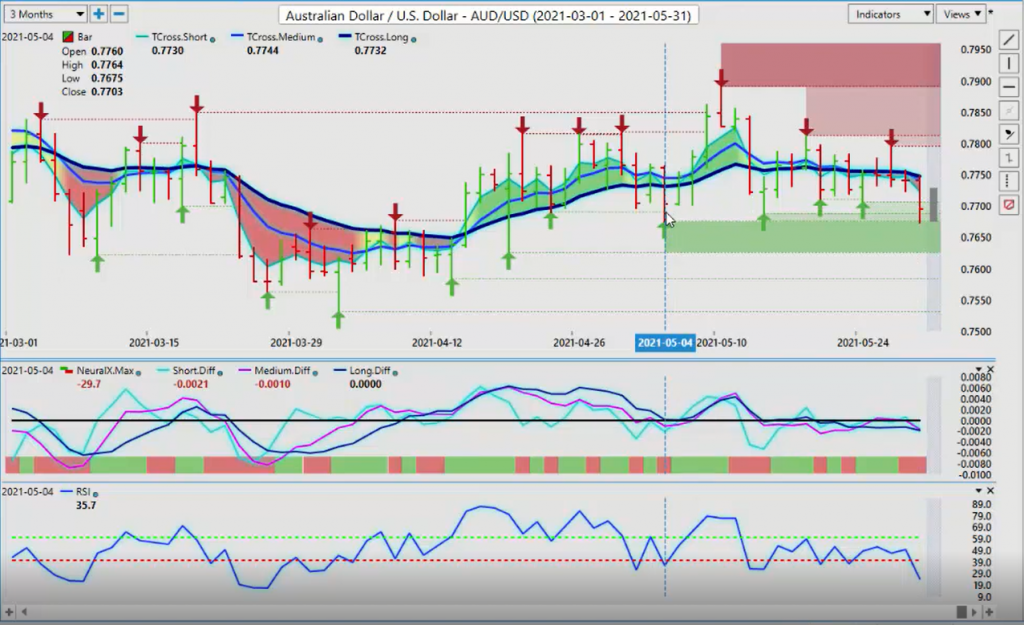
But right now, we’re coming into a strong, verified support low. That’s coming in at 7675. We also have the yearly opening price on this pair, by the way, around the 77 mark. I believe that ultimately going into July, August, and September, that the Aussie and the New Zealand will outperform. I believe that they will ultimately hold above their respective yearly opening prices and advance from there. But we must get through this choppiness. So right now, the support low 7675. The additional heavy verified support level is coming in at, or about the 7626 area.
New Zealand Dollar versus U.S. Dollar
That’s your buy zone, in my opinion, because we’re pretty confident that the dollar is going to strengthen for most of this coming week, but we’re also pretty confident that dollar will sell off a week Tuesday after the nonfarm payroll number, regardless whether it’s a good number or bad. That’s the pattern that I’ve seen form. Then we go into the seasonality, if there’s a seasonality in gold at that time, that’ll put additional pressure on the dollar. So there’s a lot of things that are building up against the dollar here in short and we would watch the same thing.
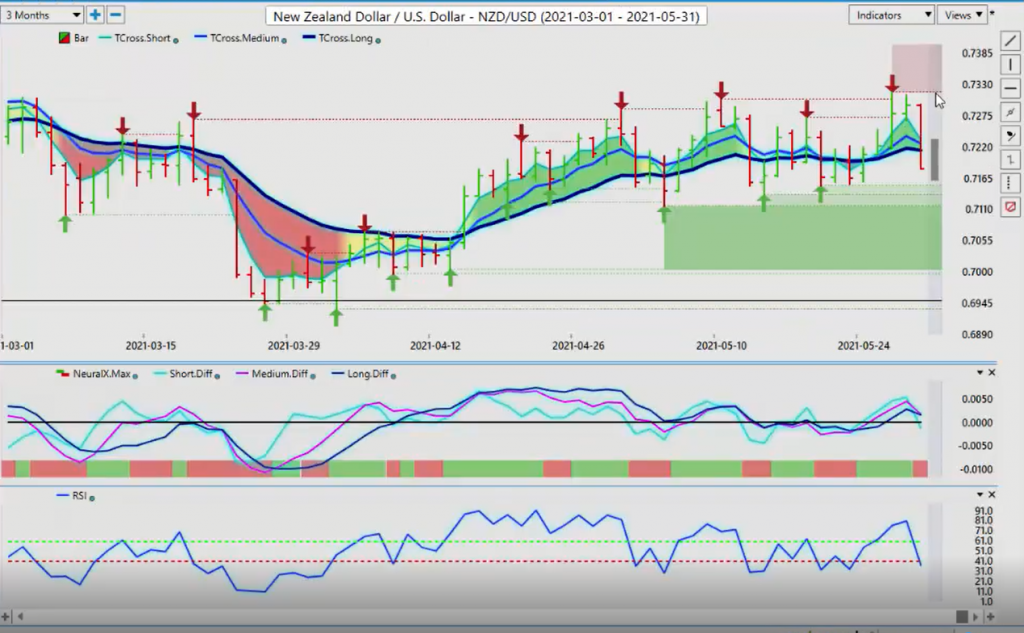
Always remember, the Aussie and the New Zealand for the most part is a very similar trade. So when the dollar came up with that strength on Friday, it really hammered these down. But again, a lot of that is profit taking, going in to a holiday long weekend. These same traders that were holding longs the entire week, they’re taking profit because they know there’s a holiday long weekend in the States, but they’re likely going to be looking to go in and get long again when they come back in on Tuesday. So late day Tuesday, early Wednesday, look for reversal higher on Aussie-US and New Zealand-US. It’s entirely possible.
So we have a very, very busy week here, guys, and a very choppy week to say the least with that payroll number, because that is going to set the tone here for the remainder of this quarter going into September. So once again, this is the VantagePoint AI weekly outlook for the week of June 1, 2021.


