


Whenever stocks crash you’ll see the term “meltdown” thrown around in the media to describe the phenomena of lower prices hitting the marketplace. But have you ever heard of a financial MELTUP? You can probably guess a meltup is the opposite of a meltdown.
In a meltdown, investors are looking for any reason to sell. The attitude is safety will be found someplace other than stocks, and the prevailing perspective is to head for the sidelines as quickly as possible. In a “meltup” the prevailing perspective is that financial assets offer an attractive store of value.
A meltup is a sustained and often unexpected improvement in the investment performance of an asset or asset class, driven partly by a stampede of investors who don’t want to miss out on its rise, rather than by fundamental improvements in the economy. Logic is often secondary.
Meltups can result in increases of anywhere between 20% to 100% for the major market indexes.
During all of 2020, during the pandemic and economic lockdown, I highlighted an investment/trading thesis that because of the massive stimulus hitting the markets that as the currency was being debased that we would see investors gravitate towards three assets to protect their purchasing power. Those assets were bitcoin, stocks, and gold. The results of that perspective are as follows:
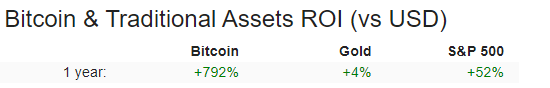
This fundamental perspective was rooted in understanding that “money” is what moves markets. When the government prints money at an unprecedented rate, the one thing you can rely on is that the value of that currency is being diluted. In other words, the purchasing power of the dollar is quickly being eroded and investors and traders run into financial assets to protect their purchasing power.
One of the major “talking points” you’ll see in the financial media is an analysis of the Consumer Price Index to confirm if inflation is rearing its ugly head again. While this debate is entertaining to watch, it’s about as productive as thinking that championship wrestling is real! The Consumer Price Index has risen 1.4% in the last 12 months. The talking heads will throw this number around as to the effectiveness of the central planning on steroids we have witnessed over the past year. Nobody wants to ask what the CPI is measuring? While it may be hard to believe, the economists and bureaucrats are constantly removing anything from the Consumer Price Index which disagrees with their narrative. Why is housing not included in the CPI? For example, the Case-Shiller Home Price Index is a price index of housing. In the last 12 months it has risen 8.6% nationally. Or consider, that the Rogers International Commodity Index which measures raw commodity prices. Over the last year it is up 26.7%. Why aren’t raw commodity price included in the CPI? Or health care costs? Insurance? Etc.?
Lumber prices have doubled. Oil and gas prices have skyrocketed! The point that I’m making is in the United States, there are over 100 price indexes not incorporated into the Consumer Price Index. If any of them were, we would quickly see that prices are easily rising at better than 10% annually.
It sounds hard to believe.
Yesterday, I went grocery shopping and experienced something I haven’t thought about in quite some time. I purchased many of my favorite brands and products and noticed new packaging and designs. Upon studying the changes closer, I saw that these products kept their pricing the same but reduced the size of their offering. Products were roughly 10% smaller and being offered for the same price I’ve paid for the last year. How special! Most consumers won’t notice, but for me it is a clear signal that currency debasement is resulting in higher prices, even at the grocery store. I’m paying the same at checkout as normal, but receiving 10% less. Do your own research the next time you go shopping. This is why and how so many government statistics have become a truly slippery slope and are completely disconnected from the true consumer experience.
What concerns me most as I write these words is that at the late stage of bubbles we witness manias or really crazy and excessive behavior on the part of investors and traders. A recent poll by Yahoo Finance reported that 28% of all Americans purchased Gamestop (GME) several weeks ago. The median purchase was only $150 but over 43% of those surveyed had just opened their first brokerage account that month.
Huge volatility is the fingerprint of a meltup. All we need to do is look at a little history to appreciate this.
The overarching theme now is that the government is printing money like it doesn’t matter. But if you do some simple basic arithmetic you will understand what all the volatility is about. During October 2020, year-over-year (YoY) growth in the money supply was at 37.08 percent. Did you increase your earnings, salary, ROI, year over year, by that amount or more? If not, your real returns are negative. Once the US government finishes the implementation of the next $1.9 trillion stimulus package, they will have increased the US dollar supply by 40% in the last 12 months. Think about that for a second. There will be 40% more dollars floating around the economy.
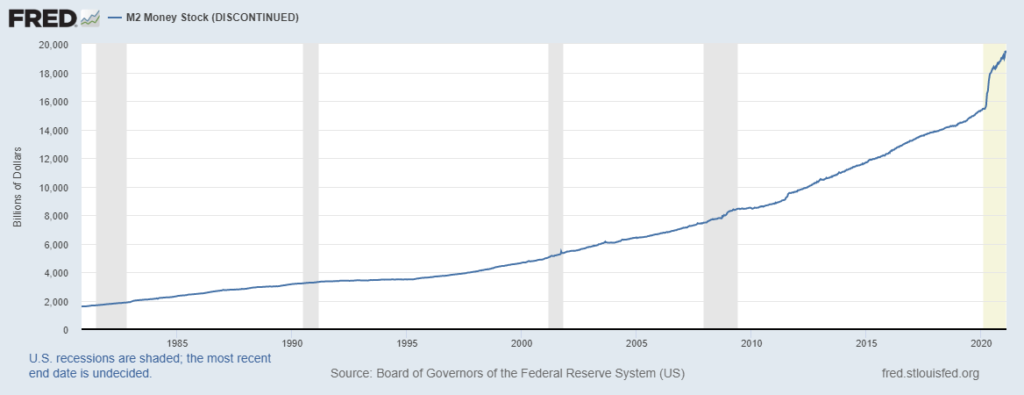
This simple fact appears to be completely ignored by most people in the mainstream conversation. This amount of new money floating around in the economy is what is causing all asset prices to rise. It is the source of this “MELTUP.”
And to top things off they are now throwing around another $3 to $4 trillion stimulus in the next few months.
A short history lesson is in order.
The NASDAQ soared over 390% between 1996 and 2000. M2 Money supply grew 42% over that time frame. In 1999 and 2000 things heated up to a fever pitch where the market rallied over 109% in a few months. This was the Mother of all Meltups.
According to the Warren Buffett indicator valuations are 40% higher today than in 2000. The difference clearly is that the money supply growth was not at stratospheric levels in 2000.
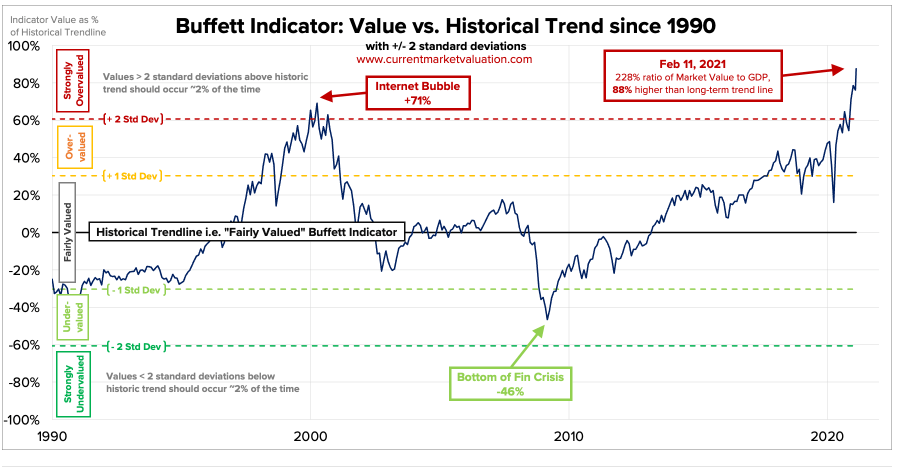
According to the Warren Buffett indicator valuations are 40% higher today than in 2000. The difference clearly is that the money supply growth was not at stratospheric levels in 2000.
In that amazing NASDAQ run between 1996 and 2000 the market had 5 massive pullbacks of 10% or more along the way.
The NASDAQ – hit another scary benchmark record last month. From its lows, it was up 105% in 47 weeks. That is the best 47-week performance in the 50-year history of the index.
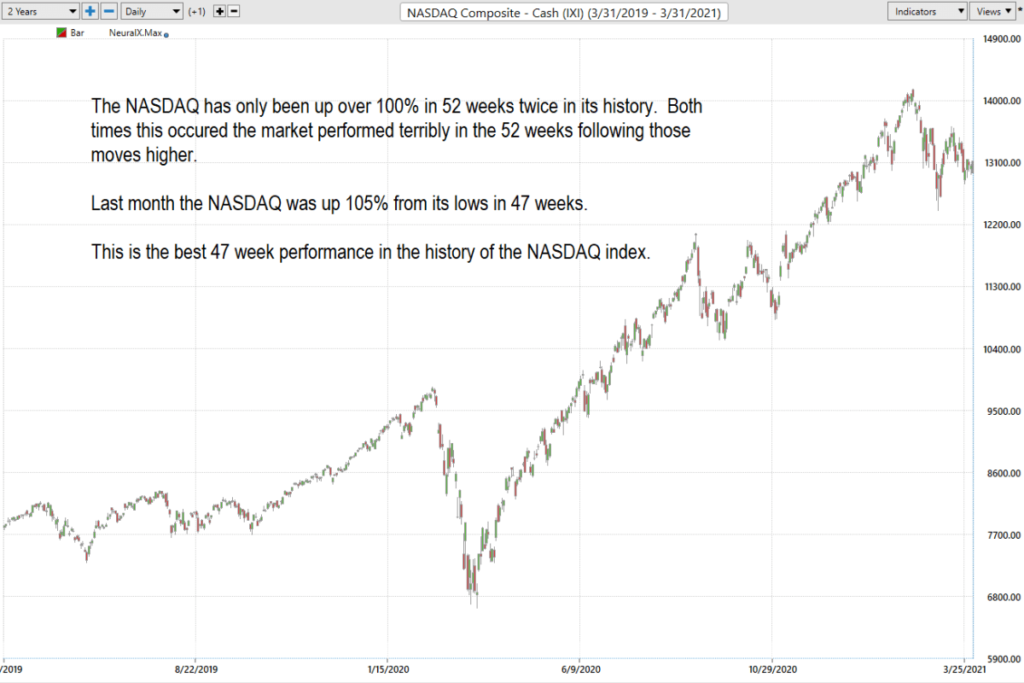
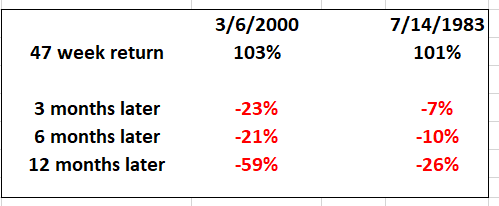
The NASDAQ has only been up over 100% after 47 weeks twice in history… The last two 100% moves ended in March 2000 and in July 1983. The stock market performed terribly immediately after those huge moves higher.
The reality is that 10% corrections are common in Meltups. We just saw one… Expect to see more in the months ahead.
My fundamental perspective is that market sentiment and performance are both hitting bubble levels. And that tells me the top is near. But….and this is a big but…this could be like 1999 all over again where the NASDAQ in the last innings of its meltup ran 109% higher before tumbling down to more rational levels. The current battle cry of almost all Wall Street Insiders is that they want more stimulus now!
When you turn on the financial news today these are the top talking points when it comes to stock market analysis:
- Super high stock valuations have not mattered for years
- The Federal Reserve has promised low interest rates the next two years
- The economy is recovering from COVID-19 and economic lockdown
- The new administration in Washington D.C is spending more money than at any time in history
All of those points are true.
But markets peak when there is nobody left to buy. That is all you need to know. We are not there yet. But meltdowns always follow meltups. And this next meltdown is going to be doozy!
What has become totally obvious is that central banks around the world are going to continue printing incomprehensible sums of money– this is ‘whatever it takes’ monetary policy.
Our only decision is how we choose to react.
Trying to make sense of it all will paralyze you. Great traders understand that the only thing that matters in trading is being on the right side of the right trend at the right time. That is what artificial intelligence offers. In this article I have provided my best attempt to analyze the future. However, when trading the only thing that is important is what the A.I. is forecasting.
I think the market is getting frothy. But if the A.I. is still forecasting higher prices I don’t let my thinking get in the way of my trading.
To protect your purchasing power, you need to find strong trends and position yourself accordingly. Otherwise, your purchasing power will melt like an ice cube on a hot summers day.
Moving forward I want you to think long and hard about HOW you are going to trade the markets if you do not have an edge. As the volatility of the past few months becomes commonplace are you prepared?
Think about those losing trades and ask yourself what did you learn from that experience? What is your method for analyzing risk?
Are you capable of finding those markets with the best risk/reward ratios out of the thousands of trading opportunities that exist?
Artificial intelligence is not “a would be nice to have” tool.
It is an “absolutely must have” tool to flourish in today’s global markets.
Knowledge. Useful knowledge. And its application is what ai delivers.
Over the coming weeks, you can rest assured that Vantagepoint Power Traders will continue to build wealth one trend at a time, even in these volatile conditions.
Intrigued? Visit with us and check out the A.I. at our Next Live Training.
Discover why artificial intelligence is the solution professional traders go-to for less risk, more rewards, and guaranteed peace of mind.
It’s not magic. It’s machine learning.
Make it count.
THERE IS SUBSTANTIAL RISK OF LOSS ASSOCIATED WITH TRADING. ONLY RISK CAPITAL SHOULD BE USED TO TRADE. TRADING STOCKS, FUTURES, OPTIONS, FOREX, AND ETFs IS NOT SUITABLE FOR EVERYONE.IMPORTANT NOTICE!
DISCLAIMER: STOCKS, FUTURES, OPTIONS, ETFs AND CURRENCY TRADING ALL HAVE LARGE POTENTIAL REWARDS, BUT THEY ALSO HAVE LARGE POTENTIAL RISK. YOU MUST BE AWARE OF THE RISKS AND BE WILLING TO ACCEPT THEM IN ORDER TO INVEST IN THESE MARKETS. DON’T TRADE WITH MONEY YOU CAN’T AFFORD TO LOSE. THIS ARTICLE AND WEBSITE IS NEITHER A SOLICITATION NOR AN OFFER TO BUY/SELL FUTURES, OPTIONS, STOCKS, OR CURRENCIES. NO REPRESENTATION IS BEING MADE THAT ANY ACCOUNT WILL OR IS LIKELY TO ACHIEVE PROFITS OR LOSSES SIMILAR TO THOSE DISCUSSED ON THIS ARTICLE OR WEBSITE. THE PAST PERFORMANCE OF ANY TRADING SYSTEM OR METHODOLOGY IS NOT NECESSARILY INDICATIVE OF FUTURE RESULTS. CFTC RULE 4.41 – HYPOTHETICAL OR SIMULATED PERFORMANCE RESULTS HAVE CERTAIN LIMITATIONS. UNLIKE AN ACTUAL PERFORMANCE RECORD, SIMULATED RESULTS DO NOT REPRESENT ACTUAL TRADING. ALSO, SINCE THE TRADES HAVE NOT BEEN EXECUTED, THE RESULTS MAY HAVE UNDER-OR-OVER COMPENSATED FOR THE IMPACT, IF ANY, OF CERTAIN MARKET FACTORS, SUCH AS LACK OF LIQUIDITY. SIMULATED TRADING PROGRAMS IN GENERAL ARE ALSO SUBJECT TO THE FACT THAT THEY ARE DESIGNED WITH THE BENEFIT OF HINDSIGHT. NO REPRESENTATION IS BEING MADE THAT ANY ACCOUNT WILL OR IS LIKELY TO ACHIEVE PROFIT OR LOSSES SIMILAR TO THOSE SHOWN.

