


This week’s ai stock spotlight is Carvana ($CVNA)
Carvana ($CVNA) is headquartered in sunny Tempe, Arizona — presumably so management always has a warm climate while explaining cold financial realities. Founded in 2012, it was originally a quirky side-project of DriveTime but quickly morphed into a full-blown disrupt-the-used-car-market mission, led by CEO Ernie Garcia III. Carvana employs thousands of people, all dedicated to the noble calling of selling cars online to Americans who distrust dealership finance managers.
Carvana’s entire business model is basically: “What if you bought a car the way you buy socks on Amazon?” You click. They deliver. You have seven days to decide whether you love it or want to ghost it. It’s simple, elegant, and just crazy enough to work — which is exactly what happened during the pandemic, when everyone suddenly wanted to buy cars without talking to another human being.
Carvana ($CVNA) has become the used-car circus act that somehow not only stuck the landing but kept the audience cheering, as if gravity were just a polite suggestion. In the past 52 weeks the stock has ripped more than 865%, and if you zoom out to the 2023 lows, you’re looking at a 2,000%-plus resurrection that makes the “underdog comeback” narrative sell better than any gently used Prius ever could.
Yet beneath all that market-hero storytelling, the financials still read like the receipts from a disastrous Vegas weekend — bloated debt, punishing interest expense, and a balance sheet with more personality than prudence. The forces pushing the stock higher — short squeezes, surprise flashes of profitability, and a fast-growing marketplace business — create the kind of rocket fuel traders salivate over. But the counterweight is just as powerful: debt that refuses to shrink and insiders who sell into strength. For traders who thrive on volatility, this is a playground. For long-term investors who prefer a full night’s sleep, it’s a nightmare dressed up as an opportunity.
When 2022–2023 arrived, the economy sobered up, interest rates ballooned, and $CVNA cratered 98% — which, in trader terms, means “put it on a watchlist immediately.” As we noted in our February 23, 2023 spotlight and again in July 2023, the meltdown was so spectacular that it practically begged for a reversal. Good traders monitor two things: what’s winning and where a stock sits relative to its 52-week range. When a stock has lost almost all its value, you don’t cry — you put on your “discriminating trader hat” and watch closely for liftoff. And liftoff is exactly what happened.
Carvana isn’t just a car dealer; it’s a logistical octopus. It acquires vehicles directly, reconditions them, photographs them like Instagram models, and ships them to buyers via glass vending machines or flatbeds. It also finances purchases, because nothing pairs better with a used Hyundai than 8% APR.
More importantly for traders: $CVNA now has two businesses — the retail platform and the marketplace segment powered by its ADESA auction acquisition. The marketplace business is the adult in the room, where margins are higher, headaches are fewer, and Wall Street starts seeing dollar signs instead of red flags.
Copart is the role model here — a company that sells fewer units but earns fat margins and trades at a multiple that makes traditional dealers weep. Carvana wants to be like that. Investors want $CVNA to be like that. The question is whether the numbers and math will cooperate.
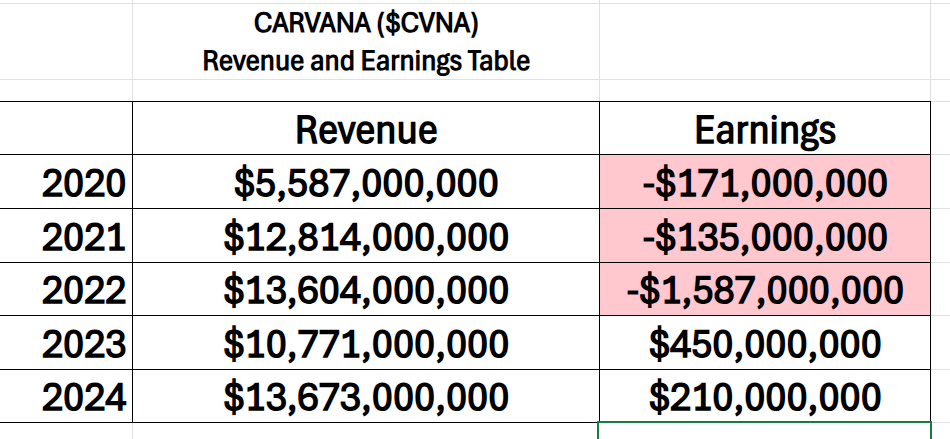
Looking at Carvana’s revenue and earnings table is like watching a high-wire act performed over a financial canyon: impressive distance covered, but don’t look down too long. Revenue has climbed a staggering 145% over the last five years, a growth story loud enough to make even hardened skeptics raise an eyebrow. And yes, 2023 finally delivered the long-awaited turning point into profitability — proof that even companies with chaotic pasts can eventually stick a clean landing. But the numbers also tell a quieter, less glamorous truth: when you add it all up, Carvana has still lost more than $1.2 billion over that same five-year stretch. In other words, this is progress worth noting, but it’s the kind of progress that still carries the faint smell of smoke from all the fires they had to put out to get here.
Below is how CVNA stacks up against notable players.

The takeaway: $CVNA is the high-volatility meme-stock-adjacent disruptor. Everyone else is the responsible adult wearing a seatbelt.
Carvana’s financial condition is like a diet plan that looks good until you read the fine print. For example: “Net income benefited by an $878 million gain.” Translation: “We would’ve been deep in the red without a magic accounting wand.”
Debt sits around $5.5 – 6 billion. Cash sits around not nearly enough ($2.63 billion). Interest expense in Q1 2024 hit $173 million, which is the corporate equivalent of having a mortgage bigger than your house.
Yet, $CVNA appears to finally be making money, after revenue and units sold finally trended upward. They also surprised investors with better margins due to operational improvements. And short sellers, who once held 88% of the float, are still terrified enough to power periodic face-melting rallies.
Here’s the quick financial rundown.
This is not the balance sheet of a sleepy blue-chip. It’s the financial profile of a daredevil on a motorcycle, revving toward a flaming ramp while the crowd bets on whether he sticks the landing.
Now here’s where traders perk up like caffeine addicts spotting a fresh espresso machine.
Carvana’s marketplace segment is growing fast. Marketplace revenue surged 74% in 2023, with gross profit exploding 290%. This segment has Copart-like economics, which is like saying “this Taco Bell finally hired a Michelin chef.”
They posted surprise profitability. And after a two-year beatdown, sentiment turned from “dead company walking” to “holy mother of short squeezes.”
And the biggest catalyst of all: momentum. Momentum moves money. And money moves markets.
Short squeezes + momentum = a stock chart that looks radioactive.
Of course, every Cinderella story has a shoe that might drop — or in this case, an overleveraged boot.
Carvana still carries more debt than some small countries. Interest expenses eat margins alive. Profitability is fragile. Free cash flow is a rumor. And insiders — those mythical creatures who know what’s really happening — are selling shares into the rally.
When insiders sell after a 2,000% run, traders should treat that like a smoke alarm chirping at 2 a.m. It may be nothing… or it may be your wiring melting.
Most importantly: $CVNA’s turnaround narrative depends heavily on operational execution and consistent volume growth. Slippage in either could turn this rally into a cliff dive.
Carvana’s rally isn’t random. It’s the result of traders doing what traders do best: chasing what’s working.
Principle #1: Monitor what’s winning.
When $CVNA started showing life in early 2023 — despite losing 98% of its value — it became a prime candidate for a violent reversal. A beaten-down stock plus improving forecasts is the trading equivalent of spotting storm clouds with silver linings. We mentioned this in our March 2024 writeup and analysis and featured this graphic.

Principle #2: Track where price sits inside its 52-week range.
When a stock is scraping the bottom of that range, every uptick matters. Every news release matters. Every AI forecast matters. And for $CVNA, those signals began flashing green long before Wall Street woke up.
In our May 2024 analysis, we warned:
“Carvana has never been profitable… it is bleeding money hand over fist… it has $6 billion in debt and only $318 million in cash.”
Everything in that statement was true — and yet $CVNA rallied anyway. That’s not financial magic. That’s market psychology, the thing that moves prices far more than spreadsheets ever will.
We pointed out the short squeeze potential and improving metrics. Traders listened, and the stock ripped 865% in 52 weeks.
The lesson is simple: The market doesn’t reward what’s rational. It rewards what’s in motion.
Carvana’s entire narrative is built on contradictions. It is a company with terrible historical cash flow… that just produced a profit. It has debt up to its eyeballs… yet rallies like a gymnast on performance enhancers. Insiders sell… yet traders buy. Short sellers attack… yet the stock keeps climbing.
This contradiction is exactly why $CVNA is a trader’s dream and an investor’s ulcer.
The risk is enormous. The volatility is delicious. The potential for 20 – 40% swings in a single month is practically guaranteed.
The question is not whether Carvana is “worth” its valuation. The question is whether traders can continue milking these swings before fundamentals come knocking — and they always do.
Carvana is one of those stocks that separates the tourists from the professionals. Professionals track trends, watch A.I. forecasts, monitor 52-week range behavior, and size positions intelligently. Tourists buy because their cousin’s barber mentioned a “squeeze coming.”
If you choose to trade $CVNA, do it with respect for volatility and reverence for risk. Use AI to read the trend. Use technical levels to define risk. And use small sizing unless you enjoy the emotional equivalent of skydiving with questionable parachute stitching.
Carvana will likely offer multiple swing trading opportunities in the coming months. Volatility is increasing. Short interest remains high. Marketplace margins are improving. And debt remains the sword hanging above its head.
For seasoned traders, that’s opportunity.
For inexperienced traders, that’s a cliff.
Trade accordingly.
In this weekly stock study, we will look at and analyze the following indicators and metrics as are our guidelines which dictate our behavior on a particular stock.
- Wall Street Analysts’ Price Forecasts
- 52-week high and low boundaries
- Best Case – Worst Case Analysis
- Vantagepoint A.I. Predictive Blue Line
- Neural Network Forecast
- Daily Range Forecast
- Intermarket Analysis
- Our trading suggestion
While we make our trading decisions based upon the ai forecasts we receive within the VantagePoint A.I. software we do consider the fundamentals to better understand the risk and reward profile of this asset.
Wall Street Analysts Price Forecasts
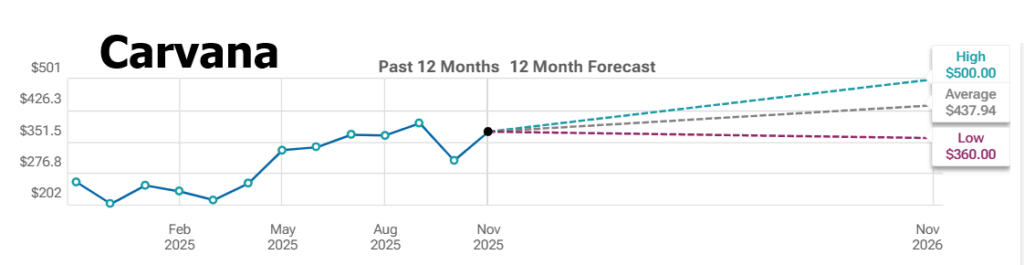
After polling 19 Wall Street analysts over the last three months, the consensus on Carvana is this: an average target of $437.94, a moonshot call at $500, and a doom-and-gloom low of $360. In other words, nobody agrees on anything — except that this thing isn’t boring.
The low end of the range — that timid $330–$360 neighborhood — is where the worrywarts hang out. These are the analysts clutching their pearls over debt loads, used-car loan stress, and whatever macro boogeyman is trending this week. They’re not wrong… they’re just not the folks you call when you’re hunting opportunity.
The high end, pushing $500, is where the gunslingers live. These analysts see momentum, operational tightening, demand strength — and they’re betting Carvana keeps sprinting while everyone else is still tying their shoes.
And that middle zone — roughly $420–$440 — that’s the consensus. The “Goldilocks” forecast. Not too hot, not too cold, and just safe enough that no analyst gets fired for saying it. It’s the market version of shrugging and saying, “Yeah, looks like it keeps going… unless it doesn’t.”
As traders we pay attention to this metric because the variance between the most bullish and most bearish forecast is the expected volatility which currently checks in at $140 or 31% of the current price.
52 Week High and Low Boundaries
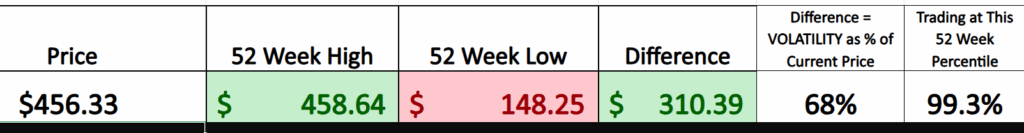
Take a good hard look at these graphics. They’re not just pretty colors and tidy columns — they’re the battlefield map. Price at $456.33, high at $458.64, low at $148.25, and the gap between those extremes clocks in at a monster $310.39. That’s not a market gently meandering along; that’s a prizefighter swinging haymakers. When a stock covers that much real estate in a year, it’s telling you something loud and clear: the crowd hasn’t made up its mind — but it sure isn’t bored.
And here’s the kicker: that $310.39 spread is 68% of the current price. That’s volatility with a capital V. The 52-week high and low aren’t just trivia — they are psychological and structural tripwires. The high tells you where greed maxed out. The low tells you where fear finally threw in the towel. Every tick between those two lines is raw emotional energy from traders who got trapped, squeezed, scared, overconfident, or all of the above. You want to know where big moves come from? Right there — from the emotional debris field between the extremes.
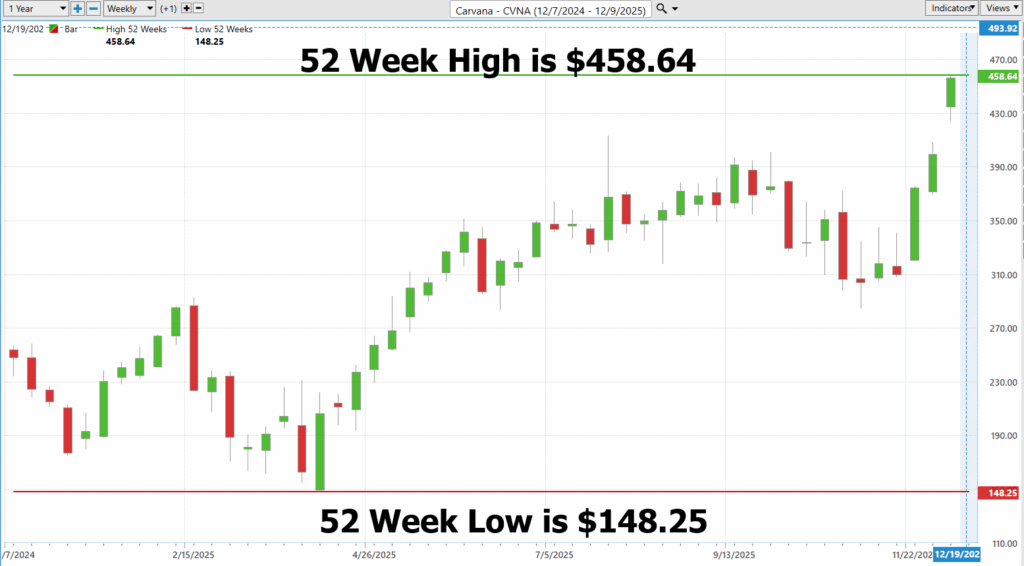
So, when a stock is trading at the 99th percentile of its 52-week range like this one? You’re standing on the rooftop edge of the entire year’s volatility footprint. Breakouts can rip faces off. Failures can drop like a manhole cover. Smart traders don’t just acknowledge those two price levels — they worship them. They’re the edges of the playing field, the guardrails of momentum, the boundaries that tell you whether you’re surfing a tidal wave or paddling into a buzzsaw. Ignore them, and the market will be happy to teach you why pros never do.

Carvana isn’t just a stock — it’s a full-blown Volatility Monster, the kind of beast that crawls out of the market’s basement, sprints to the rooftop, and then swan-dives back down for fun. This long-term chart looks less like price action and more like a seismograph measuring a decade of economic bad decisions. And now, with $CVNA charging back toward its highs, it’s reminding traders that chaos, apparently, is a renewable resource.
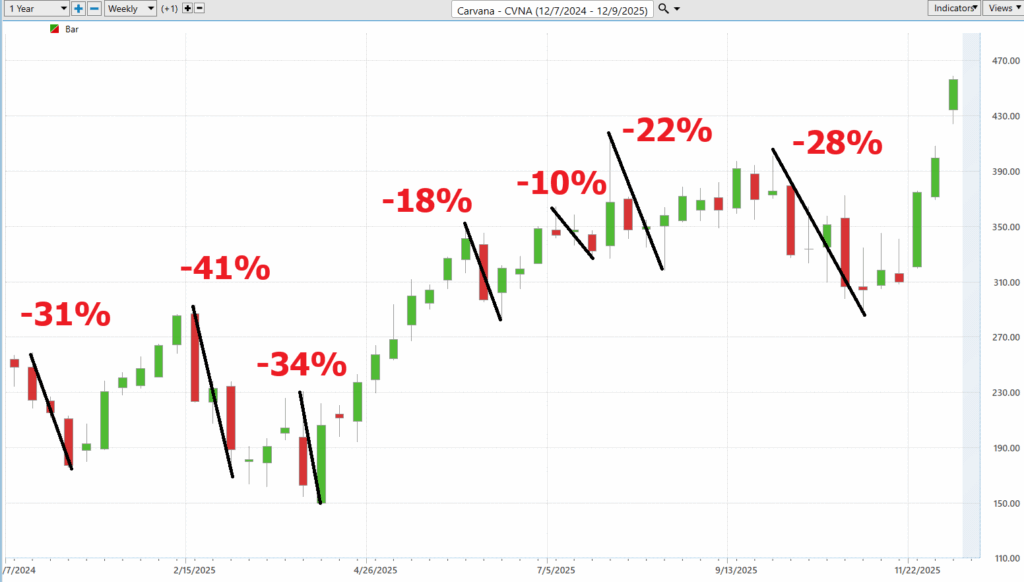
Best-Case/Worst-Case Scenario Analysis
If you want a crash course in financial whiplash, just stare at these next two CVNA charts for sixty seconds. On one side you’ve got gut-punch pullbacks of –31%, –41%, –34%, –18%, –10%, –22%, –28%—the kind of declines that make weak hands reconsider their life choices. Flip the script and you’re blasted with steroid-level upside runs of +63%, +40.8%, +133%, +45%, +18%, +12%, +20%, +60% aggressive, violent mood swings that only a stock with a personality disorder could deliver. And that’s the point: this isn’t unusual for $CVNA. This is CVNA. Chaos is not the exception — it’s the operating system.
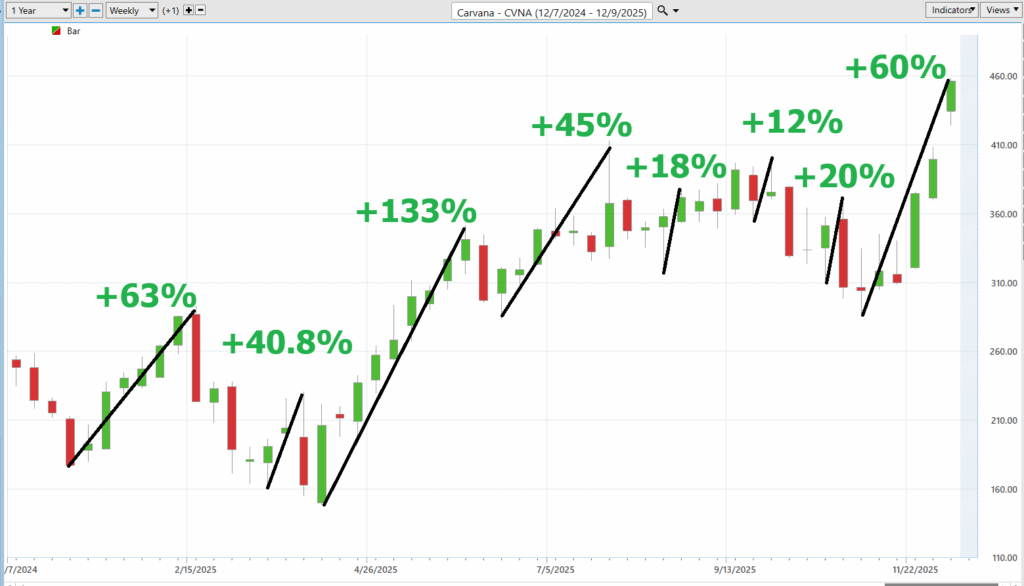
The best way to understand volatility isn’t by squinting at an indicator or memorizing some textbook definition. It’s by measuring the intensity of these actual rallies and declines, capturing the force, the speed, the amplitude of the swings. Volatility isn’t theoretical here; it’s tattooed all over the chart in numbers that would make most tickers blush. When a stock rips +133% and then casually dumps –41%, you’re not analyzing price action — you’re observing weather patterns on a different planet.
And this is where the real lesson hits: these swings define the risk/reward profile long before any news headline or analyst forecast does. They teach you exactly how much heat the asset generates and how much oxygen it needs before it combusts. And because volatility is the throttle of every trade, position sizing becomes the first and most important decision you make with a stock like CVNA. Size too big, and one of those routine –30% swan dives will take you out. Size correctly, and those +40%, +60%, +133% bursts become the kind of moves that justify the whole journey.
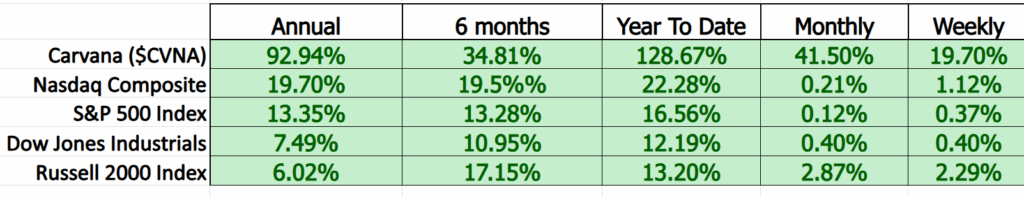
Look at that table and try not to whistle. $CVNA isn’t just outperforming the major indexes — it’s obliterating them. While the Nasdaq trots along at 19.7% annually and the S&P barely clears 13%, CVNA is blasting a 92.94% annual gain, a 128.67% YTD rocket, and a 41.5% monthly surge like it’s had three espressos and a bad idea. On every timeframe — annual, six-month, YTD, monthly, weekly — it’s lapping the broader market so hard the indexes should send thank-you notes for not being compared side-by-side more often.
But here’s the part nobody likes to admit: you don’t get numbers like these without swallowing volatility like broken glass. CVNA’s outperformance isn’t magic — it’s the direct byproduct of violent swings, 20% air pockets, 40% ramps, and mood swings that would frighten a shrink. Those monster gains are the reward for stepping into a stock that plays by prison-yard rules. You want that kind of upside? Fine. Just understand that the toll booth you pay on the way there is called volatility, and $CVNA charges full price, every time.
Vantagepoint A.I. Predictive Blue Line
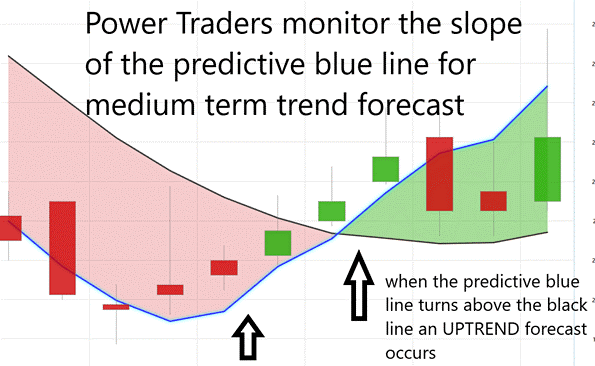
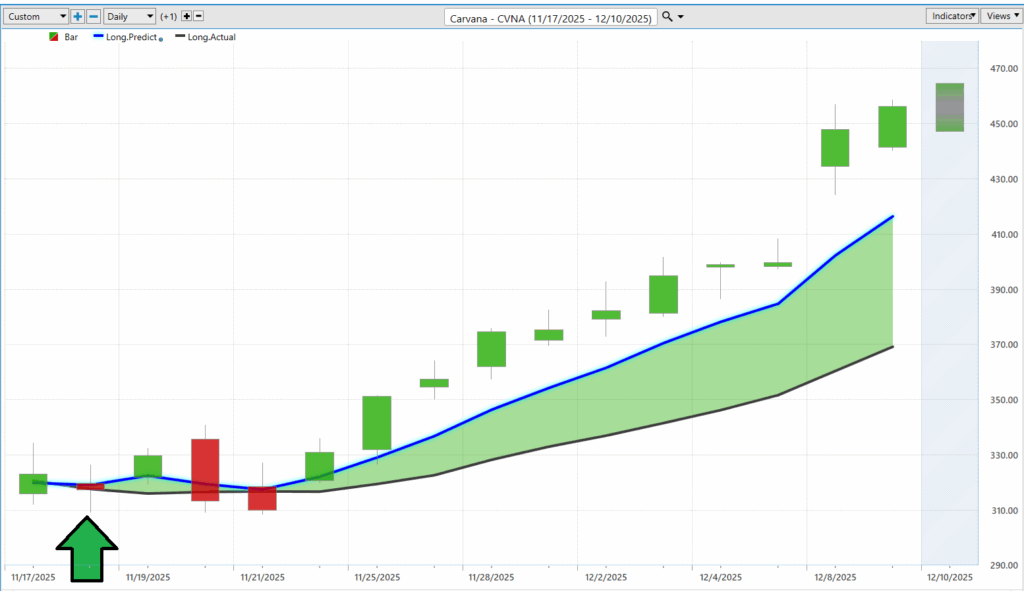
In the world of short-term trading, the rules for interpreting VantagePoint’s A.I. Predictive Blue Line are deceptively simple but quietly profound. The black line — a traditional 10-day moving average — plays the role we all know well: it tells you exactly what price has done. It is backward-looking by design, a report card on market behavior rather than a forecast. But the predictive blue line is something very different. It is not a conventional moving average at all; it is a forward-looking indicator built from neural networks, intermarket analysis, and pattern recognition — an algorithmic attempt to anticipate where price should go based on relationships the human eye often fails to see.
What traders quickly discover is that the slope of the predictive blue line often becomes the first tell — an early hint of trend direction before the broader market acknowledges it. When the blue line begins to rise or fall, it typically signals that the underlying forces driving price are shifting beneath the surface. And perhaps most important, the crossovers between the two lines serve as the system’s decisive moment. When the predictive blue line crosses above the black 10-day moving average, the model is forecasting an emerging uptrend; when it crosses below, it signals deterioration and potential downside. In essence, the black line tells you what has happened — but the blue line, powered by A.I., tells you what the market may be preparing to do next.
VantagePoint A.I. Neural Index (Machine Learning)
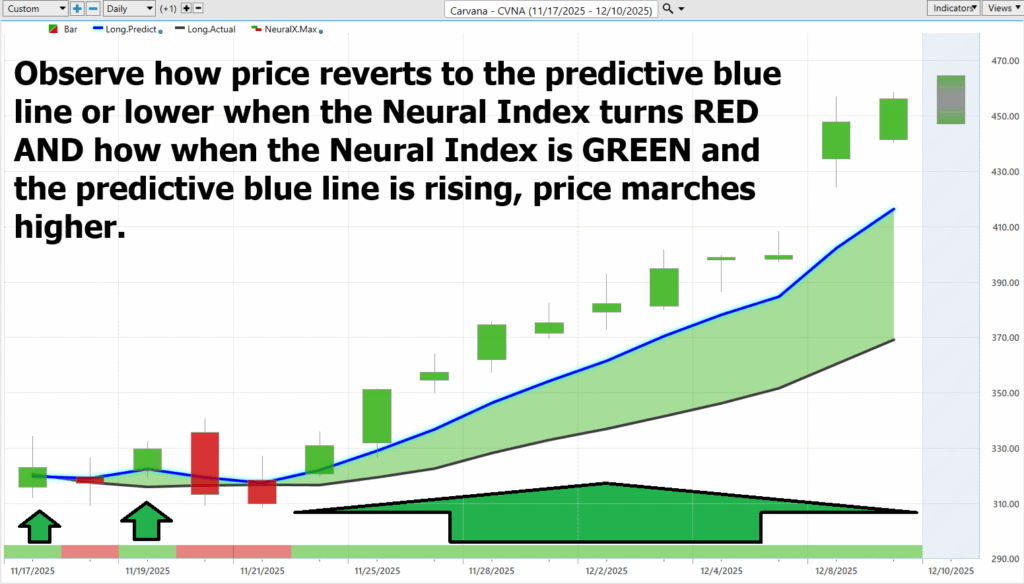
A neural network for trading is basically the market’s version of a lie detector test — except instead of catching bad alibis, it catches patterns hiding in plain sight. Humans see candles, highs, lows, maybe a moving average if they’re feeling fancy. But a neural network sees relationships: how today’s price interacts with yesterday’s volatility, how intermarket forces push or pull, how money flow and momentum whisper clues before the chart ever makes them obvious. In the attached graphic, that’s exactly what you’re watching. Every time the Neural Index flips red, price snaps back toward the predictive blue line like it’s returning to home base. And when the Neural Index turns green and that blue line starts rising? Price doesn’t wander, it marches. Straight. Up.
This is how traders upgrade from guessing to forecasting. The neural network isn’t trying to predict the next month or the next earnings call; it’s forecasting the next 48 hours of price strength or weakness — the kind of information that turns reactionary traders into proactive ones. Instead of chasing candles, you start anticipating reversions. Instead of hoping your entry was lucky, you lean on probability. And when the Neural Index is green, the predictive blue line is rising, and price is riding above that shaded zone like a surfer on clean water? You’re no longer fighting the market. You’re flowing with it, one data-driven step at a time.
VantagePoint A.I. Daily Range Forecast
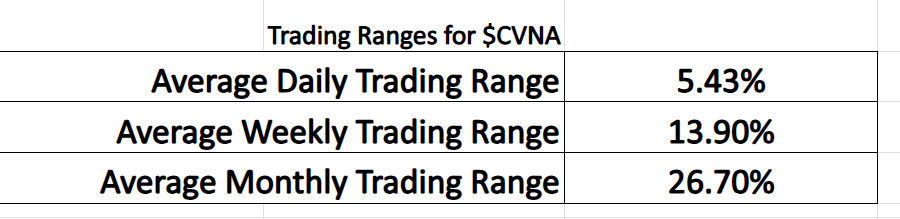
If you ever needed proof that $CVNA trades like it’s powered by caffeine, adrenaline, and a questionable directional compass, just look at those average ranges: 5.43% per day, 13.9% per week, and a moon-swinging 26.7% per month. These aren’t price movements; they’re personality disorders. And while knowing these metrics is essential — like knowing the blast radius before lighting a stick of dynamite — they still leave traders guessing where, exactly, to step in without losing their eyebrows. Volatility metrics tell you the climate, but they don’t tell you whether to pack sunscreen or a parachute. To turn wild ranges into actual opportunity, you need something sharper than averages. You need a scalpel, not a yardstick.
That’s where the following chart — the VantagePoint A.I. Daily Range Forecast — strolls in like the adult in the room, tapping the map and saying, “Here. Price is likely to go here today.” No broad strokes, no statistical fog — just precise upper and lower boundaries laid out before the market even rings the opening bell. Suddenly those monster daily swings are no longer chaotic; they’re navigable. The A.I. doesn’t just describe volatility; it choreographs it. And for traders trying to survive CVNA’s daily rodeo, that’s not just useful — it’s the difference between riding the bull and becoming part of the floor.

Intermarket Analysis
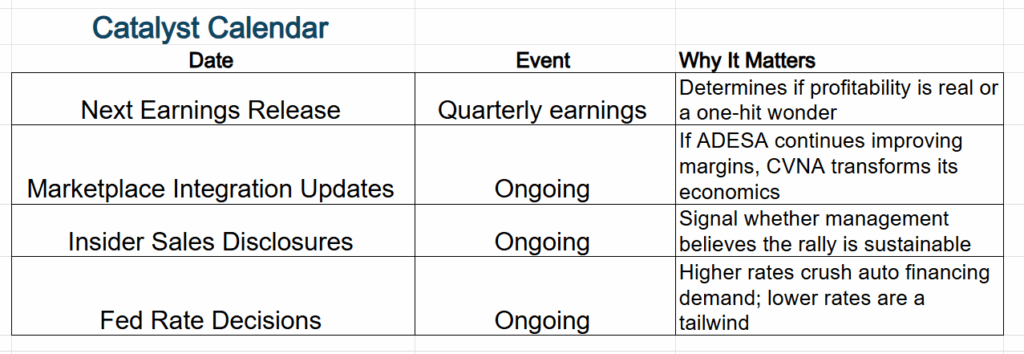
Imagine the stock market like a giant video game, and Carvana ($CVNA) is a car that was almost wrecked two years ago but is now zooming super fast; it’s gone up more than 100% just this year! The main reason it’s speeding up is because borrowing money to buy cars just got a lot cheaper. The Federal Reserve (the big boss of interest rates) is lowering rates, kind of like turning down the difficulty level in a game. When rates drop, people can afford bigger car payments, so more customers show up on Carvana’s website ready to click “buy.”
Another big helper is that used cars are still expensive to buy from auctions (the places Carvana gets its cars). That sounds bad, but it means Carvana can sell each car for a lot more money than it pays, so it makes bigger profits on every sale. Gas prices aren’t crazy high right now either, which makes people feel okay about buying a car instead of just riding the bus.
And now, as Carvana prepares to enter the S&P 500 on December 22md, fresh waves of index capital will flood its shares. But don’t be fooled into thinking this is the story’s conclusion — it’s merely the next chapter. The real test lies in the delicate feedback loop between equities, bonds, and commodities. Can lower rates sustain the consumer revival long enough to outpace inflation’s ghosts and recession’s shadows? Bulls see a runway to three million annual units by 2033. Skeptics point to leverage and rising auction costs. Both sides have a point. Because in the grand theater of intermarket dynamics, every rally — no matter how exhilarating — depends on forces larger than any one company. For now, Carvana’s joyride continues at full throttle. But the wisest investors grip the wheel firmly, knowing that in markets, as in driving, momentum is thrilling — but control is everything.
Bottom line: lower interest rates + still-high used-car prices + decent gas prices = happy Carvana customers and a stock price that keeps racing higher. As long as the Fed keeps making loans cheaper and people keep wanting cars, the Carvana car keeps winning the race. But if rates go back up or too many new cars suddenly flood the market, the game could get a lot harder!
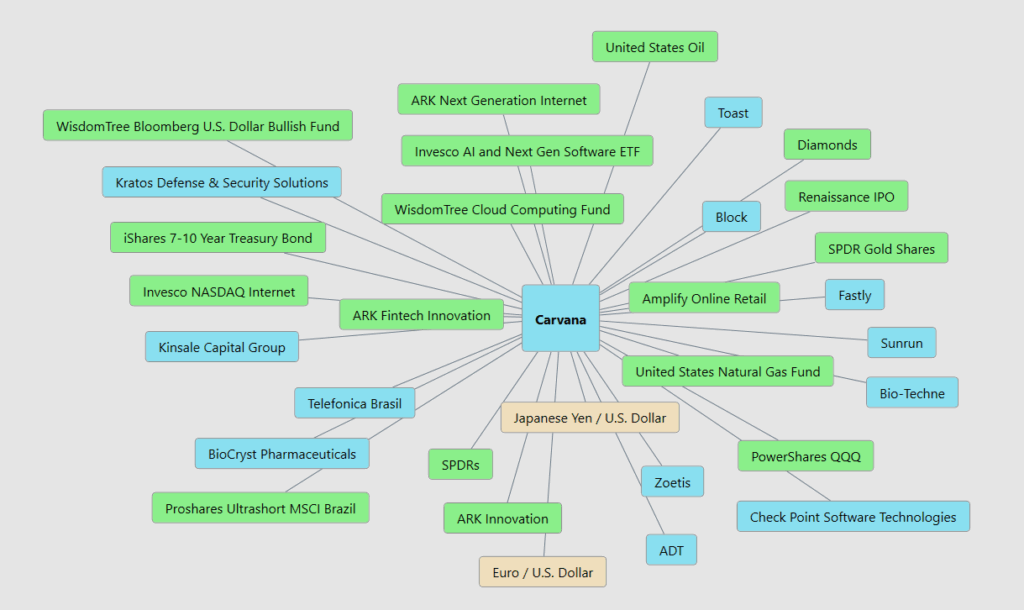
Here are the 31 key driver of $CVNA price action:
Our Suggestion
Carvana’s last two earnings calls tell a surprisingly simple story for such a wild stock: the company is finally doing what it always said it could do — sell more cars, make more money, and run the business without falling apart. Management is confident, but not in a loud or braggy way; they’re confident because the numbers now back them up. They’re selling far more cars than last year, bringing in record revenue, and actually keeping more profit instead of watching it disappear into costs and debt. They’ve cleaned up their balance sheet, cut expenses, and built a system that lets them grow fast without breaking everything in the process. That’s how the big turnaround happened: they simplified, they focused, and they kept improving every quarter until Wall Street finally had to pay attention. But for the rally to keep going, Carvana has to stay disciplined, keep growing faster than competitors, keep their profits solid even when the economy wobbles, and keep loan costs under control. From a 30,000-foot view, yes, this looks like a real comeback. But like any comeback story, it works only if the next chapters stay as strong as the last two.
Management isn’t shy about saying this business is brutal — moving cars, inspecting them, financing them, running the tech… it’s all hard. And they love that. Because the harder it is, the fewer competitors survive, and that pain becomes their moat. In their minds, they’re already the #2 used-car powerhouse gunning for #1, sitting in a messy, fragmented market where anyone who can deliver online convenience and a nationwide selection can walk in and steal the whole show.
The #1 used-car retailer in the United States is CarMax (KMX).
CarMax has held the top spot for years, with nationwide footprint, massive inventory, and the largest share of retail used-vehicle sales. Carvana is now solidly in the #2 position and chasing them hard.
CarMax sells well over 800,000 used vehicles per year, making it the largest used-car retailer in the United States by volume.
Carvana is now the #2 used-car retailer, and while it’s growing fast, it still trails CarMax in annual retail units sold.
Management’s story (profitable scale, widening moat, long runway) is showing up in the numbers, at least over the last 12–18 months.
$CVNA will create numerous trading opportunities in the months ahead.
Our suggestion is to place it on your trading radar.
Practice great money management on all your trades.
Use the VantagePoint A.I. Daily Range Forecast to locate short term trading opportunities.
Respect the volatility of this asset.
It’s not magic.
It’s machine learning.
Disclaimer: THERE IS A HIGH DEGREE OF RISK INVOLVED IN TRADING. IT IS NOT PRUDENT OR ADVISABLE TO MAKE TRADING DECISIONS THAT ARE BEYOND YOUR FINANCIAL MEANS OR INVOLVE TRADING CAPITAL THAT YOU ARE NOT WILLING AND CAPABLE OF LOSING.
VANTAGEPOINT’S MARKETING CAMPAIGNS, OF ANY KIND, DO NOT CONSTITUTE TRADING ADVICE OR AN ENDORSEMENT OR RECOMMENDATION BY VANTAGEPOINT AI OR ANY ASSOCIATED AFFILIATES OF ANY TRADING METHODS, PROGRAMS, SYSTEMS OR ROUTINES. VANTAGEPOINT’S PERSONNEL ARE NOT LICENSED BROKERS OR ADVISORS AND DO NOT OFFER TRADING ADVICE.


