


This week’s ai stock spotlight is iShares Silver Trust ($SLV)
Let’s talk silver — the metal everybody ignores until the world starts wobbling and inflation rises. Silver has always been the streetfighter version of gold: bruised, gritty, and massively misunderstood. While gold is sitting at $4,500 an ounce, silver is lounging at $57 which is exactly why people call it ‘Poor Man’s Gold.’ It’s the mock lobster inflation hedge… the one ‘regular people’ can still buy without taking out a second mortgage. And the thing about silver is this: it doesn’t need your permission to surge. When inflation chews through purchasing power, silver quietly tightens its gloves and steps back into the ring.
But here’s where the story gets spicy: Is silver at new all-time highs? Not yet in inflation-adjusted terms, but in nominal terms it most certainly is. Unlike gold, which mostly sits in vaults looking regal, silver gets used, and once it’s used, it rarely comes back. That creates a structural supply crunch. Industrial demand is exploding… and I don’t mean that figuratively. Silver is a critical component in semiconductors, EVs, solar panels, data centers, artificial intelligence hardware, 5G infrastructure, medical devices, and every modern gadget with a pulse. You want a world running on electrification and intelligence? Good luck doing it without silver. You might as well try building a rocket out of cardboard.
And that’s the punchline most people miss: silver isn’t just a shiny inflation hedge, it’s a mandatory industrial input for the future. It has one foot in the monetary world and the other buried deep in the guts of global manufacturing. When inflation rises, silver protects purchasing power. When industrial demand ramps, silver gets sucked off the market and disappears into circuitry, solar cells, and servers. That double-barrel demand — monetary + industrial — is why smart traders keep an eye on it. Because when the pressure builds, silver doesn’t move politely. It erupts.
Specifically, the iShares Silver Trust ($SLV) occupies a unique position in global markets. Unlike a mining stock, a futures contract, or a leveraged derivative, SLV is a straightforward, physically backed vehicle. Each share represents an undivided ownership interest in real silver bullion stored in secure vaults, primarily in London. In practice, SLV’s structure allows investors to track the spot price of silver with unusual precision, minus modest operating expenses. Its design is deliberately simple: take the complexity out of owning silver while preserving the economic exposure.
Scale is another defining feature. With more than $26 billion in assets under management, SLV is by far the largest silver-focused exchange-traded product in the world. The trust holds hundreds of millions of ounces of physical silver, giving it exceptional liquidity and making it a central part of how institutional investors, hedge funds, and risk managers access the metal. The size matters for another reason: it provides stability. Deep liquidity reduces transaction costs, minimizes slippage, and ensures that SLV can function reliably during periods of heightened market volatility, something that matters considerably when silver prices accelerate or retreat sharply.
But purpose is where SLV stands out. The trust was created to give investors a practical, regulated, and transparent way to gain exposure to silver without dealing with storage, insurance, logistics, or the operational risks of physical metal. In an environment where silver plays a dual role — as a hedge against inflation, monetary instability, and currency debasement, and as a critical industrial input for solar technology, semiconductors, electronics, and A.I. infrastructure — SLV has become an essential bridge between those worlds. It allows investors to participate in silver’s monetary and industrial story through a single, highly liquid instrument.
The result is a product that has quietly become one of the most important conduits for silver investment globally. Whether investors are seeking protection from inflation, positioning for accelerating industrial demand, or simply looking for a liquid proxy for the metal’s price, SLV’s structure and scale make it the default choice. It is not just another commodity ETF; it is a central pillar of the modern silver market.
Silver is one of those metals that behaves like the troublemaker in class — the one who’s smart enough to ace the test but still flicks paper airplanes when the teacher’s back is turned. The fundamentals are simple: there’s not a lot of silver in the world, but everybody wants some. People use it for coins, jewelry, video games, phones, computers, robots, and anything else that plugs in or lights up. That means the demand for silver is always pulling it in ten different directions at once, like a puppy trying to chase every squirrel in the park. When lots of people suddenly want more silver — boom — the price goes higher.
Now, here’s where things get fun. When the price of silver starts running higher, people tend to lose their minds a little. The metal becomes a celebrity overnight. Investors rush in like it’s a Black Friday sale. Companies start worrying whether they’ll have enough silver for all their gadgets. And suddenly everyone — from Wall Street traders to the guy who thinks YouTube comments are research — starts talking about silver like it’s the next big superhero movie. Prices can jump fast because there isn’t enough silver just lying around waiting to be scooped up. It’s like musical chairs: when the music stops, someone discovers there’s no chair left and starts yelling.
And silver’s been playing this drama game for thousands of years. Long before paper money, plastic debit cards, and online shopping carts, kings and countries used silver as real money. It was shiny, rare, easy to carry, and hard to fake — everything you want in something that people agree has value. Ancient empires minted silver coins. Pirates stole it. Cowboys got paid in it. Whole governments rose and fell based on how much of it they had. So, when you hear grown-ups talk about silver like it’s important… well, that’s because it is. It’s been part of the world’s “money system” since before anybody figured out how to make a decent sandwich.
When you look at silver through a market-structure lens, the tailwinds pushing prices higher are surprisingly robust. Start with industrial demand: the global shift toward electrification, semiconductor expansion, and exponential A.I.-driven computing all require meaningful amounts of silver. Solar production alone has become a structural force, consuming record volumes each year. Layer on monetary tailwinds — persistent inflation concerns, sovereign debt stress, and investors seeking alternatives to traditional safe havens — and you have a market where both industrial users and financial buyers are simultaneously reaching for the same finite supply. That dual-demand dynamic is one of the strongest pricing engines in the metals market today.
But silver also faces legitimate headwinds. The biggest is volatility — silver tends to move faster and more aggressively than gold, which can scare off institutional buyers who need predictable hedges. Another headwind is substitution risk; in industries like electronics, manufacturers constantly search for cheaper materials or ways to reduce the amount of silver used per device. Then there’s the supply side: when silver prices rise, mining companies often ramp up production, eventually increasing supply and taming the rally. And unlike gold, which is overwhelmingly held for monetary reasons, silver’s dependence on industrial cycles means economic slowdowns can quickly sap demand.
The real story is the tension between these forces. Silver’s long-term upward pressure is powered by macro trends that aren’t going away — electrification, renewable energy, A.I. hardware, and inflation hedging. But the metal’s short-term path is shaped by cyclical risks, cost-sensitive manufacturers, and a mining industry that tends to overreact to price spikes. The result is a market where silver can outperform dramatically during periods of economic expansion and monetary stress… yet pull back sharply when growth softens. Understanding those competing dynamics is what separates disciplined investors from tourists.
Whether you love silver or can’t stand the chatter around it, the fact is this: the metal is leading the charge, and every serious trader ought to be paying attention. Markets don’t care about your preferences, they care about momentum, demand, and price behavior. And right now, silver is showing the kind of strength that forces its way onto the screen. At $50 an ounce, it may sound expensive, but that’s the wrong way to look at a market breaking through 45-year highs. When something pushes through a ceiling that’s held for nearly half a century, it’s not a coincidence. It’s a signal.
And that signal is simple: watch this market. You don’t have to buy it, trade it, or preach about it. But ignoring it would be a mistake. In trading, the best education doesn’t come from predictions or opinions — it comes from observing what powerful price behavior looks like in real time. Silver is providing that lesson right now. Put it on your radar, study its moves, and respect the trend. Markets that rewrite history tend to keep teaching long after the headlines fade.
In this asset study, we’re not lighting candles at the altar of any ticker symbol or sprinting after whatever shiny object the market’s dangling today. No, we’re here to poke around under the hood and see what’s actually cranking the gears. Every chart spins a yarn, and every number has an ulterior motive — usually one it picked up in a dark alley. Our job is simple enough: decide whether this asset deserves your hard-earned money, your limited attention span, or a swift kick into the “not worth the trouble” bin. And the tools we’re using aren’t lucky rabbit feet or Wall Street voodoo. They’re built on years of data, human behavior quirks, and predictive intelligence doing all the grunt work while we sit here pretending to be clever.
- 52 Week High and Low Boundaries
- Best-Case / Worst-Case Scenario Analysis
- VantagePoint Triple Cross Indicator
- Neural Network Forecast (Machine Learning)
- VantagePoint A.I. Daily Range Forecast
- Intermarket Analysis
- Our Suggestion
Artificial intelligence may give us the forecast, but don’t kid yourself, that’s not the whole story. Before you bet real money on any signal, you step back and check the heartbeat of the asset itself. What’s the fundamental truth under the hood? What’s the risk vibe? What kind of world is this thing swimming in? For $SLV, that context isn’t optional, it’s everything. It tells you why the algorithm is leaning one way instead of the other… and whether the next move in this market is going to be a clean, hard conviction — or a chaotic, confusing mess you don’t want to be caught in.
52 Week High and Low Boundaries
You want to understand a market?
Forget the headlines. Forget the “experts.”
Just look at the journey a market has taken over the last 52 weeks.
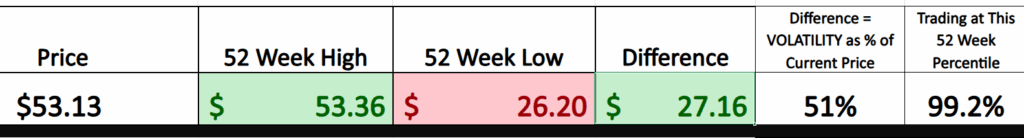
Your first grid, that tidy little table with numbers bold enough to wake the dead, tells the whole saga of SLV in plain English. One year ago, silver was a sleepy metal snoozing around $26.20, about as exciting as last year’s lawn mower. Fast-forward to today and it’s clawing at $53.36, practically rewriting its résumé in real time.
Most people see prices.
Traders see stories.
That $27.16 spread between the low and the high?
That isn’t just a number.
It’s the whole adventure — the storms, the sunshine, the panic, the euphoria, the handful of traders who bought low because they believed, and the boatload who swear they “would have” if their horoscope hadn’t been off that week.
Now divide that $27.16 range by today’s price of $53.13, and you get historical volatility north of 50%. That’s not just volatility — that’s opportunity to wear a name tag.
Silver didn’t drift.
It ripped.
It ran.
It dragged doubters behind it like tin cans on a wedding car bumper.

Now look at the second chart — the weekly bars.
If the 52-week table is the crime scene report, this is the slow-motion security footage.
You can practically see the moment silver stopped being polite and started getting real. Week after week, higher lows, higher highs — the classic staircase of a market waking up from a decade-long nap with one heck of an attitude.
It didn’t tiptoe higher.
It lunged, like it suddenly remembered it used to be money.
That green line at the top?
The fresh 52-week high?
SLV has been treating it like a personal challenge.
And with the 52-week percentile reading sitting at 99.2%, you’re staring at a market pressing right up against its ceiling, testing the studs.

This 10-year monthly chart of $SLV isn’t just a picture of price, it’s a decade-long story finally hitting its climax. For years, silver chopped sideways, teased breakouts, and lulled traders into believing it might never escape its own gravity. But then came 2024–2025, when the entire character of the market flipped. What you’re seeing now is a full-blown structural breakout: SLV has surged to brand-new all-time highs, with silver itself doing the same. That green line at $53.36 isn’t just a number — it’s history being rewritten. After a decade of consolidation, false starts, and quiet accumulation, silver has finally broken through the ceiling, signaling a major shift in momentum, psychology, and long-term trend. In markets, new all-time highs are never accidents — they’re the loudest message a chart can send, and right now, SLV is shouting.
When a market doubles off its lows…
When the range is 50% of its current price…
When the chart looks like an escalator pointed at the moon…
…you don’t need a weatherman to know which way the wind is blowing.
This is what traders dream about — not because it’s predictable, but because it’s alive.
The 52-week range gives you the context.
The volatility gives you the fuel.
The trend gives you the map.
This is the kind of setup where you don’t just watch the market, you listen to it.
Because markets don’t shout like this every year.
But when they do…you mark the date, sharpen your pencil, and lean in.
Silver’s not whispering anymore.
It’s making announcements.
Best-Case/Worst-Case Scenario Analysis
If you want to understand volatility — not the soft, padded academic version they teach in finance books, but the real-world, stomach-dropping, account-shaking version — you’ve got to stop pretending it’s complicated. Volatility isn’t a mystical force. It’s nothing more than the size of the hit you take when the market smacks you in the mouth, and the size of the victory lap you get when the wind finally hits your back.
That’s why this type of analysis is so critical.
The rallies aren’t gentle. They’re explosions. Nineteen percent here, thirty-three percent there, nearly fifty percent when it really gets a head of steam. Silver spent years sleepwalking, and then suddenly woke up swinging like it remembered it used to be money. These are the runs that pay for your losers, your mistakes, and your late-night self-loathing. And if you’re not in the game when these moves happen, you’re not trading. You’re sightseeing.

On the flipside, we always measure the worst-case declines for context. Those red numbers aren’t “pullbacks,” they’re body blows. A ten-percent drop here, a fourteen-percent skid there — SLV doesn’t nibble when it corrects; it takes chunks. And if your position is too big, the only thing getting corrected is you. Traders hate facing this truth because it forces them to admit that discipline — not optimism — is what keeps them alive.

Put the rallies and the drops side by side and the personality of SLV jumps out at you. When it moves, it moves hard. When it falls, it falls fast. The swings are big, violent, and absolutely tradable. This isn’t theory. This is wallet-tested volatility, the kind that demands respect and rewards preparation. And this is exactly why pros obsess over position sizing. If you know your worst drawdown is in the 10–15% range, you size your position so that kind of hit hurts but never cripples you. If the upside routinely runs 30–50%, you size it big enough that the wins matter. Everything else — entries, exits, fancy indicators — is secondary to knowing the size of the ride you’re strapping into.
The truth is simple: volatility isn’t something to fear. It’s clarity. It tells you what the market takes when it’s angry, what it gives when it’s hot, how fast opportunity arrives, and how big the waves really are. SLV isn’t shy about any of this. It doesn’t whisper. It doesn’t hint. It moves in big, obvious chunks. And once you train yourself to measure those chunks instead of reacting to every blip on the chart, you finally start seeing the market like a trader instead of a spectator.
Next, we compare $SLV to the broader stock market averages to compare performance and volatility across different time frames
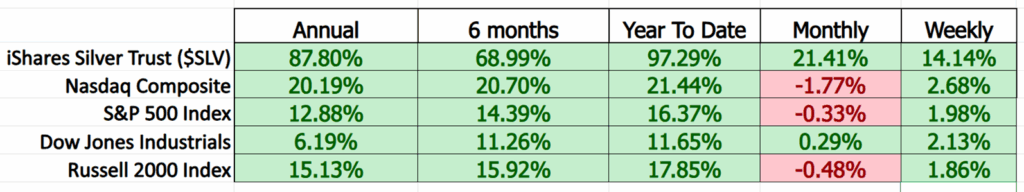
Look at this performance grid like its a race. You’ve got all the big kids running — the Nasdaq, the S&P 500, the Dow, and the Russell 2000 — and they’re all trying their best. Some run fast, some jog, some get tired halfway through. But then there’s **SLV**, the silver ETF, and it’s not just running… it’s zooming past everyone like it strapped rockets to its shoes. Over the last year, SLV has grown 87.8%, which is way more than any of the other “team captains,” and over the last six months it’s up 68.99%, leaving even the speedy Nasdaq in the dust.
But here’s the wild part — SLV didn’t just win the long races. It also crushed the short ones. In the “year-to-date” race, it’s up 97.29%, which is almost like doubling its score while the others only moved up a little. Even in the shorter “monthly” and “weekly” sprints, SLV is still jumping ahead while some of the other indexes are stumbling or slipping backwards. When you add it all up, the message is simple enough for anyone — even an 11-year-old trader-in-training — to see: SLV is the kid who trained all year, showed up ready to win, and never stopped pushing, no matter how long or short the race was.
Vantagepoint A.I. Triple Cross Indicator
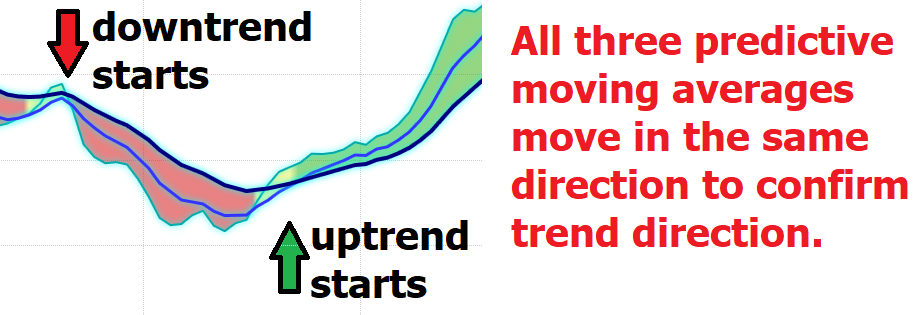
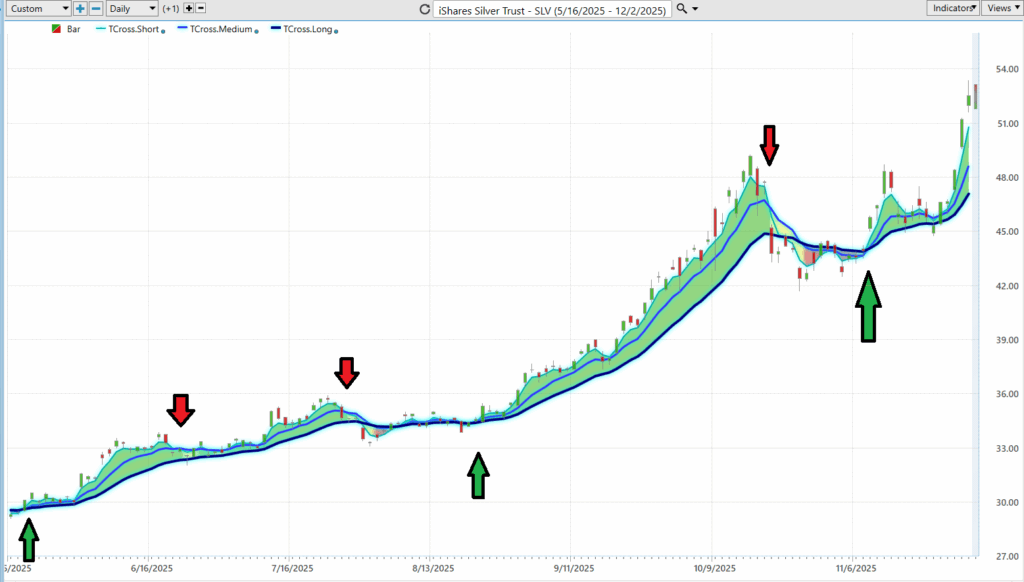
Let’s take a clear-eyed look at what’s happening here — without the hype, without the noise, and with the kind of precision today’s markets demand. In an environment where headlines move faster than fundamentals and traders are constantly sifting through uncertainty, identifying genuine trends has become a strategic advantage. That’s precisely where the Triple Cross Strategy from Vantagepoint’s A.I. earns its keep, particularly for an asset like $SLV, which is experiencing one of its most dynamic periods in years. This is not gut instinct masquerading as insight — it’s a disciplined, data-driven framework built on three predictive moving averages: the 3-day, 8-day, and 18-day. Together, they create a layered understanding of short-term acceleration, medium-term confirmation, and long-term direction — a synchronized system designed to anticipate meaningful moves before the rest of the market catches on.
What sets this approach apart is its restraint. It doesn’t leap into every price flutter or chase every market whisper. Instead, it waits for alignment — all three signals confirming the same directional intent — before acting. In a landscape filled with false starts and algorithmic head fakes, that kind of discipline is invaluable. It allows traders to sidestep the traps that catch less experienced participants and position themselves ahead of the more sustainable moves. With a system like this, you’re not reacting to the market — you’re preparing for it, informed and deliberate

The Triple Cross isn’t another flashy technical toy vying for attention. It behaves more like a risk manager with a strong point of view. In a market increasingly shaped by noise, sentiment swings, and rapid-fire speculation, the strategy provides an essential filter. It demands corroboration across short, intermediate, and longer-term signals before issuing its verdict — a structure that naturally weeds out impulsive trades and elevates the signals with true statistical weight. That discipline is what separates consistent performers from those merely hoping for a favorable outcome.
At its core, this is a strategy about precision, patience, and informed conviction. The Triple Cross waits for alignment before committing, offering traders clarity in a market defined by uncertainty. No gambling. No guesswork. Just reliable confirmation rooted in predictive analytics. In practice, it becomes more than just a tool — it becomes a trusted partner, helping traders navigate a market that rarely offers second chances.
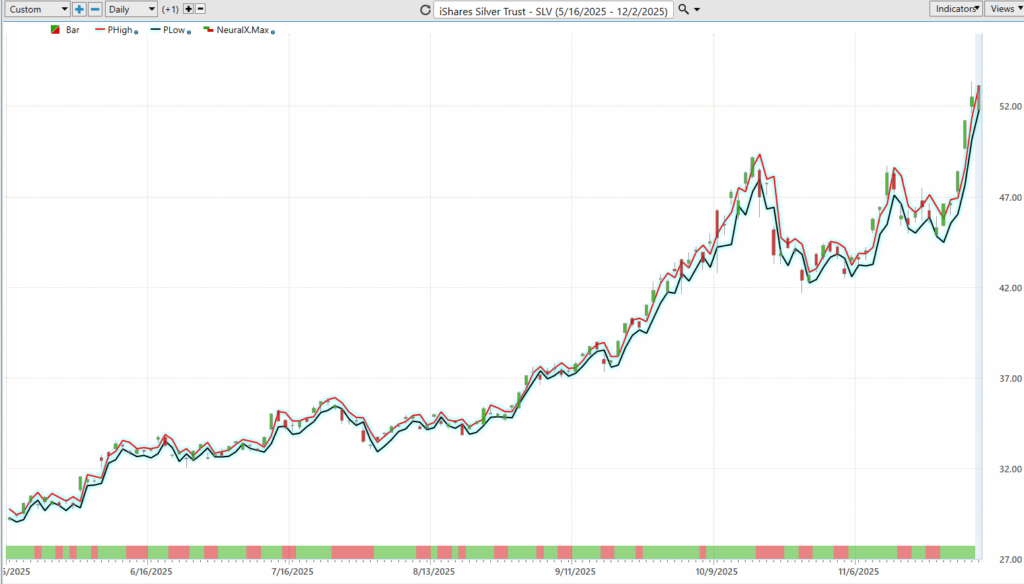
VantagePoint A.I. Neural Index (Machine Learning)
Think of a neural network as the closest thing Wall Street has to a bartender who’s seen too much — observant, suspicious, and impossible to fool. It doesn’t just watch the market; it studies every tic, twitch, and tremor like a detective on a caffeine drip. A neural network is basically a digital brain patterned after the human one, only without the inconvenient human tendencies toward panic, ego, and checking social media during trading hours. Instead, it chews through mountains of price data, volume spikes, chart patterns, global noise — all the stuff most traders swear they pay attention to but don’t — and starts noticing patterns the rest of us wouldn’t recognize if they leapt out of the screen and bit us.
These networks improve decision-making the same way night-vision goggles improve a midnight stroll through the woods: you suddenly stop bumping into trees. They take the chaos of the market, filter out the hysteria, and highlight the signals that matter. That means fewer heroic guesses and fewer moments where you pretend your “plan” wasn’t just blind optimism in a nice suit. They learn — really learn — refining themselves like a student who keeps taking the same test until they can practically recite the answers. Over time, they get frighteningly good at anticipating what’s coming next, not because they’re psychic, but because they don’t ignore the data the way humans reliably do.
And if you want proof, just look at your chart. Those smooth blue bands and shifting neural signals aren’t mood swings — they’re the network’s judgment, quietly steering traders through the noise. When price stays above those predictive lines, the network’s essentially whispering, “Relax, kid. The trend’s your friend.” When it dips below, it’s politely suggesting that barreling ahead might be the financial equivalent of touching a hot stove. The Neural Index is the traffic light of the whole operation — green for go, red for “don’t be an idiot.” Paired with the Triple Cross, you’ve got something rare in trading: tools that don’t react to the market’s drama but read its intentions. It’s not about trading faster. It’s about trading smarter — and letting the machines handle the heavy thinking while you try not to get in their way.
VantagePoint A.I. Daily Range Forecast
In a market defined by noise, speed, and relentless uncertainty, precision has become the rarest and most valuable commodity. That’s precisely where the VantagePoint A.I. Daily Range Forecast distinguishes itself. This isn’t a speculative gadget or a clever trading parlor trick. It’s a systematic, data-driven framework designed to identify the most probable boundaries of the day’s price action — effectively mapping the terrain before traders step onto the field. In a market like $SLV, where volatility is not an occasional guest but a daily presence, having insight into where price is likely to travel becomes more than helpful; it becomes strategic.
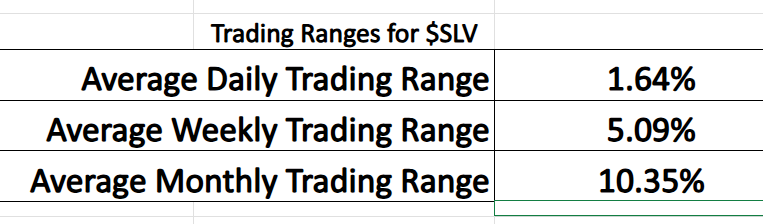
This is where timing becomes critical. Most traders lose not because they misread the trend, but because they misread the *moment*. A forecast like this helps close that gap. It offers context — refined, data-rich context — that allows traders to know when they’re taking a calculated risk and when they’re simply stepping into volatility unprepared. In a world where one ill-timed entry can erase weeks of disciplined gains, that distinction matters.
The A.I. Daily Range Forecast, then, isn’t about trading faster or more aggressively. It’s about trading smarter. It’s about creating a level of situational awareness that transforms uncertainty into opportunity. For anyone navigating the sharp movements of SLV, it becomes less of an accessory and more of a professional necessity — the kind of tool that quietly shifts outcomes, sharpens decision-making, and helps traders stay a step ahead while the broader market stays reactive.
In markets like these, advantage rarely comes from bravado. It comes from preparation, insight, and timing. And that’s exactly what VantagePoint’s A.I. delivers
Intermarket Analysis
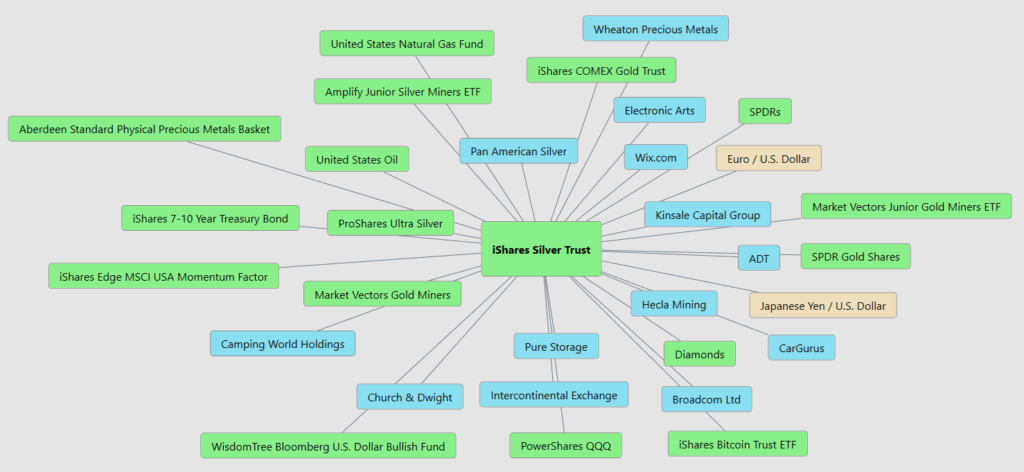
If you really want to understand silver, you can’t stare at it in isolation like it’s some moody teenager refusing to talk. Silver is a social creature. It’s plugged into half the global economy, and that web of connections is exactly what your chart is screaming. Start with the big one: the U.S. Dollar. Silver trades in dollars, so every time the dollar flexes its muscles, silver feels it in the ribs. When the dollar slumps — whether from loose monetary policy, political drama, or just one of those “oops” moments in Washington — silver usually gets a second wind. It’s suddenly cheaper for the rest of the world, and global buyers pile in. But when the dollar strengthens, silver walks straight into a headwind. It gets pricier overseas, and demand cools. This back-and-forth explains why silver’s chart looks like a dance routine with the USD always leading.
Then there’s the bond market — the quiet kid in the corner who runs the whole school. Your map shows Treasuries, interest-rate ETFs, even the U.S. Dollar Bullish Fund, all orbiting around SLV. And for good reason. When rates drop and yields fall, silver becomes the smart money’s refuge: a non-yielding asset suddenly looks very appealing when everything else is yielding even less. But jack up interest rates and guess what? Investors go chasing yield like it’s the last donut in the box, and silver gets pushed aside. It’s not personal — it’s just math and human nature.
Now, look at how many equity tickers are connected to SLV in your chart — miners, industrials, even quirky outliers like Camping World and Pure Storage. That’s silver’s split personality on full display. Half precious metal, half industrial workhorse. When the economy is humming, stocks are rising, and factories are busy, silver rides the wave because everyone needs more of the stuff for solar panels, electronics, batteries — you name it. But when markets panic, silver can play the safe-haven role… though let’s be honest, gold usually gets the first invite to that party. Silver still tags along, but with a little more volatility and a few extra mood swings.
And finally, zoom out on the commodity crowd around SLV: gold, junior miners, energy funds, even natural gas and copper-adjacent players. This is silver’s tribe — the assets that move when real stuff moves. Silver shadows gold when the world starts worrying about money. It runs with industrial metals when manufacturing booms. It even reacts to energy markets because mining isn’t exactly solar-powered. When supply shakes, when demand surges, when geopolitical storms hit — this whole cluster lights up together. Silver doesn’t live in a vacuum. It sits at the crossroads of currency, bonds, stocks, and commodities — and that’s exactly why it can move faster, harder, and more dramatically than almost anything else on your watchlist.
In short, your chart isn’t just showing relationships — it’s showing the ecosystem that makes silver tick. And once you see it, you can’t unsee it.
Our Suggestion
Whether you love silver or can’t stand the chatter around it, the fact is this: the metal is leading the charge, and every serious trader ought to be paying attention. Markets don’t care about your preferences, they care about momentum, demand, and price behavior. And right now, silver is showing the kind of strength that forces its way onto the screen. At $53 an ounce, it may sound expensive, but that’s the wrong way to look at a market breaking through 45-year highs. When something pushes through a ceiling that’s held for nearly half a century, it’s not a coincidence. It’s a signal.
And that signal is simple: watch this market. You don’t have to buy it, trade it, or preach about it. But ignoring it would be a mistake. In trading, the best education doesn’t come from predictions or opinions — it comes from observing what powerful price behavior looks like in real time. Silver is providing that lesson right now. Put it on your radar, study its moves, and respect the trend. Markets that rewrite history tend to keep teaching long after the headlines fade.
When you look at silver through a market-structure lens, the tailwinds pushing prices higher are surprisingly robust. Start with industrial demand: the global shift toward electrification, semiconductor expansion, and exponential A.I.-driven computing all require meaningful amounts of silver. Solar production alone has become a structural force, consuming record volumes each year. Layer on monetary tailwinds — persistent
inflation concerns, sovereign debt stress, and investors seeking alternatives to traditional safe havens — and you have a market where both industrial users and financial buyers are simultaneously reaching for the same finite supply. That dual-demand dynamic is one of the strongest pricing engines in the metals market today.
But silver also faces legitimate headwinds. The biggest is volatility — silver tends to move faster and more aggressively than gold, which can scare off institutional buyers who need predictable hedges. Another headwind is substitution risk; in industries like electronics, manufacturers constantly search for cheaper materials or ways to reduce the amount of silver used per device. Then there’s the supply side: when silver prices rise, mining companies often ramp up production, eventually increasing supply and taming the rally. And unlike gold, which is overwhelmingly held for monetary reasons, silver’s dependence on industrial cycles means economic slowdowns can quickly sap demand.
The real story is the tension between these forces. Silver’s long-term upward pressure is powered by macro trends that aren’t going away — electrification, renewable energy, AI hardware, and inflation hedging. But the metal’s short-term path is shaped by cyclical risks, cost-sensitive manufacturers, and a mining industry that tends to overreact to price spikes. The result is a market where silver can outperform dramatically during periods of economic expansion and monetary stress… yet pull back sharply when growth softens. Understanding those competing dynamics is what separates disciplined investors from tourists.
Now here’s where the circus lights flip on. When silver starts running higher, people don’t just pay attention; they flat-out lose their marbles. The metal turns into an overnight rock star. Investors pile in like it’s a blowout Black Friday doorbuster and the last flat-screen on Earth is up for grabs. Prices don’t creep up, they launch, because there isn’t a neat little warehouse full of spare silver waiting to bail anyone out. It’s musical chairs with real money — and when the music stops, someone always finds themselves standing and screaming.
And this drama isn’t new. Silver’s been pulling this stunt for thousands of years. Before paper money, before plastic cards, before online checkouts and digital wallets, silver was the money. Kings hoarded it. Empires minted it. Pirates stole it. Cowboys stuffed it in their saddlebags. Entire governments rose or collapsed depending on how much of the stuff they had locked away. Silver was shiny, rare, portable, and tough to fake — exactly what you want when humans all agree something has value. So, when the grown-ups talk about silver like it’s a big deal… it’s because it always has been. Silver has been part of the world’s money system since long before anyone figured out how to build a decent sandwich.
We expect $SLV to provide numerous trading opportunities in the weeks and months ahead.
Practice great money management on all of your trades.
Use the VantagePoint A.I. Daily Range Forecast to highlight short-term trading opportunities.
It’s not magic.
It’s machine learning
Disclaimer: THERE IS A HIGH DEGREE OF RISK INVOLVED IN TRADING. IT IS NOT PRUDENT OR ADVISABLE TO MAKE TRADING DECISIONS THAT ARE BEYOND YOUR FINANCIAL MEANS OR INVOLVE TRADING CAPITAL THAT YOU ARE NOT WILLING AND CAPABLE OF LOSING.
VANTAGEPOINT’S MARKETING CAMPAIGNS, OF ANY KIND, DO NOT CONSTITUTE TRADING ADVICE OR AN ENDORSEMENT OR RECOMMENDATION BY VANTAGEPOINT AI OR ANY ASSOCIATED AFFILIATES OF ANY TRADING METHODS, PROGRAMS, SYSTEMS OR ROUTINES. VANTAGEPOINT’S PERSONNEL ARE NOT LICENSED BROKERS OR ADVISORS AND DO NOT OFFER TRADING ADVICE.


