


Basic Forex Trading Strategies
If you’ve been reading the news lately you’ve seen a ton of headlines that could easily scare you to death.
But you know what’s interesting…?
It’s always been that way!
If you study the financial markets for any period of time, there have always been massive guru-fueled scare tactics and news stories in the media that have terrified investors and traders.
Today is no different.
What it all comes downs to is this:
What is your Northern Star?

What is your guidance system to determine when it is safe to invest and when to move to the sidelines?
If you turn on your television and watch your favorite financial news show you will quickly see the talking heads debating what the news means in light of all the economic indicators. In the process they create enough content to fill up the 24-hour news cycle.
It’s horribly complicated.

Interest rates, Unemployment, Trade Balances, Budget Deficits, Political Tensions, Retail Sales, Crude Oil Prices, Technological Innovations. It’s very easy to get lost and confused trying to connect all the dots and feel good about trade selection.
Thanks to the artificial intelligence it’s also unnecessary.
One of the largest markets in the world is foreign exchange. Traders who understand Forex know its motion affects the pricing mechanisms in all other markets.
A lot of traders get very excited when they discover foreign currency trading. Forex offers high leverage and huge liquidity. In this article, you’ll find a handful of powerful common-sense ideas that forex traders can put to good use immediately and then amplify these insights with the power of artificial intelligence.
How Currency Trades Work
All foreign exchange is quoted in pairs. To understand this, you need to understand the symbols for each currency. Below are the top 8 currencies which receive the majority of foreign exchange volume:
USD = US Dollar
EUR = Euro
GBP = British Pound
JY = Japanese Yen
CHF = Swiss Franc
NZD = New Zealand Dollar
AUD = Australian Dollar
CAD = Canadian Dollar
Since all currencies are quoted in pairs, you’ll see EUR/USD, USD/JPY, AUD/USD on a trade platform.
The first listed currency in a currency pair is referred to as the base currency.
The base currency is the basis for the buy or sell transaction.
The second currency is referred to as the counter currency or quote currency.
If you see a quote that reads: EUR/USD 1.2094 – 1.2096 this means is that when the EURO is valued in terms of US Dollars every Euro is worth the median price between those two values.
Traders who are looking to BUY the EUR/USD pair will pay a price of $1.2096. Traders who are looking the SELL the EUR/USD will have borrowed the market interest-free at a rate of $1.2094.
The difference between $1.2094 and $1.2096 is known as the spread between the bid and the offer.
The main problem of trading is the organization of information so that effective trading decisions can be made.
Trading is all about making effective decisions.
When a currency is quoted, it’s always done in relation to another currency. Remember that price is simply a ratio of exchange. So, the value of the first currency is reflected through the value of the other. The base currency (in this case, the EURO) is always equal to one unit (in this case, one EURO), and the quoted currency (in this case, the US Dollar) is what that one base unit is equivalent to in the other currency. The quote means that 1 EURO = 1.2094 to a seller and 1.2096 to a buyer. In other words, 1 Euro can buy 1.2094 US Dollars.
At its most basic level we are dealing with arithmetic fractions which involve a numerator and a denominator. While this may seem obvious, It’s important because whenever a price changes, we need to try to understand, for our trading purposes whether the change occurred because of the numerator, the denominator or both.
Let’s say you’re trading the U.S. Dollar. To get an idea of the strength or weakness of the U.S. Dollar overall you would need to compare the U.S. Dollar against all of its major trading partner currency pairs to be able to determine its relative strength or weakness.
Euro versus U.S. Dollar (EUR/USD)
U.S. Dollar versus Japanese Yen (USD/JPY)
U.S. Dollar versus Canadian Dollar (USD/CAD)
British Pound versus U.S. Dollar (GBP/USD)
Australian Dollar versus U.S. Dollar (AUD/USD)
New Zealand Dollar versus U.S. Dollar (NZD/USD)
U.S. Dollar versus Swiss Franc (USD/CHF)
This is pretty straightforward, but it can be rather confusing because sometimes the U.S. Dollar is quoted as the base currency and other times it is quoted as the counter currency. To find a trend manually we would need to look at each currency pair on a daily, weekly and monthly basis and ideally look for a strength and/or weakness across all time frames relative to other currency pairs.
The problem many new forex traders face is they look at the strength or weakness of one currency pair and assume that is the strength or weakness of the underlying currency.
A powerful shortcut in this regard is to reference an INDEX of the underlying currency whenever possible. Here is a chart of the U.S. Dollar Index.
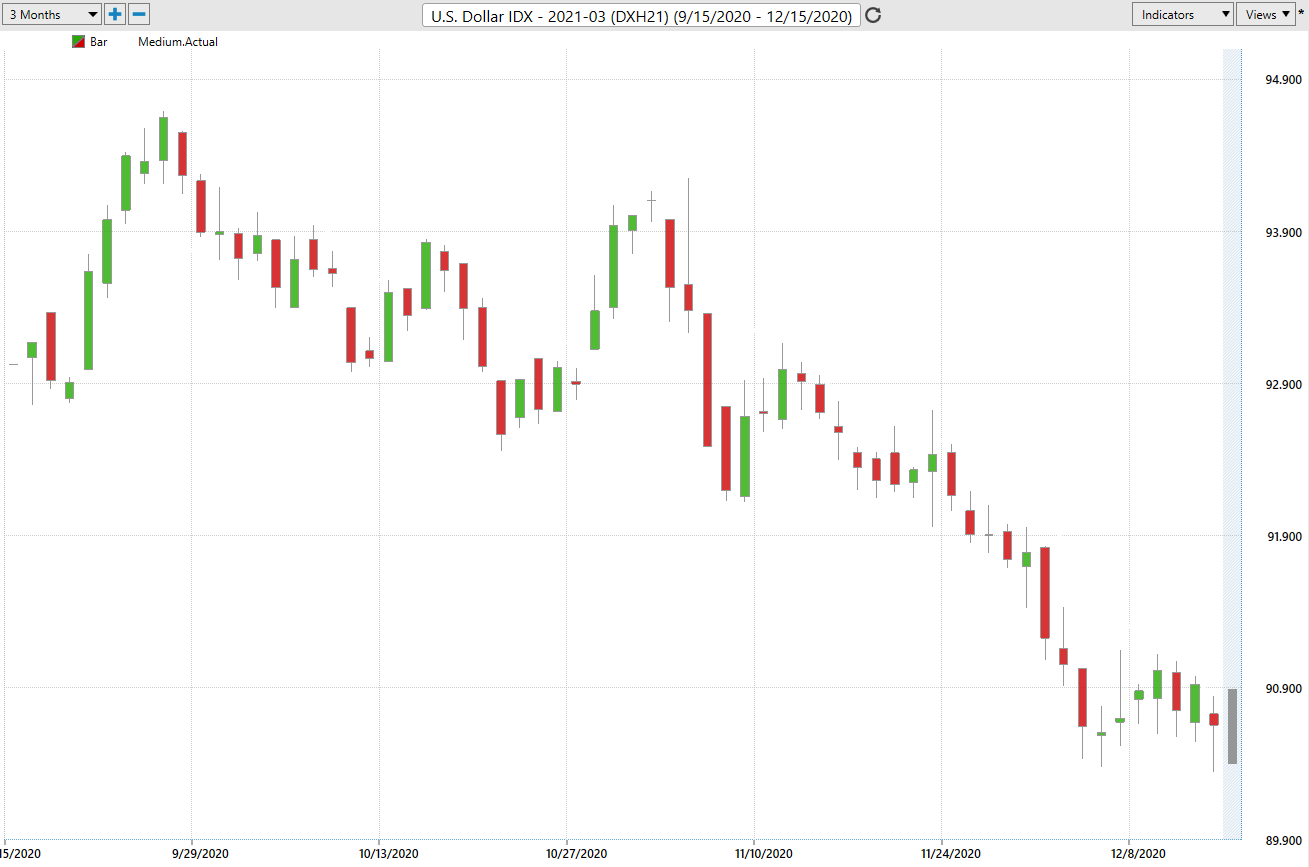
By looking at the underlying U.S. Dollar Index we can quickly ascertain the relative weakness of the Dollar without having to look at 7 different currency pairs.
Let’s say we’re interested in trading the Euro versus the U.S. Dollar. A few things that are important to do is to try and define “normal.”
- What is the normal trading range?
- What is the 10 day high price?
- What is the 10 day low price?
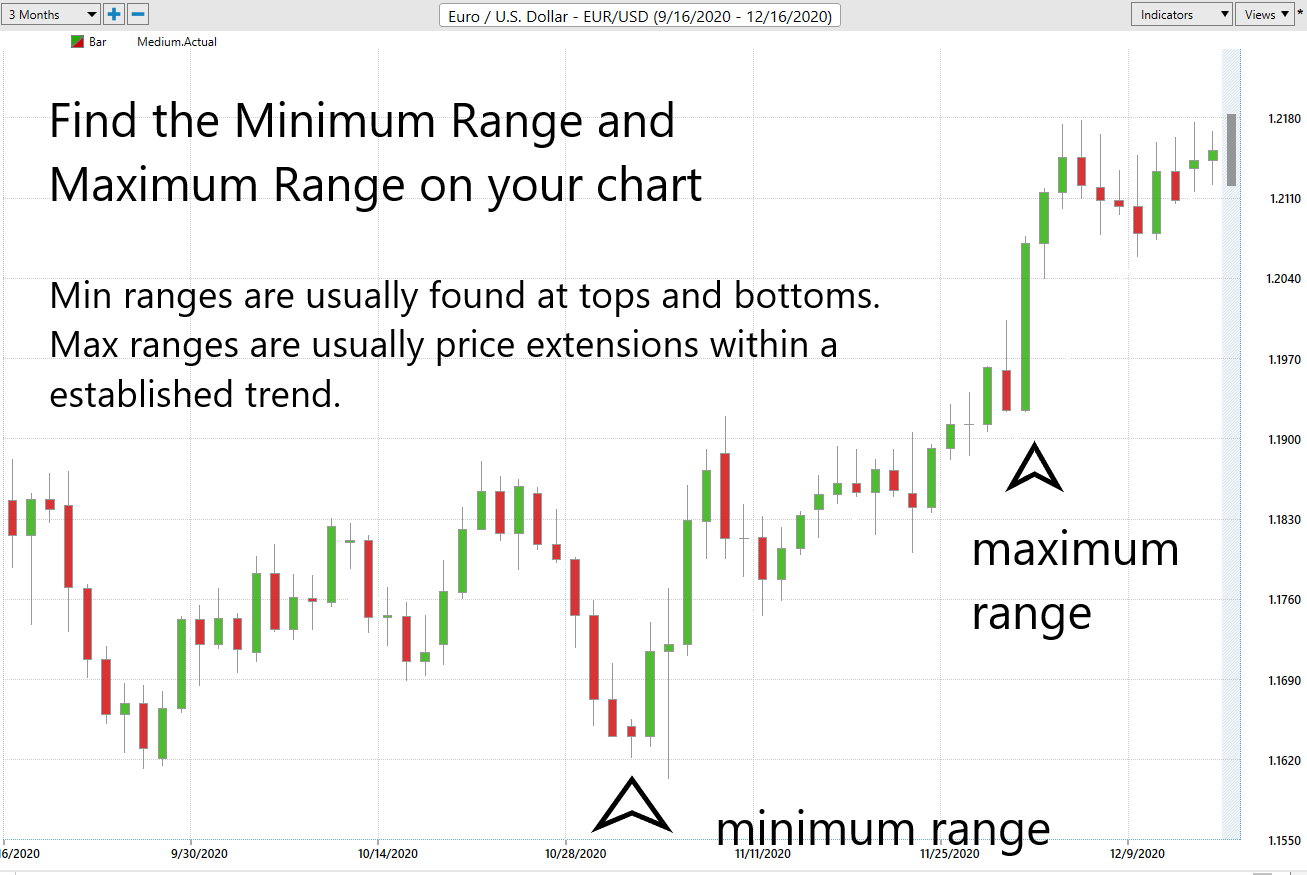
Over the last three months the high on the EUR/USD has been 1.2177. The corresponding low has been 1.1603. The chart below shows us the last 66 trading sessions for this currency pair. The average daily trading range over this time period was 88 basis points or pips per day.
While these values are very general, they now allow us to locate two numbers that are the “outliers” from the normal range. They are the minimum range and the maximum range. Usually, you will find the minimum range will occur on a chart near the relative tops or bottoms. On the other hand, the maximum range is often a price extension in a well-established trend.
These values once located offer important areas of support and resistance on a chart.
Finally, what most traders are interested in finding is a value point within a trend they can position themselves for potential gain. Let’s say you’re a trader who holds positions for a maximum of 5 days. One metric which can be very helpful is finding the VALUE POINT. Sometimes this is referred to as a Median Point, Pivot Point or Swing Center. It’s a common-sense metric that is calculated as follows:
(5 day high + 5 day low + most recent close) divided by 3
The purpose of this value is to find a point on the chart that determines a “good value.” Buyers would want to buy at or below this number. Sellers would want to sell at or above this number.
I want to stress that this is a generic common-sense metric. Its value to traders is based upon the major assumption that if the most recent history repeats itself similarly, that this value will provide a VALUE POINT for positioning yourself accordingly in the trend. This metric is often used by short term swing traders across financial markets.
In summary what this simple analysis attempts to do is:
- Locate a trend by looking at all currency pairs for corresponding strength or weakness.
- Locate the “outliers” on the chart. These are the points that deviate from what would be considered normal.
- Locate a point on the chart where we can position ourselves within the trend for short term profit opportunities.
Technology has changed a lot in the last 50 years. Things like Artificial Intelligence, Machine Learning, and Neural Networks existed only in science fiction novels just a few decades ago.
It’s amazing how times have changed – technology and information are revolutionizing every detail of our day-to-day lives – driving, groceries, medicine, recreation, and sports. Machine Learning is freeing up our time to focus on what’s important while Artificial Intelligence takes care of time-consuming minutia of life.
Nowhere is the influence of tech more profoundly apparent than in the impact A.I. is having in creating huge successes in cutting-edge businesses and in trading the financial markets.
All traders and investors need a Northern Star!
Let me show you how artificial intelligence, neural networks and machine learning can streamline the analytical process while giving you a powerful edge, saving you hundreds of hours of time and provide you with guaranteed peace of mind.
The amazing thing about artificial intelligence is that it makes tens of thousands of calculations and comparisons to determine what the next best move forward is. More importantly, it learns from its errors so it is always finding ways to improve.
It’s this exact same logic and process that has allowed artificial intelligence to defeat the top players in Chess, Go!, Poker and Jeopardy. Why should trading be any different?
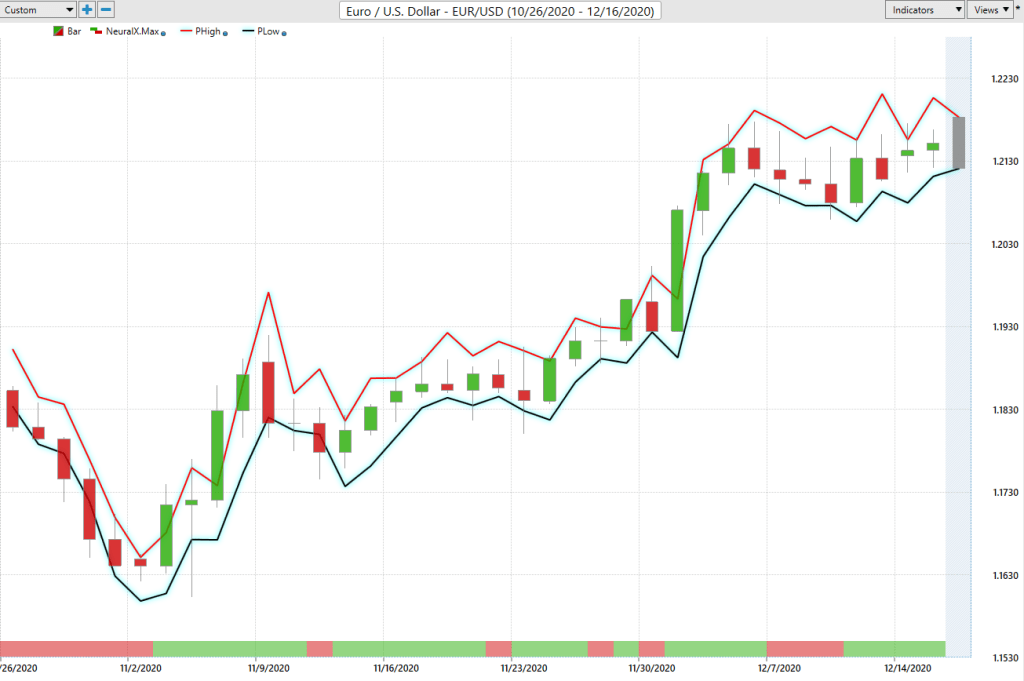
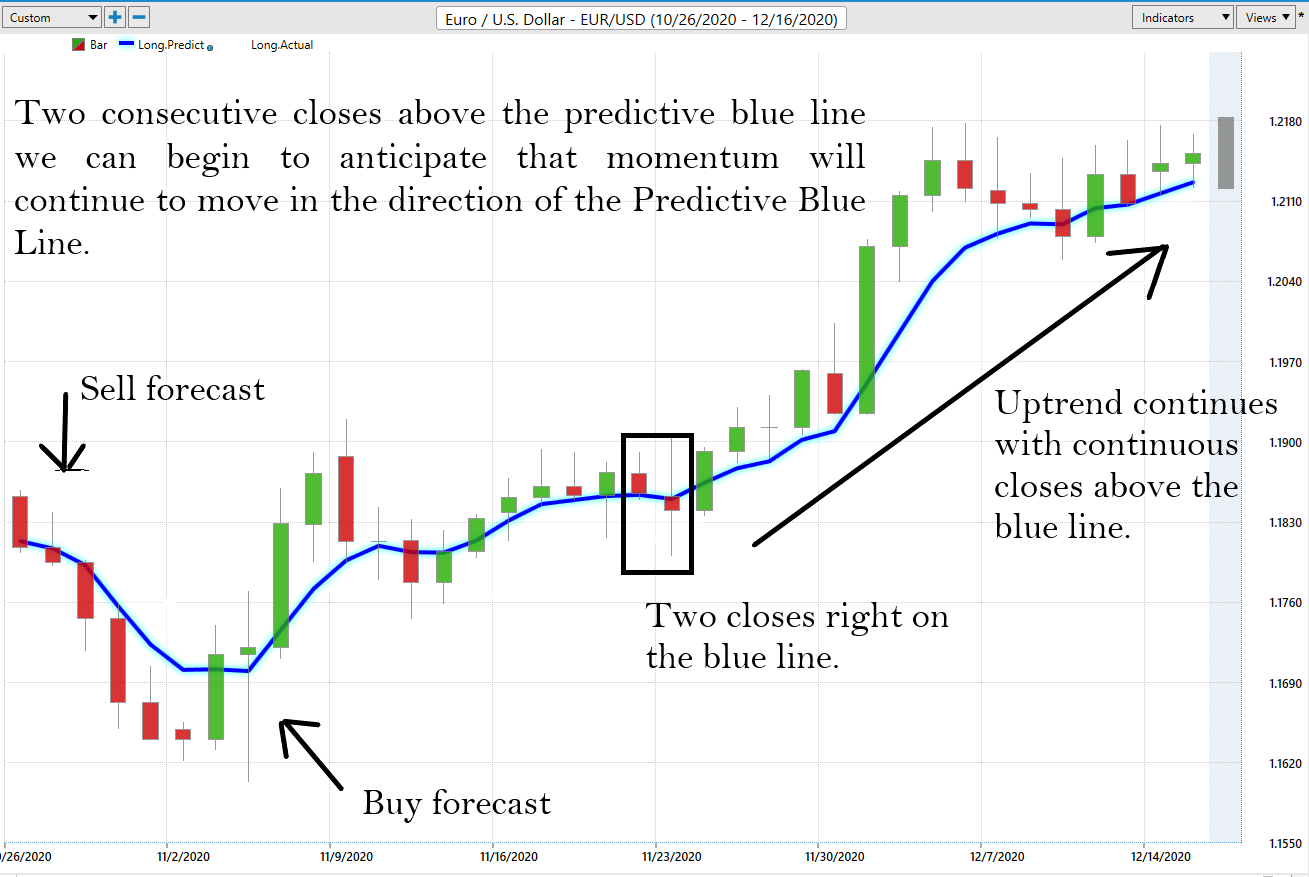
At Vantagepoint, artificial intelligence consists of several powerful components. The first is the PREDICTIVE BLUE LINE.
This indicator is the very first thing that Power Traders study when they analyze their charts. The riles are very simple:
When you have two consecutive closes above the predictive blue line we can begin to anticipate that momentum will continue to move in the direction of the Predictive Blue Line.
The Vantagepoint Software also includes a Neural Index at the very bottom of each chart to confirm if the accumulated knowledge of the Neural Network for this currency pair is expecting further strength (green) or weakness (red).
Study the chart below and you will conclude that predictive intelligence is very valuable in highlighting areas where greater strength and weakness is anticipated.
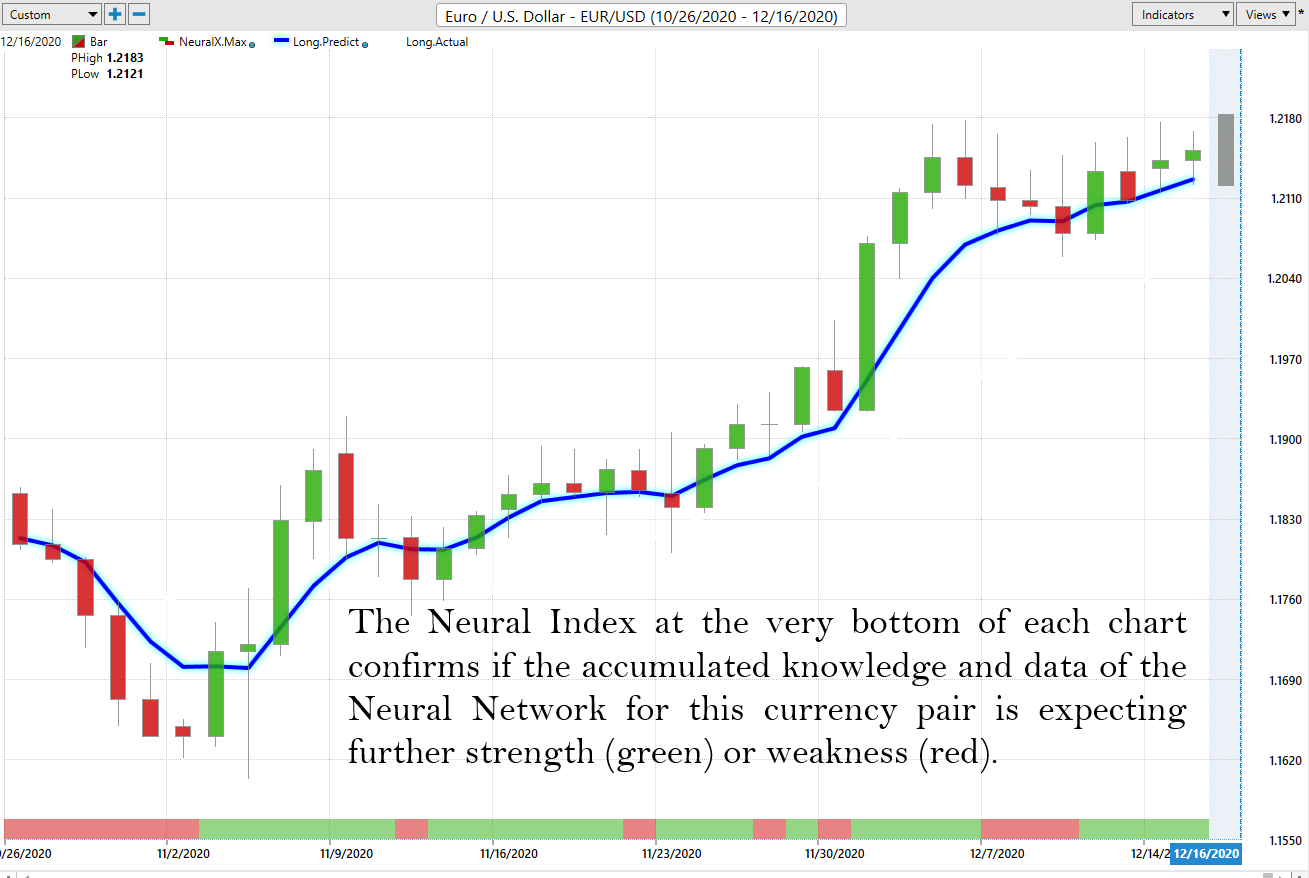
You can quickly see how this analytical power can transform your trading performance!
The artificial intelligence is capable of performing this powerful analysis because of two patented processes. The first is Intermarket Analysis.
It makes sense if you think about it.
Consider how the U.S> Dollar is valued around the world.
If you pull up a chart of the U.S. Dollar, you are looking at it in isolation.
You are not taking into account any of the competing currencies around the world which directly or indirectly affect the dollars price, nor,
- what is happening in any of those countries
- Foreign Interest Rates
- Foreign Stock Markets
- the Nasdaq
- the Dow
- the value of the Chinese Currency,
- Domestic Interest Rates,
- Crude Oil Prices, etc.
All of those factors are key drivers to the price movement of the U.S. Dollar. This is because markets are globally interconnected and that is the heart of our artificial intelligence software. Imagine if you could analyze all these relationships on your own. But trying to calculate them on your own requires massive quantitative-skills and a tremendous amount of time.
Can you see how the markets are interconnected globally?
Exactly!
And that is the problem. Traders who ignore the global nature of markets are making decisions without the facts.
Talk about RISKY!
The beauty of artificial intelligence is that it looks at these global correlations for each asset statistically to uncover the best opportunities and trends.
Here are the key statistical drivers to the U.S. Dollar at the present time presented in graphical format.
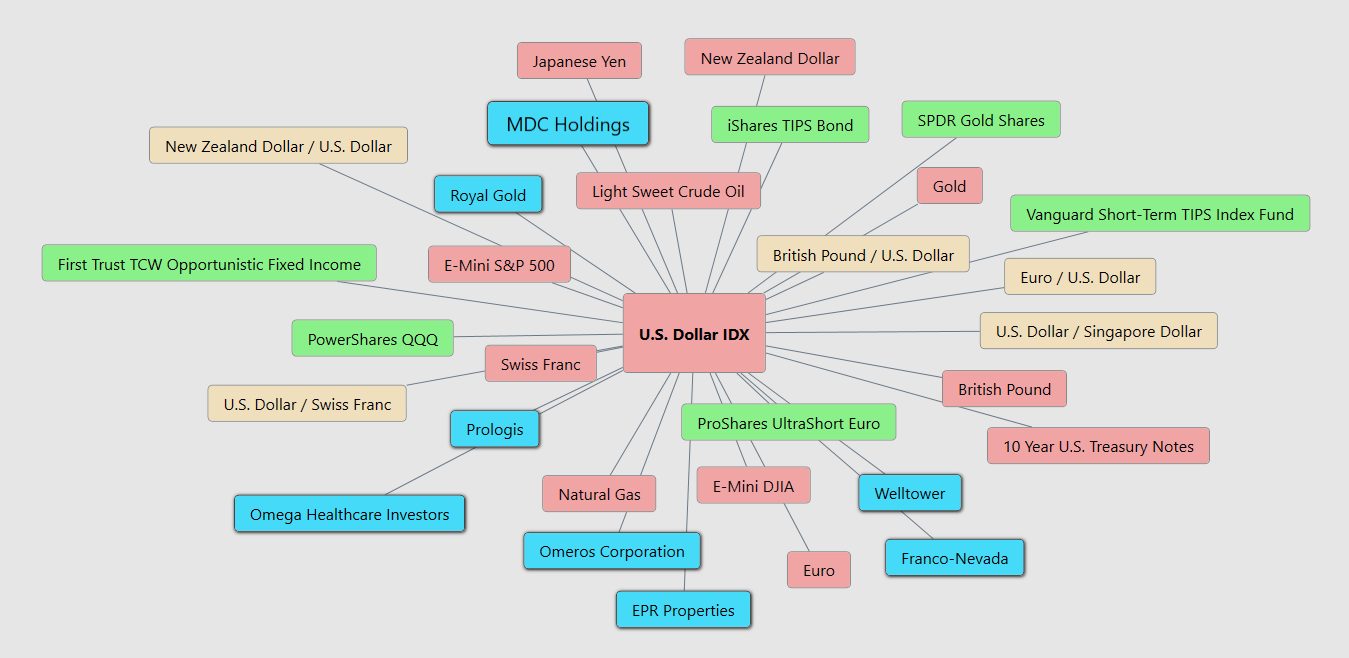
Having this type of horsepower is why traders love the Vantagepoint Artificial Intelligence Software.
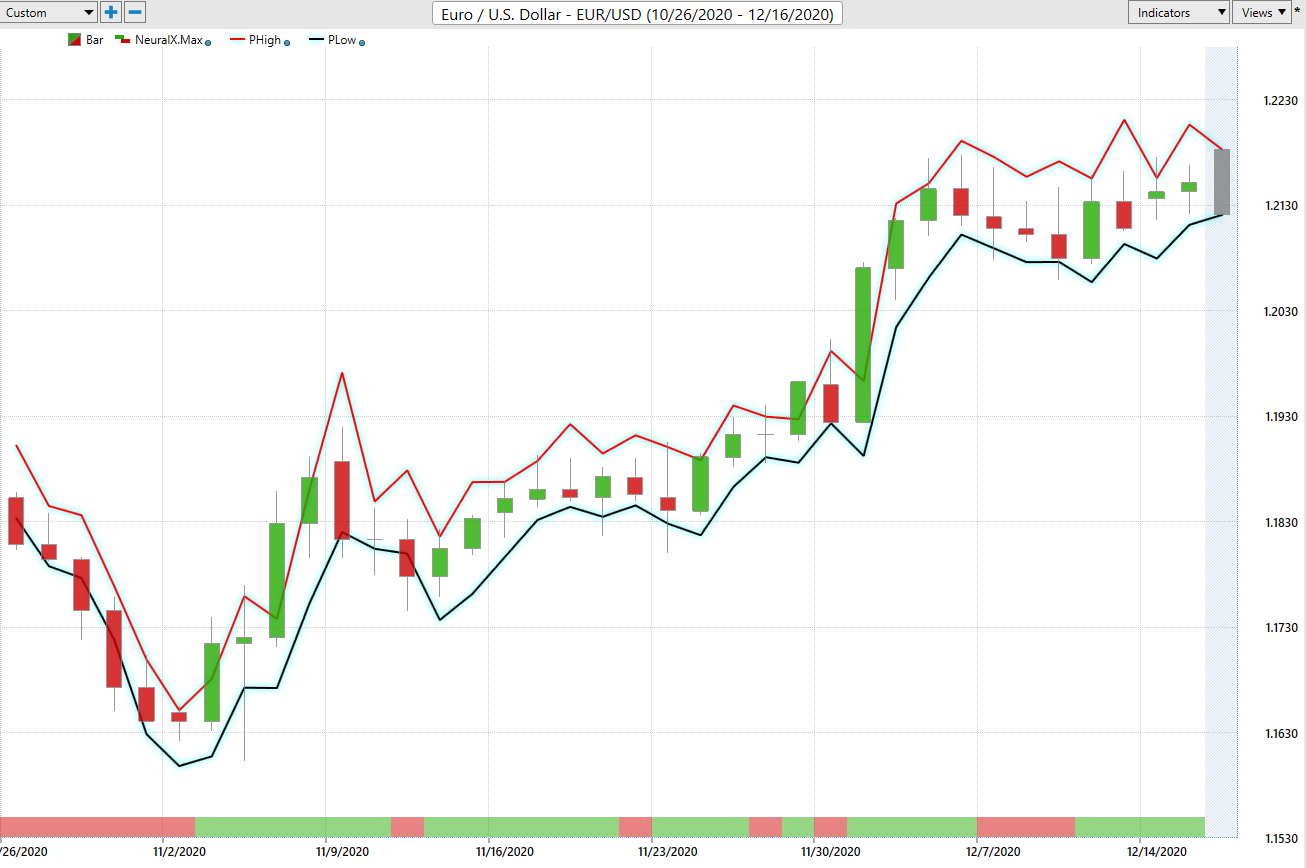
Every day, forex traders who use our software receive a daily trading range forecast which is priceless! As you can see it allows traders a preview of what the anticipated daily high and low price are anticipated to be. Buyers place their protective sell stops below the bottom dark line and place their limit orders above the red line to take profits.
The tools most traders are using rely on single market analysis, which puts them at a horrible disadvantage. This creates timing problems, bad trade selection and lack luster results.
So, why this story?
Let me be totally candid here:
- The market is brutally honest. There are winners and losers.
- It’s very black and white.
- If you need a friend, get a dog.
- If you are going to win, someone else has to lose.
- If survival of the fittest makes you uneasy, stay out of this game.
If you want to win, it’s all about who has the best tools.
Have you ever wondered what makes the biggest difference in a trader’s life? The difference lies in what each trader knows and how they use that knowledge. Trading with artificial intelligence plugs you into that powerful simplicity quickly and easily.
How do you think your investment portfolio compares when pitted against artificial intelligence?
You should find out. Join us for a FREE, Live Training. We’ll show you at least three currency pairs or stocks that have been identified by the A.I. that are poised for big movement…and remember, movement of any kind is an opportunity for profits!
Fair warning though — our LIVE online trainings are so popular we usually fill them within hours of making them available.
Discover why artificial intelligence is the solution professional traders go-to for less risk, more rewards, and guaranteed peace of mind.
Visit With US and check out the a.i. at our Next Live Training.
It’s not magic. It’s machine learning.
Make it count.
IMPORTANT NOTICE!
THERE IS SUBSTANTIAL RISK OF LOSS ASSOCIATED WITH TRADING. ONLY RISK CAPITAL SHOULD BE USED TO TRADE. TRADING STOCKS, FUTURES, OPTIONS, FOREX, AND ETFs IS NOT SUITABLE FOR EVERYONE.
DISCLAIMER: STOCKS, FUTURES, OPTIONS, ETFs AND CURRENCY TRADING ALL HAVE LARGE POTENTIAL REWARDS, BUT THEY ALSO HAVE LARGE POTENTIAL RISK. YOU MUST BE AWARE OF THE RISKS AND BE WILLING TO ACCEPT THEM IN ORDER TO INVEST IN THESE MARKETS. DON’T TRADE WITH MONEY YOU CAN’T AFFORD TO LOSE. THIS ARTICLE AND WEBSITE IS NEITHER A SOLICITATION NOR AN OFFER TO BUY/SELL FUTURES, OPTIONS, STOCKS, OR CURRENCIES. NO REPRESENTATION IS BEING MADE THAT ANY ACCOUNT WILL OR IS LIKELY TO ACHIEVE PROFITS OR LOSSES SIMILAR TO THOSE DISCUSSED ON THIS ARTICLE OR WEBSITE. THE PAST PERFORMANCE OF ANY TRADING SYSTEM OR METHODOLOGY IS NOT NECESSARILY INDICATIVE OF FUTURE RESULTS. CFTC RULE 4.41 – HYPOTHETICAL OR SIMULATED PERFORMANCE RESULTS HAVE CERTAIN LIMITATIONS. UNLIKE AN ACTUAL PERFORMANCE RECORD, SIMULATED RESULTS DO NOT REPRESENT ACTUAL TRADING. ALSO, SINCE THE TRADES HAVE NOT BEEN EXECUTED, THE RESULTS MAY HAVE UNDER-OR-OVER COMPENSATED FOR THE IMPACT, IF ANY, OF CERTAIN MARKET FACTORS, SUCH AS LACK OF LIQUIDITY. SIMULATED TRADING PROGRAMS IN GENERAL ARE ALSO SUBJECT TO THE FACT THAT THEY ARE DESIGNED WITH THE BENEFIT OF HINDSIGHT. NO REPRESENTATION IS BEING MADE THAT ANY ACCOUNT WILL OR IS LIKELY TO ACHIEVE PROFIT OR LOSSES SIMILAR TO THOSE SHOWN.