


Step back for a moment and consider what the stock market has delivered since 2023. Over the last three years, the S&P 500 Index has climbed roughly 70% in total, powered by annual gains of +26.29% in 2023, +25.02% in 2024, and +17.88% in 2025. Much of that advance traced back to the so-called ‘Magnificent Seven,’ whose dominance of headlines, capital flows, and index weightings turned market concentration into a feature rather than a flaw. But markets have a habit of rewarding participation while a trend is in favor and punishing complacency once leadership narrows or shifts. The real challenge for traders is not simply identifying strength but recognizing when to ride it decisively and when to step aside just as decisively. In this article, we will examine why monitoring sector rotation and evolving market leadership is critical and essential, even for short-term traders, and what tends to happen when that signal is ignored.
If you have been around markets for any length of time, you have seen this pattern before. A group of stocks dominates the headlines and outperforms decisively. They feel unstoppable, and every pullback gets bought while every earnings report is dissected like scripture. By year end, they become the ‘must-own’ names. Confidence builds because recent performance reinforces belief.
Then the calendar flips and something subtle begins to change. The crowd does not notice at first because last year’s winners feel safe. They worked, they rewarded conviction, and they made people look smart. Capital stays parked there long after the environment that created those gains begins to shift. Comfort quietly replaces analysis.
This is where recency bias does its damage. Traders assume what just worked will continue working, and media narratives reinforce that assumption. Analysts echo it, ETF flows amplify it, and soon the trade becomes crowded. Valuations stretch while relative performance begins to erode, even if prices still appear stable. The illusion of strength lingers.
The problem is not that last year’s winners are bad companies. The problem is that markets do not reward comfort, they reward adaptation. While the crowd remains anchored to what already happened, capital is quietly rotating. It moves toward improving fundamentals and emerging strength before headlines acknowledge the shift. Leadership changes before narratives do.
If you are positioned based on last year’s leadership, you are reacting instead of anticipating. In markets, reacting late is expensive. This article is about recognizing that shift early and understanding why simple gains are not enough. The crowd is still in last year’s winners, which is exactly why the opportunity is somewhere else.
There is nothing more dangerous in markets than feeling successful when you are not. A portfolio that rises 12% feels like progress and discipline. It feels smart because the account balance is higher. But context matters more than emotion. Without comparison, success can be misleading.
Then you compare that 12% to the S&P 500 Index. If the index rose 18%, your return was participation, not outperformance. Simple returns tell you whether you made money. Benchmarking tells you whether you gained ground. Those are not the same thing. Since over 80% of portfolio managers do not outperform the S&P 500 Index this is vitally important to understand.
In periods of abundant liquidity, many portfolios rise together. Gains feel universal and risk feels manageable. But if your holdings consistently lag the benchmark, you are accepting lower efficiency for the same exposure to market risk. That gap compounds over time. Professionals understand this instinctively.
Capital is competitive and it flows toward strength. If your stock rises more slowly than the benchmark, capital will eventually migrate elsewhere. Underperformance of three percent per year may not sound dramatic. Over a decade, it becomes a meaningful gap in wealth. Relative returns determine long term positioning.
The crowd celebrates positive returns. Professionals measure relative returns. The market does not reward you for being up. It rewards you for being stronger than the alternative.
In modern markets, benchmarking is not optional. It is the operating system beneath capital allocation. The S&P 500 Index functions as the scoreboard for institutions, pensions, hedge funds, and ETFs. When you own a stock, you are implicitly claiming it deserves capital instead of the benchmark. That is an active decision whether you acknowledge it or not.
Most portfolios are more active than their owners realize. Concentration in familiar names, overweight exposure to prior winners, and intuitive sector tilts all represent bets against the index. Benchmarking exposes those bets. It makes relative performance visible instead of assumed. Accountability replaces comfort.
Let’s look at sector performance for the last month and deduce what we can learn from it.
If markets had a bar tab, this scoreboard would tell you who’s buying and who’s drinking water.
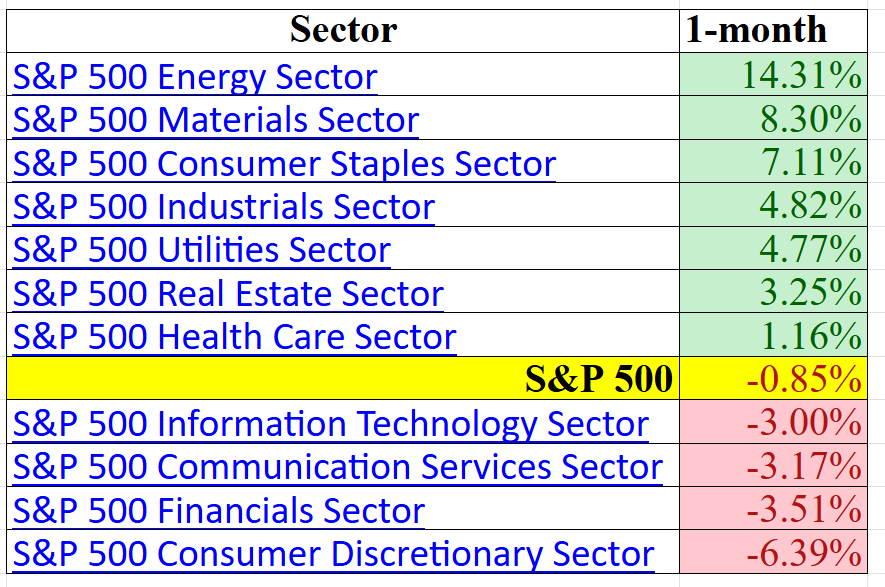
Over the last month, the S&P 500 Index is down a modest -0.85%, which is Wall Street’s version of shrugging. Not a crisis. Not a celebration. Just a market standing around checking its phone.
But beneath that mild exterior, the money is not standing still. It has packed a suitcase and quietly relocated.
Energy leads the parade at +14.31%, followed by Materials at +8.30% and Consumer Staples at +7.11%. Industrials and Utilities are comfortably positive. Real Estate is up. Health Care is up. In other words, capital has drifted toward things you can drop on your foot. Oil. Copper. Electricity. Rent. Toothpaste. Companies that make things, move things, or keep the lights on while you worry about things.
This is not a manifesto. It is a migration.
Meanwhile, the former darlings are sulking. Information Technology is down -3.00%. Communication Services off -3.17%. Financials negative. Consumer Discretionary down a theatrical -6.39%. The sectors that powered previous enthusiasm are now underperforming the S&P 500 Index, which itself is barely treading water.
This is only one time frame. One month does not a revolution make. Markets change their minds more often than politicians in an election year. But even a single snapshot tells you something important.
The index is flat. The rotation is not.
Money has moved toward what might politely be called safe havens. Not bunkers and canned beans. Just real assets and steady businesses. Stuff that gets consumed, rented, drilled, extracted, delivered, regulated, and billed monthly.
A trader looking at this scoreboard does not compose poetry about it. A trader makes eliminations.
If a sector is underperforming the S&P 500 Index, it is, by definition, worse than average. Why volunteer for worse than average? Traders avoid it. They gravitate instead toward the sectors showing the largest motion, the strongest relative strength, the unmistakable footprints of capital in motion.
One time frame. One clear message. The market may be flat, but the money is not.
Zoom out from the one-month snapshot and the year-to-date picture sharpens the story rather than contradicting it.
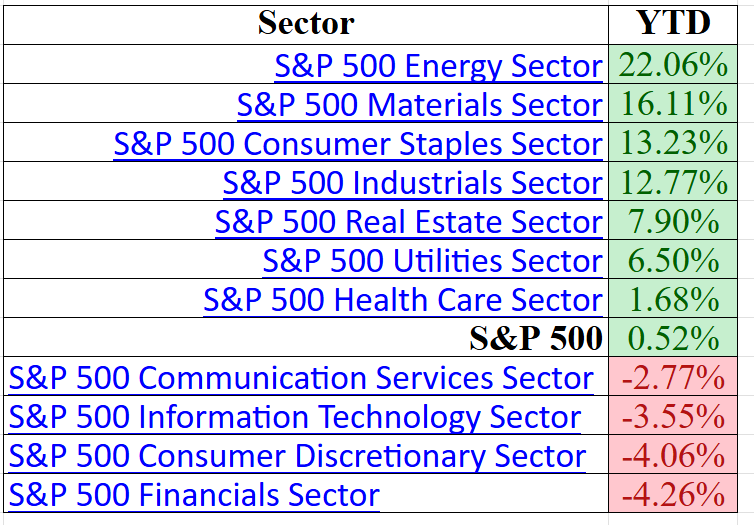
The S&P 500 Index is up a modest 0.52% year to date. That is not a roaring bull market. It is barely forward motion. And yet beneath that calm headline number, capital expresses very clear preferences.
Energy leads again, now up 22.06%. Materials follow at 16.11%. Consumer Staples, Industrials, Real Estate, and Utilities are all comfortably positive. These are not speculative corners of the market. They are businesses tied to physical assets, pricing power, infrastructure, and essential demand. The same “real stuff” that showed strength in the one-month view is dominating the year-to-date scoreboard.
That consistency matters.
What is different from the one-month frame is not leadership, but magnitude and confirmation. The rotation is not fleeting. It has persistence. Energy is not simply catching a bid. It is compounding gains. Materials are not merely bouncing. They are trending.
And then there is the other side of the ledger.
Communication Services is down -2.77% year to date. Information Technology off -3.55%. Consumer Discretionary negative. Financials trailing at -4.26%. The sectors that once defined index leadership are now a drag on the benchmark itself.
One very dangerous mistake in markets is not picking a bad company, but it is picking a perfectly good company trapped inside a weak sector. That is how portfolios stagnate. That is how capital gets stranded.
Choosing the wrong stock in the wrong sector is like voluntarily placing your equity in jail and hoping the warden will release you for good behavior. The business may execute flawlessly. Management may hit every earnings target. But if capital is rotating elsewhere, the stock remains confined. Markets reward relative strength, not moral virtue.
The question “Who is winning and who is losing?” is not rhetorical. It is foundational. It determines opportunity cost. It determines whether capital compounds or merely waits.
Two time frames. One month and year to date. Both tell the same essential story: the index is barely moving, but beneath the surface there is decisive rotation toward tangible, asset backed, economically sensitive sectors and away from last cycle’s growth leaders.
In a market defined by rotation rather than broad expansion, knowing where money is flowing is not optional. It is the difference between participating in momentum and serving a sentence in stagnation.
Let’s add the 52-week time frame analysis into the mix.
Now we’ve got the full scoreboard laid out. Three time frames: one month, year to date, and one year. This is where the excuses stop. When you stack all three together, patterns jump off the page. The market may look complicated, but this grid makes it simple.
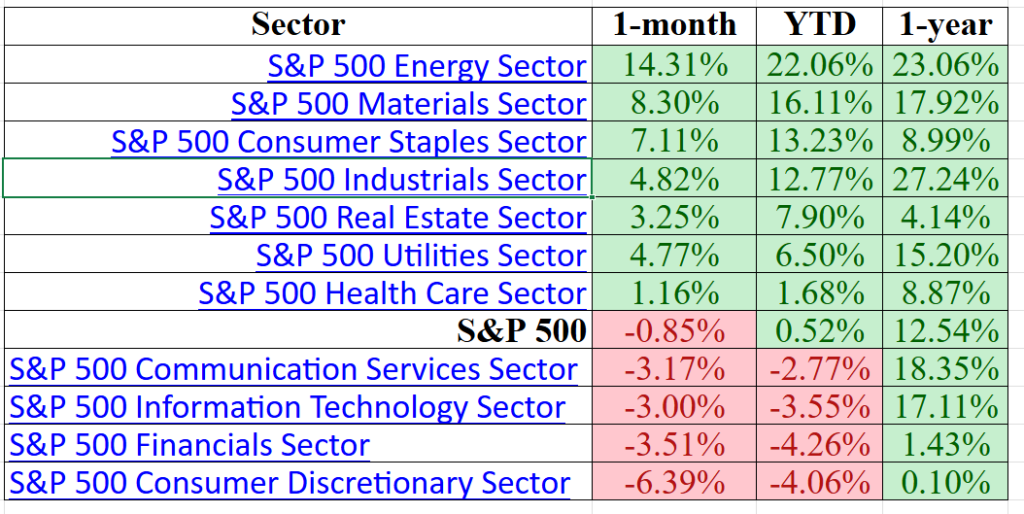
Start with the obvious winners. Energy is up 14.31% in one month, 22.06% year to date, and 23.06% over one year. That is not a bounce or a lucky streak. That is sustained capital flow. When money keeps showing up across multiple time frames, it is not guessing.
Now look at Materials and Industrials. Both are green across every column. Industrials in particular show serious strength with a 27.24% one-year return layered on top of short and intermediate gains. That is what leadership looks like when institutions commit capital. Add in Consumer Staples and Utilities, and you see durability rather than drama.
Then we move to what is broken. Information Technology and Communication Services are positive over one year but negative in the shorter windows. That is deterioration in real time. The leadership that once drove the index is losing traction. When performance cracks across time frames, that is distribution, not randomness.
The weakest profiles belong to Consumer Discretionary and Financials. Both are red in the short term and red year to date, with little to show over one year. That is not momentum. That is capital leaving the room. When a sector cannot outperform the S&P 500 Index, it becomes a headwind rather than a tailwind.
Here is the practical takeaway. Markets reward consistency across time frames. The most attractive sectors are those aligned in one month, year to date, and one year performance: Energy, Materials, and Industrials. The most unattractive are those bleeding across multiple periods, especially Consumer Discretionary and Financials.
Picking the wrong stock in the wrong sector is not bad luck. It is choosing to swim against institutional current. Strength within strength compounds. Weakness inside weakness traps capital.
Every dollar allocated to a lagging position is a dollar not allocated to leadership. Institutions understand this and reallocate systematically rather than emotionally. Underperformance invites redemptions, which force selling and reinforce weakness. The feedback loop becomes self-fulfilling.
Benchmarking is not about imitation. It is about discipline. It forces a simple question that every investor must answer. If this position cannot beat the index, why own it?
What is important to understand is that money does not disappear from markets, it moves. When investors sell one sector, they are reallocating rather than retreating. They shift capital toward areas where growth, earnings, and momentum appear stronger. That movement is sector rotation. It is the visible footprint of institutional decision making.
When interest rates rise, capital often rotates out of high multiple growth stocks into sectors with pricing power and hard assets. When inflation accelerates, money may flow toward Energy, Materials, or Industrials. When growth slows, defensive sectors such as Staples and Utilities attract attention. Leadership changes as economic conditions change.
Many traders focus on price alone. They see a familiar name holding up and assume nothing has changed. Meanwhile, relative performance deteriorates as new sectors begin outperforming the S&P 500 Index. That divergence is the signal. Rotation often begins before headlines adjust.
It starts subtly with weeks of outperformance that turn into months. Institutions follow earnings revisions, relative strength, and capital flows rather than narratives. By the time rotation is obvious, early opportunity has passed. Markets reward those who observe movement before it becomes consensus.
If you want to understand where the market is going, do not ask what led last year. Ask where money is moving now. Leadership is earned quarter by quarter. If you are not rotating with it, you are falling behind.
There is a powerful force in markets that rarely appears on balance sheets. It is comfort. Investors cling to last year’s winners not because data demands it, but because familiarity reduces anxiety. Recent success creates confidence that feels rational.
Recency bias reinforces this attachment. The mind extrapolates recent performance into the future. Social proof strengthens belief as institutions, commentators, and peers echo the same narrative. Agreement begins to substitute for analysis.
ETF flows intensify concentration in the largest names. Heavier index weightings attract more capital, which supports price and reinforces conviction. Analysts are often slow to adjust tone, so optimism lingers even as relative strength fades. The erosion feels temporary rather than structural.
Traders can rationalize underperformance as consolidation. They hesitate to sell because they remain profitable in absolute terms. Meanwhile, new sectors quietly outperform the S&P 500 Index and attract capital. Opportunity cost builds without dramatic headlines.
Markets reward recognition of change rather than attachment to history. The crowd stays where it once prospered. The disciplined investor moves where capital is being treated best now.
Ignoring sector rotation rarely destroys a portfolio overnight. The damage appears as quiet underperformance that compounds over time. Holdings remain respectable but no longer lead. Capital shifts elsewhere while your positions move sideways.
You are not necessarily losing money. You are losing opportunity. As institutions fund new leadership by selling prior winners, supply pressure builds. Rallies weaken and breakouts fail.
Great traders often do not prosper because they are braver. They prosper because they see sooner.
In every market cycle there are those who react and those who anticipate. Today, anticipation is no longer a luxury. It is a necessity. Technology has quietly handed individual traders the same analytical horsepower once reserved for institutions. When you allow VantagePoint’s artificial intelligence software to do the heavy lifting, predicting stock and options trends 3 days in advance with up to 87.4% proven accuracy, then monitoring sector rotation, relative strength, predictive indicators, and intermarket relationships becomes not only possible, but efficient.
You are no longer forced to guess.
In volatile markets, the priority is not chasing headlines. It is bulletproofing your portfolio. That requires a method capable of identifying durable trends, filtering out chronic underperformance, and aligning capital with measurable strength. In periods of aggressive fiscal policy and relentless liquidity expansion, markets distort. Narratives multiply. Emotions escalate.
Clarity becomes a competitive advantage.
VantagePoint A.I.-driven trading provides that clarity. It sifts through enormous volumes of market data in seconds, isolates emerging leadership, and highlights weakness before it becomes obvious. Instead of reacting to price after the move, you gain insight into probable direction. Instead of hoping a lagging position recovers, you measure it against the S&P 500 Index and act with discipline.
That is not speculation. That is structure.
If governments continue to expand debt and central banks continue to engineer liquidity, volatility will remain a feature, not a flaw. In such an environment, the trader who relies solely on opinion stands exposed. The trader who integrates VantagePoint A.I. stands informed.
This is why I urge you to see it for yourself.
Join us for the Learn How to Trade with VantagePoint A.I. Free Live Online Masterclass. In this session, you will discover the A.I. in action. You will observe how it identifies sector strength, forecasts trend shifts, and measures relative performance. Most importantly, you will have the opportunity to pressure test your favorite tickers and evaluate them through a predictive lens rather than a reactive one.
The markets will remain competitive. Capital will continue to rotate. Those who monitor intelligently will adapt. Those who do not will drift.
The choice, as always, is yours.
Your financial future will not wait while you deliberate. Act now. Claim your seat before opportunity moves on without you.
Visit us and check out the A.I. at our Next FREE Live Training.
PAY ATTENTION!
It’s not magic. It’s machine learning.
Make it count.
THERE IS A SUBSTANTIAL RISK OF LOSS ASSOCIATED WITH TRADING. ONLY RISK CAPITAL SHOULD BE USED TO TRADE. TRADING STOCKS, FUTURES, OPTIONS, FOREX, AND ETFs IS NOT SUITABLE FOR EVERYONE.IMPORTANT NOTICE!
DISCLAIMER: STOCKS, FUTURES, OPTIONS, ETFs AND CURRENCY TRADING ALL HAVE LARGE POTENTIAL REWARDS, BUT THEY ALSO HAVE LARGE POTENTIAL RISK. YOU MUST BE AWARE OF THE RISKS AND BE WILLING TO ACCEPT THEM IN ORDER TO INVEST IN THESE MARKETS. DON’T TRADE WITH MONEY YOU CAN’T AFFORD TO LOSE. THIS ARTICLE AND WEBSITE IS NEITHER A SOLICITATION NOR AN OFFER TO BUY/SELL FUTURES, OPTIONS, STOCKS, OR CURRENCIES. NO REPRESENTATION IS BEING MADE THAT ANY ACCOUNT WILL OR IS LIKELY TO ACHIEVE PROFITS OR LOSSES SIMILAR TO THOSE DISCUSSED ON THIS ARTICLE OR WEBSITE. THE PAST PERFORMANCE OF ANY TRADING SYSTEM OR METHODOLOGY IS NOT NECESSARILY INDICATIVE OF FUTURE RESULTS. CFTC RULE 4.41 – HYPOTHETICAL OR SIMULATED PERFORMANCE RESULTS HAVE CERTAIN LIMITATIONS. UNLIKE AN ACTUAL PERFORMANCE RECORD, SIMULATED RESULTS DO NOT REPRESENT ACTUAL TRADING. ALSO, SINCE THE TRADES HAVE NOT BEEN EXECUTED, THE RESULTS MAY HAVE UNDER-OR-OVER COMPENSATED FOR THE IMPACT, IF ANY, OF CERTAIN MARKET FACTORS, SUCH AS LACK OF LIQUIDITY. SIMULATED TRADING PROGRAMS IN GENERAL ARE ALSO SUBJECT TO THE FACT THAT THEY ARE DESIGNED WITH THE BENEFIT OF HINDSIGHT. NO REPRESENTATION IS BEING MADE THAT ANY ACCOUNT WILL OR IS LIKELY TO ACHIEVE PROFIT OR LOSSES SIMILAR TO THOSE SHOWN.

