The Holiday season is filled with its shares of traditions. For many, it’s a time of joy and simple reflection with family and friends. But the Christmas season also creates a stir of hope and tradition among the Wall Street trading community — they sit by their swing trading computers and prognosticate that “Santa Claus is coming to town” and he will bring rising asset prices.
Back in 1972, Yale Hirsch of the Stock Traders Almanac observed a powerful seasonal trend that was consistently more reliable than any other pattern he uncovered in his stock market research. The pattern was that the stock market yields positive returns during the last five trading days of December and the first two trading days of the New Year.
Hirsch expanded his research on this seven-day trading window by analyzing data on the Dow Jones Industrial Average all the way back to 1896.
What Hirsch observed and reported was that during these 7 trading days most of the time the yield on this seasonal pattern was positive.
Many analysts have studied the pattern and extrapolated further that the Santa Claus Rally was a predictor of the performance of the market over the next full year. We will also look at that in this article.
Why Does a Santa Claus Rally Happen?
No one knows the reason why a Santa Claus Rally arrives in December and gifts investors with positive returns through the holidays. There are many theories.
Amongst the most popular ideas as to why this consistently occurs is that analysts believe that people receive their Christmas bonuses in December and the stock market remains the favorite location for those funds to be spent.
Others believe that the Santa Claus rally comes on the heel of tax loss harvesting which traditionally occurs in the early weeks of December. Professional investors often dump their losing investments in the first two weeks of December before the end of the year. December is known to be one of the best months of the year for stock performance, but most don’t realize that most gains happen in the last two weeks of the month.
It is believed that tax selling temporarily pushes down stock prices in the beginning of the month, but that trend is soon reversed as investors begin buying stocks again after Christmas, pushing asset prices higher.
Others insist that the Santa Claus Rally is related to institutional investors being vacation over the holidays and aren’t actively trading during that time.
The reality is that while many theories abound, the long-term statistics do prove the seasonal tendency for stocks to increase during this time frame, but no knows for sure why this might occur, not can they assure in advance that it will occur this year with any certainty.
How Frequently Do Santa Claus Rallies occur?
Historically, the Santa Claus Rally has occurred 77% of the time between 1950 to 2020. The rally has proven to create a positive return of an average of 1.3% during that period.
Regardless of the mechanics behind the rally, the Santa Claus rally is an observable effect, and it occurs in better than 3 out of 4 years, so investors should be prepared to see whether this will develop at the end of each year.
According to statisticians who have studied the data they claim that there’s just a 31% chance the S&P 500 produces a 1.3% gain during a random seven-day trading period. Thus, the Santa Claus Rally is the real deal and produces a gain more than twice as often as one would normally expect.
Over the last two decades decades the Santa Claus Rally has provided some fascinating results. An interesting turn of phrase that Yale Hirsch coined to describe how a lack of a Santa Claus rally will affect the market. He said: “If Santa Claus should fail to call, bears may come to Broad and Wall.” This refers to the exact location of where the New York Stock Exchange is located. Hirsch was naturally quipping that a failure for the Santa Claus rally to appear would often result in a bear market for the following year.
‘Twas the day after Christmas
When all through the Street
All the traders were stirring
Looking for treats
The a.i. was forecasting
That bulls should beware
All dreamed of the rally
Would not awaken the bear
How true is this? Here is some data worth analyzing in between sips of egg nog this holiday season.
| Year | Rally Results | January Results | Results for Calendar Year |
| 1999 | -4.00% | -5.10% | -10.10% |
| 2000 | 5.70% | 3.50% | -13% |
| 2001 | 1.80% | -1.60% | -23.40% |
| 2002 | 1.20% | -2.70% | 26.40% |
| 2003 | 2.40% | 1.70% | 9% |
| 2004 | -1.80% | -2.50% | 3% |
| 2005 | 0.40% | 2.50% | 13.60% |
| 2006 | 0.00% | 1.40% | 3.50% |
| 2007 | -2.50% | -6.10% | -38.50% |
| 2008 | 7.40% | -8.60% | 23.50% |
| 2009 | 1.40% | -3.70% | 12.80% |
| 2010 | 1.10% | 2.30% | 0.00% |
| 2011 | 1.90% | 4.40% | 13.40% |
| 2012 | 2.00% | 5.00% | 29.60% |
| 2013 | 0.20% | -3.60% | 11.40% |
| 2014 | -3% | -3.10% | -0.70% |
| 2015 | -2.30% | -5.10% | 9.50% |
| 2016 | 0.40% | 1.80% | 19.40% |
| 2017 | 1.10% | 5.60% | -6.20% |
| 2018 | 1.30% | 7.90% | 28.90% |
| 2019 | 0.30% | -0.20% | 14.40% |
| 2020 | 0.36% | 2.41% | 26.9% approx.. |
As you ponder the numbers observe that in 1999 the Santa Claus Rally generated the worst result with a negative -4.0% return. During that year the market was down -10.10% cumulatively.
The same occurred in 2007, when the Santa Claus rally resulted in a minus -2.50% result. The market in 2007 was down -38.5%.
In 2014, the Santa Claus rally resulted in negative -3% return and the market was down -.7% for the entire year.
Bottom Line
The Santa Claus Rally theory has massive data to support its correlation. For this reason, is it important to be aware of it. However, successful trading requires context. You need to look at the possibilities of the Santa Claus rally in relation to all the important data points that affect prices.
Otherwise, you are simply focused on what SHOULD occur.
For example, the Federal Reserve last week announced, in the face of rising inflation and a booming economy that it would further reduce its purchases of Treasury and mortgage-backed securities and raise interest rates 3 times in 2022.
How well do you remember the Dotcom bubble of 2000?
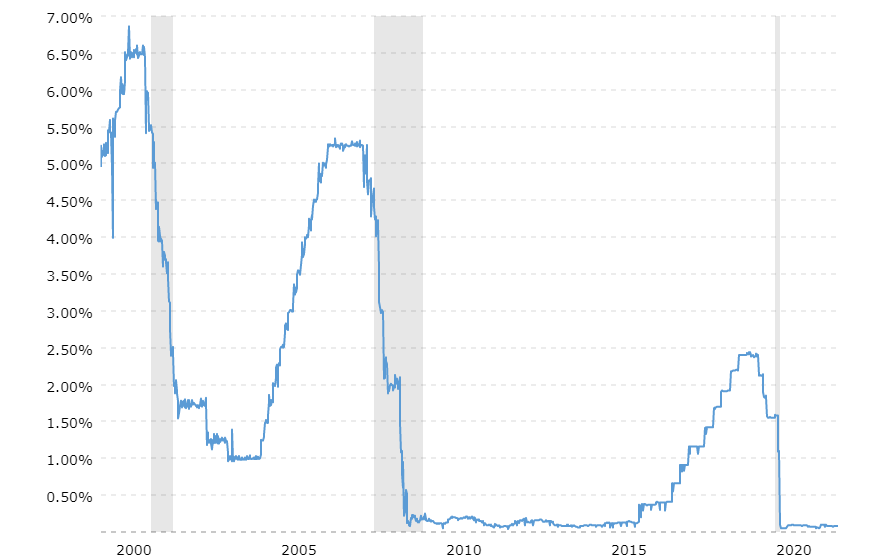
If you were trading back, then you will vividly recall that what caused the dotcom bubble to implode was that Fed Chairman Alan Greenspan raised interest rates in late February 2000 and by early March the dotcom bubble had started its implosion. This decline saw companies like Amazon which was still in its infancy drop over 90%.
What about inflation?
Earnings?
Government Spending?
The point I’m making is regardless how intelligent you are, it is extremely challenging trying to make sense of it all and develop a decision-making process that is profitable and consistently reliable.
That is why top traders today are using artificial intelligence to hone their timing and trend analysis.
It all boils down to understanding the difference between two words: “IS” and “SHOULD.”
Successful trading is about focusing on what “IS” occurring, not what “SHOULD” occur.
A stock may have a very alluring story.
A stock may have a very effective management team.
A stock may have incredible earnings.
A stock may have infrastructure, partnerships, uniqueness, etc.,
But, if these elements are not reflected in the price, you are focused on what “SHOULD” occur in the market.
And the word should is responsible for more losses in trading than any other.
Bad Traders Obsess on the SHOULD. Every other word out of their mouths’ is SHOULD.
I can’t recall how many times a trader has told me all the reasons why his portfolio is heavily invested in a stock because of a great story, in spite of the stock being in a firm downtrend. It is horribly painful to listen to.
The beauty of neural networks, artificial intelligence, and machine learning is that it is fundamentally focused on pattern recognition to determine the best move forward. When these technologies flash a change in forecast it is newsworthy. We often do not understand why something is occurring but that does not mean that we cannot take advantage of it.
The following charts illustrate how Vantagepoint power traders READ the price action to anticipate tomorrow’s headline NEWS.
PRICE is the only thing that will make you RICH or POOR. And it is these price changes correlated to the asset classes which are most statistically relevant which are responsible for creating these trend forecasts which have proven to be up to 87.4% accurate.
More importantly, look at how the artificial intelligence kept traders on the right side of the downtrend every step of the way.
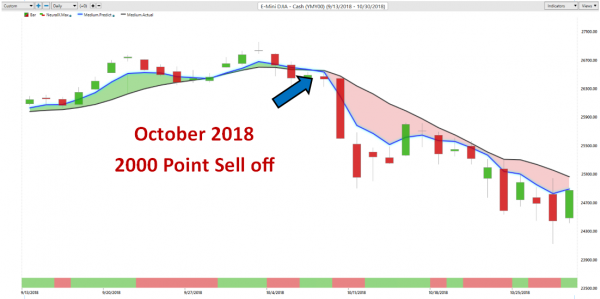
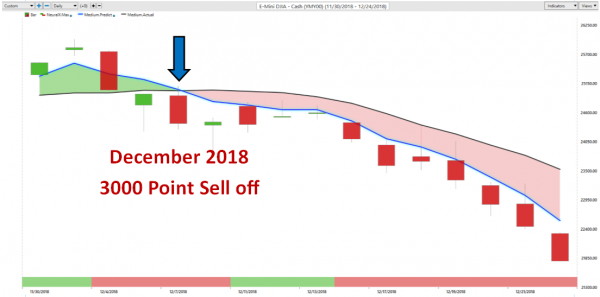
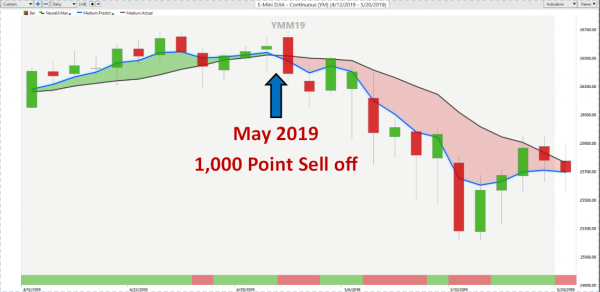
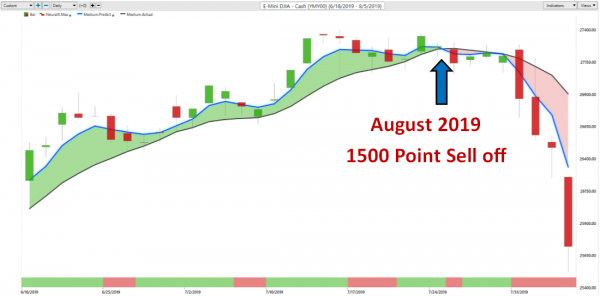
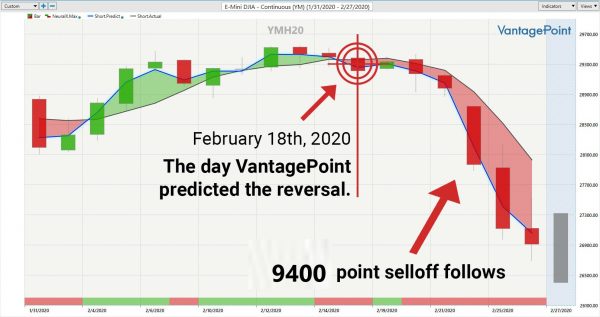
This is the power of artificial intelligence in action.
Bad Traders Obsess on the SHOULD.
But when “SHOULD” and “IS” meet, some explosive things can happen and that is exactly where we want to be as traders!
That is why artificial intelligence for traders is so indispensable.
Mistakes are financially costly but for machine learning, it is the pathway to mastery and excellence. The real education in trading always lies in learning from the losers.
Most humans have a really hard time learning from bad experiences. The ego gets in the way, every time.
Since artificial intelligence has beaten humans in Poker, Chess, Jeopardy and Go! do you really think trading is any different?
Knowledge. Useful knowledge. And its application is what A.I. delivers.
You should find out. Join us for a FREE Live Training.
We’ll show you at least three stocks that have been identified by the A.I. that are poised for big movement… and remember, movement of any kind is an opportunity for profits!
Discover why artificial intelligence is the solution professional traders go-to for less risk, more rewards, and guaranteed peace of mind.
Visit with us and check out the A.I. at our Next Live Training.
It’s not magic.
It’s machine learning.
Make it count.
THERE IS A SUBSTANTIAL RISK OF LOSS ASSOCIATED WITH TRADING. ONLY RISK CAPITAL SHOULD BE USED TO TRADE. TRADING STOCKS, FUTURES, OPTIONS, FOREX, AND ETFs IS NOT SUITABLE FOR EVERYONE.IMPORTANT NOTICE!
DISCLAIMER: STOCKS, FUTURES, OPTIONS, ETFs AND CURRENCY TRADING ALL HAVE LARGE POTENTIAL REWARDS, BUT THEY ALSO HAVE LARGE POTENTIAL RISK. YOU MUST BE AWARE OF THE RISKS AND BE WILLING TO ACCEPT THEM IN ORDER TO INVEST IN THESE MARKETS. DON’T TRADE WITH MONEY YOU CAN’T AFFORD TO LOSE. THIS ARTICLE AND WEBSITE IS NEITHER A SOLICITATION NOR AN OFFER TO BUY/SELL FUTURES, OPTIONS, STOCKS, OR CURRENCIES. NO REPRESENTATION IS BEING MADE THAT ANY ACCOUNT WILL OR IS LIKELY TO ACHIEVE PROFITS OR LOSSES SIMILAR TO THOSE DISCUSSED ON THIS ARTICLE OR WEBSITE. THE PAST PERFORMANCE OF ANY TRADING SYSTEM OR METHODOLOGY IS NOT NECESSARILY INDICATIVE OF FUTURE RESULTS. CFTC RULE 4.41 – HYPOTHETICAL OR SIMULATED PERFORMANCE RESULTS HAVE CERTAIN LIMITATIONS. UNLIKE AN ACTUAL PERFORMANCE RECORD, SIMULATED RESULTS DO NOT REPRESENT ACTUAL TRADING. ALSO, SINCE THE TRADES HAVE NOT BEEN EXECUTED, THE RESULTS MAY HAVE UNDER-OR-OVER COMPENSATED FOR THE IMPACT, IF ANY, OF CERTAIN MARKET FACTORS, SUCH AS LACK OF LIQUIDITY. SIMULATED TRADING PROGRAMS IN GENERAL ARE ALSO SUBJECT TO THE FACT THAT THEY ARE DESIGNED WITH THE BENEFIT OF HINDSIGHT. NO REPRESENTATION IS BEING MADE THAT ANY ACCOUNT WILL OR IS LIKELY TO ACHIEVE PROFIT OR LOSSES SIMILAR TO THOSE SHOWN.