Register for a Free Live Training
The Hot Stocks Outlook uses VantagePoint’s market forecasts that are up to 87.4% accurate, demonstrating how traders can improve their timing and direction. In this week’s video, VantagePoint Software reviews forecasts for Haemonetics ($HAE), Marriott ($MAR), DraftKings ($DKNG), Madison Square Garden Sports ($MSGS), Jfrog ($FROG)
VantagePoint AI Hot Stocks Outlook June 12, 2026
Hello again, traders, and welcome back to the Hot Stocks Outlook for June 12, 2026. Hope you all have had an excellent week out there in the financial markets, and as always, we’re here to take a look at the most recent VantagePoint AI predictive forecast. So, if you haven’t already, be sure to go ahead and click the link down in the description below and get signed up for a live demonstration, and you can learn all the specifics about how these predictive indicators and technologies are helping traders make much better trading decisions out in the marketplace.
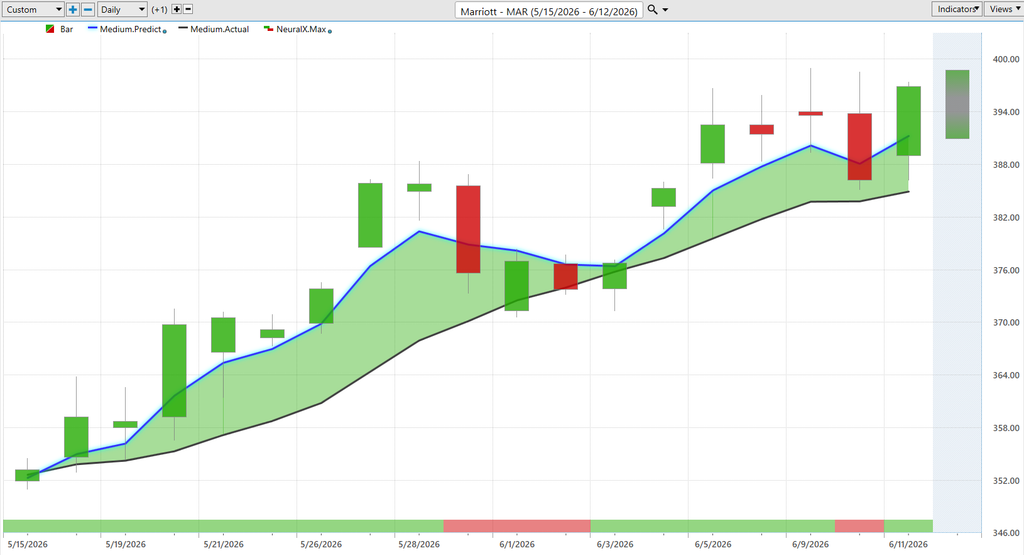
And so we can start out with shares of Marriott, a really great example of how all of these predictive tools work together. We’ll revisit a couple of stocks from the previous weeks and then a couple of new opportunities here. But with Marriott, of course, what we have here is daily price action. All the predictive VantagePoint tools work off of end-of-day data. And so against those daily candles, what you’re going to notice is there is a black line and also a blue line value.
And so what the black line is, is a simple moving average, or what we refer to as the actual simple moving average. In this case, it would be a 10-period. So it would just look at the previous 10 closed prices, add them all together, and then divide by that number. And that gives us a rolling measure of really where market prices have already been. And this is really the weakness with traditional technical analysis, is that all the data to generate a value like this, and really most technical analysis indicators, comes from the past and is really just reconfiguring what’s already occurred.
So it has no predictive capability. But what VantagePoint traders are able to do is compare that black line to this blue line. And for this value, which we can think of as a price, for it to get calculated and plotted on the chart every evening for traders, well, this is where the technology of artificial neural networks comes into play. And what they’re doing is performing what we would call intermarket analysis. And what that means is that rather than just looking at previous closed prices and reconfiguring that data, VantagePoint’s artificial neural networks are looking at dozens of other markets that are known to drive and influence future price.
So this can be things like other individual stocks, individual equities, maybe some other hotel stocks, maybe not. It’ll look at ETF groups that really wrap up sectors of the broader market. But this really goes global in that it’s going to look at things like global currencies, the bond market and interest rates, and even potentially major commodities where applicable to that specific forecast.
And so all of this data is utilized to generate predictions on where price is headed next and has a very high level of accuracy associated with these indicators. So whenever we see this blue line cross above the black line, what’s suggesting that these average prices are going to start going higher. Swing and position traders can utilize that information to understand, okay, where’s the direction of the overall trend? We see over the past 18 trading days since that forecast came through, shares up about 11, almost 12% here on shares of Marriott, just really over the past, you know, 18 trading days, a very nice move.
Now, that’s not the only tool here that’s utilizing that predictive data to generate these forecasts. If you look at the very bottom of the chart, you’ll see this bar that goes from green to red and back to green. And this is what’s called the VantagePoint Predicted Neural Index. And it gets updated every evening and it anticipates short-term strength or weakness just over the next 48 hours.
So it’s really tuned to solve a different problem for the trader, that being short-term strength or weakness over that short window. And so we see as that Neural Index goes bearish here, you get this sideways price action, right? The market’s going to settle down. And over these few trading days, a trader needs to understand that, look, the trend is still up. That blue line is still above the black line, but you can anticipate that short-term weakness.
Now, lastly, VantagePoint users are provided a predicted high and a predicted low. So now we’re down to utilizing those artificial neural networks to really hone in on intraday highs and lows for the upcoming trading day. And this is really what rounds out the forecast. And we can look at how accurate all of those predictions were against the actual market data.
So you see early as this trend gets started, it’s telling you, look down towards these predicted lows to accumulate a position. We see this quite a bit here where we zoom out of that area. The trend is very strongly bullish, but the market sort of recalibrates and often moves back towards previous lows. But again, moving down to predicted low, predicted low, predicted low, predicted low, and the overall trend very clearly to the bullish side here and seeing a very nice rally over these past 18 trading days.
So again, traders can utilize all of this information to really adapt to those changing market conditions.
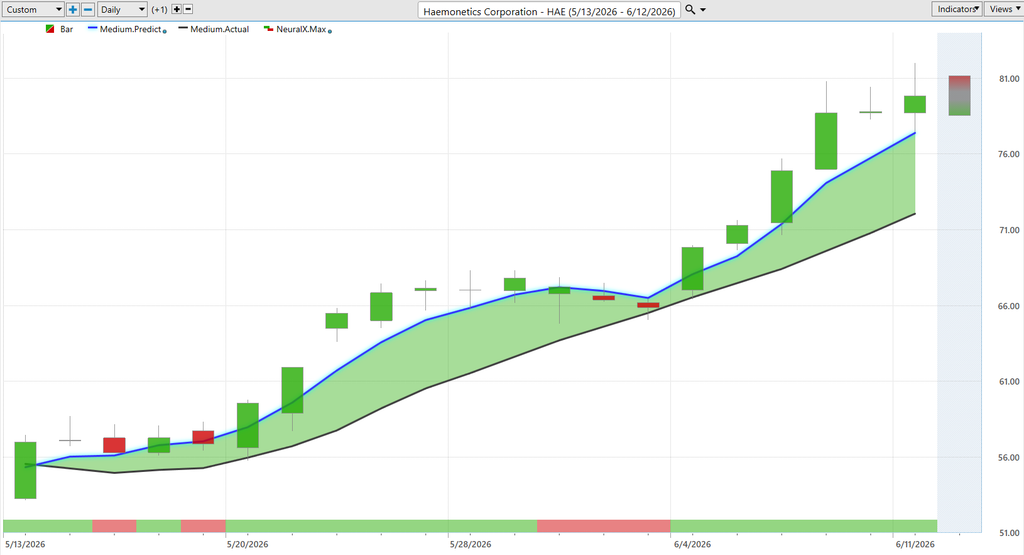
Now, over the past week, we’ve seen a lot of volatility, especially across the NASDAQ and tech space. Well, here’s HAE. This is actually the market we started last week’s Hot Stocks Outlook on. And you see here that actually going into Friday, well, very clearly we see this would have been Monday through Thursday. So this is Friday’s candle.
You see going into that trading day, it’s full steam ahead here, right? Blue line above the black line, Neural Index very bullish. So in one of the weakest days on the NASDAQ, this stock actually goes higher and then continues on this week with another 13, almost 14% rally to the upside.
And you see VantagePoint’s forecast here is about as bullish as it gets and the trend is up. Expect strength over these 48-hour windows, despite that weakness that we’ve seen across the NASDAQ. So overall, this market now up almost 40% in the past 20 trading days. And of course, those predicted highs and lows have been that guidance really the whole way and really adapting every single trading day.
So traders can make the most of these opportunities, adjust or build on that existing position. So, really nice opportunity there.
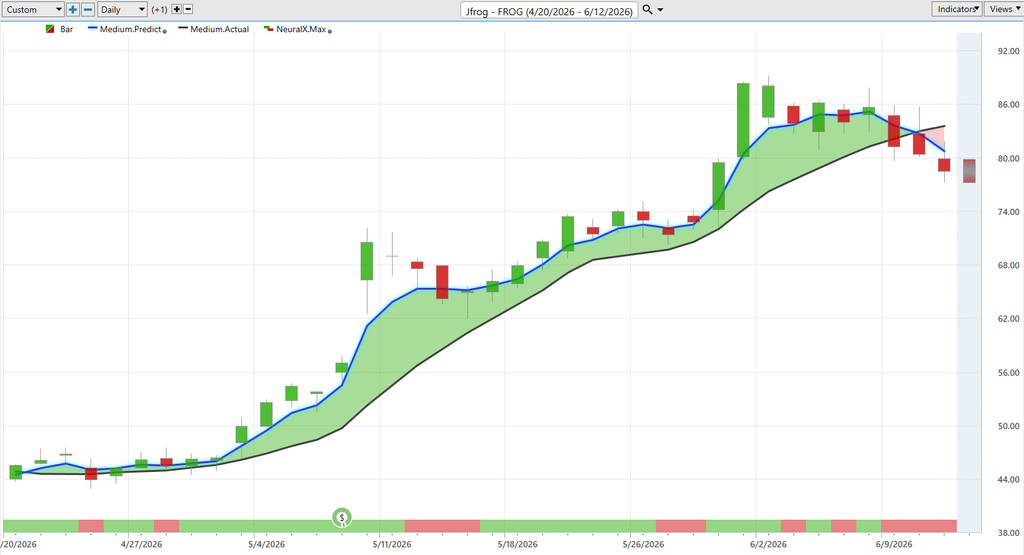
Here’s JFrog. This was actually another market that we looked at. Very strong uptrend. We saw so many stocks start to perform well at the beginning of April. But notice what we’re seeing here, this blue line crossing below the black line. Notice the Neural Index, much more mixed and bearish here.
So when we compare something like JFrog, you’re getting that information that says, hey, expect some weakness in the short term and actually expect that trend to actually shift to the bearish side. Unlike HAE, which is clearly still bullish. So traders can adjust that portfolio and say, look, take some profits here, get out of the way, and potentially move that capital into markets where the trend is still intact.
So you see about an 81% crossover over 36 trading days since those signals came through. And again, just this couple of month period, we’ve seen so many stocks, especially on the tech side, perform extremely well. Great opportunity to go ahead and take some profits.
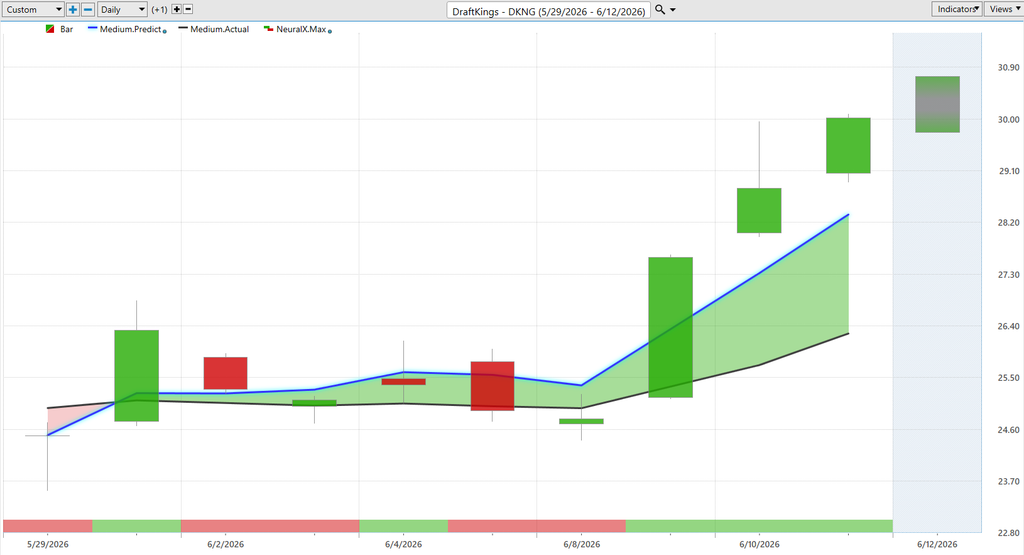
Here’s DraftKings. So another good example of how all of these predictive tools work together. Blue line crossing above the black line, letting you know, look, the trend is up here. You don’t really want to go long, take profits on long positions. But notice the Neural Index gets bearish.
And so what do you get over the subsequent price action? Well, you’re just running sideways here, really not changing direction here, but not seeing that momentum to the bullish side. Once that Neural Index gets bullish, we see, again, that momentum really start to pick up in the market.
And of course, those predicted highs and lows being a very particular roadmap here, letting you know exactly where you should expect price to trade and where you might want to be taking action on the market. So here, just in the past four trading days, seeing this market from predicted low towards these most recent close price, about a 22% rally here, just in about four trading days.
Madison Square Garden Sports ($MSGS)
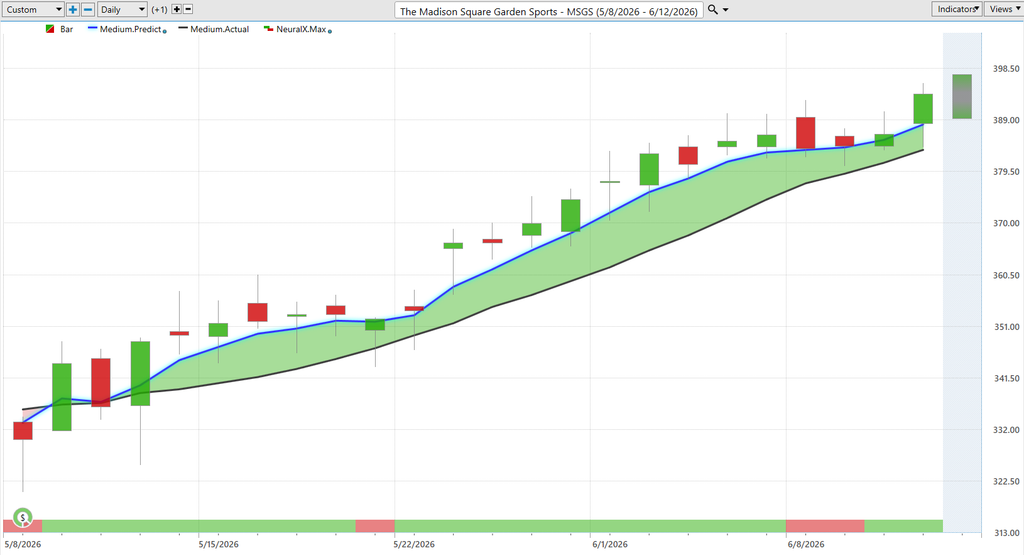
And lastly, here with the NBA Finals, we’ve got Madison Square Garden Corporation here. Blue line over black line, Neural Index very bullish here. You see you have one day it goes bearish, then gets bullish again. You see a ton of momentum in the market.
Again, here, a little dip where the market runs sideways, but very clearly the trend is solidly bullish. And when you understand the overall trend direction, and then we can come in and fine-tune these entries, you’re not going to hit that predicted low every single time. But certainly you see that within a week or so, you’re getting a very good entry as far as the overall price action.
And that really comes down to the ability of the software to adapt, right? So every single day it’s taking in the data from the target market, as well as all those intermarket relationships, and then updating the forecast so that traders can make those adjustments and really understand where those ideal spots are to go ahead and accumulate a position.
So ending up here, Madison Square Garden Corporation now up, let’s see, about 16, almost 17%, just in the past 23 trading days. And of course, numerous opportunities there to be adding to that position and utilizing this uptrend to the bullish side here.
So we’ll go ahead and leave it there for today. Once again, this has been our Hot Stocks Outlook for June 12th, 2026. Thank you all for watching. Best of luck out there, and bye for now.