


| This week’s a.i. Stock Spotlight is Agnico Eagle Mines ($AEM) |
Agnico Eagle Mines Limited ($AEM), a senior player in the gold mining sector, was born from the 1972 merger of Agnico Mines Limited and Eagle Gold Mines Limited, drawing its distinctive name from the elemental symbols for silver (Ag), nickel (Ni), and cobalt (Co). Embarking on its gold production journey with the first gold pour in 1974 at the LaRonde mine in Quebec, Agnico Eagle has since expanded its operational footprint across Canada, Mexico, Finland, and Australia, showcasing a robust international presence. Notably, the company has consistently achieved record gold production numbers, with 2019 marking its highest annual gold output, underscoring its operational excellence and growth trajectory.
Agnico Eagle’s revenue generation is primarily anchored in the extraction and sale of gold, augmented by by-products such as silver, zinc, and copper.
Through innovative mining practices, including the adoption of automation and remote operation technologies, the company has enhanced safety and efficiency. Strategic acquisitions, such as the Canadian Malartic mine in partnership with Yamana Gold in 2014, have bolstered its production capabilities. Additionally, Agnico Eagle is recognized for its pioneering efforts in Arctic mining, with the Meadowbank complex in Nunavut standing as one of the world’s northernmost mines. This dedication to innovation, sustainability, and community partnership underscores Agnico Eagle Mines’ role as a leader in the global gold mining industry.
Headquartered in Toronto, Canada, Agnico Eagle Mines has navigated through the volatility of the mining sector to achieve profitability, demonstrating resilience and adaptability. The company boasts a market capitalization of $30.368 billion, reflecting its substantial size and influence within the gold mining industry. $AEM offers an annual dividend of $1.60, translating to a dividend yield of 2.61%, appealing to income-focused investors.
The landscape of competition in the gold mining sector is intensely competitive, with Agnico Eagle Mines vying against formidable adversaries such as Newmont Corporation and Barrick Gold Corporation. These competitors, each with their own strategic advantages, create a dynamic environment that continually challenges Agnico Eagle to innovate and excel.
The greatest opportunity for Agnico Eagle Mines lies in the global demand for gold, which serves as a hedge against inflation and currency devaluation. However, this opportunity is counterbalanced by inherent risks including geopolitical tensions, environmental regulations, and the volatile nature of gold prices. The company’s largest revenue generator remains its gold production, a testament to the enduring value of this precious metal.
Agnico Eagle Mines reported a solid performance in the fourth quarter of 2023, with record annual safety performance, annual gold production, and free cash flow. The company produced 3,439,654 ounces of gold in 2023 at total cash costs per ounce of $865 and all-in sustaining costs (AISC) per ounce of $1,179, indicating strong operational efficiency and cost management. In 2022, Agnico Eagle Mines also reported strong performance with payable gold production of 3,135,007 ounces at total cash costs per ounce of $793 and AISC per ounce of $1,109. The growth in gold mineral reserves and the acquisition of Yamana Gold’s Canadian assets underline the company’s strategic growth initiatives and resource expansion. $AEM forecasts stable payable gold production between 3.35 to 3.55 million ounces in 2024, with similar expectations stretching into 2026. Total cash costs per ounce and AISC per ounce for 2024 are expected to slightly increase due to inflation and operational expansions. Capital expenditures for 2024 are forecasted to be approximately $1.65 billion.
These profit margins are huge and among the largest of gold miners. Should gold continue to rally it bodes extremely well for the balance sheet of $AEM.
The company reported a trailing PE ratio of 15.52 and a forward PE ratio of 27.88, suggesting expectations of future growth. Agnico Eagle Mines achieved a net income of $1.94 billion over the last 12 months, with earnings per share (EPS) at $3.95.
Over the past decade, Agnico Eagle has strategically expanded its portfolio through acquisitions, enhancing its production capabilities and geographical reach. This expansion strategy has been a critical element of its growth narrative, allowing it to mitigate risks associated with operational and regional concentration.
Agnico Eagle Mines Limited presents a compelling case for investors focused on long-term value creation, especially those looking to diversify into precious metals. The company’s operational efficiency, strategic growth initiatives, and strong financial performance are key attributes. The next earnings call for $AEM is April 25, 2024. Analysts will be paying very close attention to $AEM’s gold production metrics and forecasts for the coming 12 months. With huge profit margins it is fair to say that earnings will continue to be a key driver for the stock moving forward.
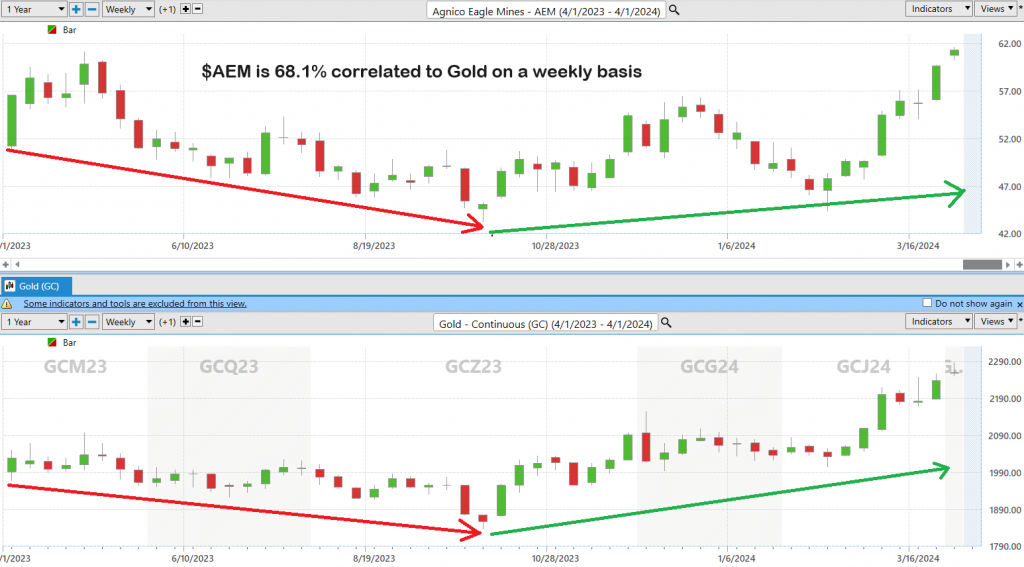
When we perform a correlation analysis to Gold, we can see that there is a meaningful correlation of 68% on the weekly charts over the past year.
In this stock study we will look at the following metrics and indicators.
1) Wall Street Analysts’ Estimates
2) 52-week high and low boundaries
3) Vantagepoint A.I. Predictive Blue Line Analysis
4) The Best Case – Worst Case Scenarios
5) Neural Network Forecast
6) Daily Range Forecast
7) Intermarket Analysis
8) Our trading suggestion
We don’t base decisions on things like earnings or fundamental cash flow valuations. However, we do look at them to better understand the financial landscape that a company is operating under.
Wall Street Analysts’ Estimates
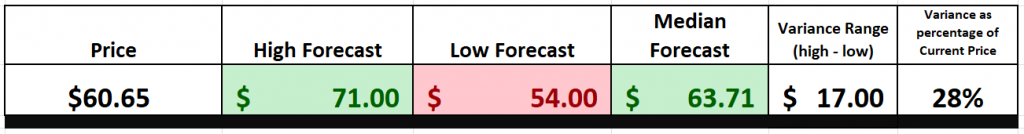
According to the issued ratings of 8 analysts in the last year, the average twelve-month price prediction for Agnico Eagle Mines is $63.71 with a high price target of $71.00 and a low price target of $54.00. The most recent closing stock price is $60.65. Agnico Eagle Mines has been rated by CIBC, Jefferies Financial Group, National Bank Financial, Raymond James, and TD Securities in the past 90 days.
We pay close attention to the variance between the most bullish and most bearish estimates as it is often a precursor of expected volatility. Currently this variance is 28% of the current price. This means that statistically speaking it would be perfectly normal to expect $AEM to trade 28% higher and or lower over the coming 12 months.
52-Week High and Low Boundaries
We always advise that traders pay attention to a stocks 52-week boundaries. These levels act as a report card on a stock, particularly when focused over the past year and compared to the broader market.
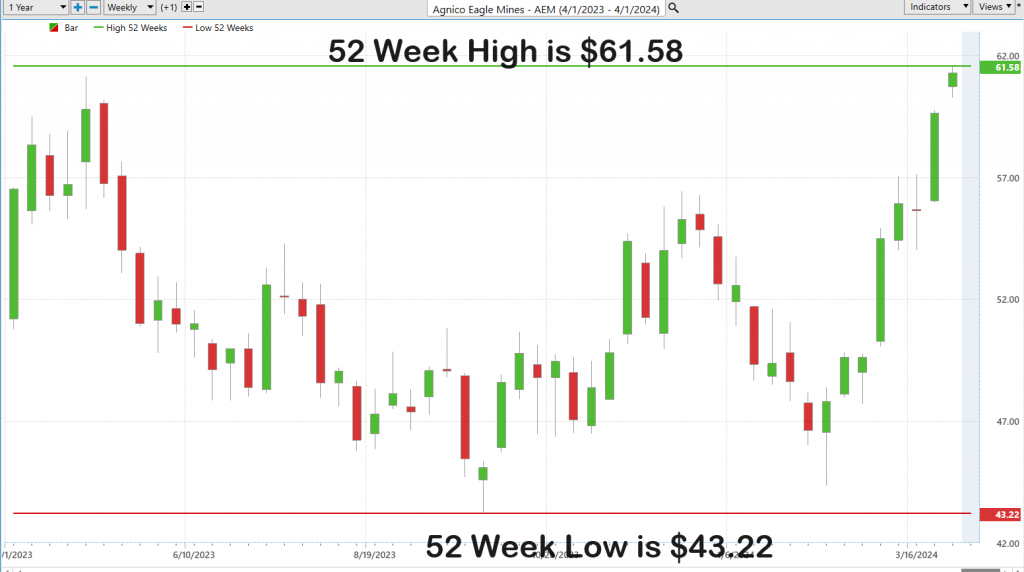
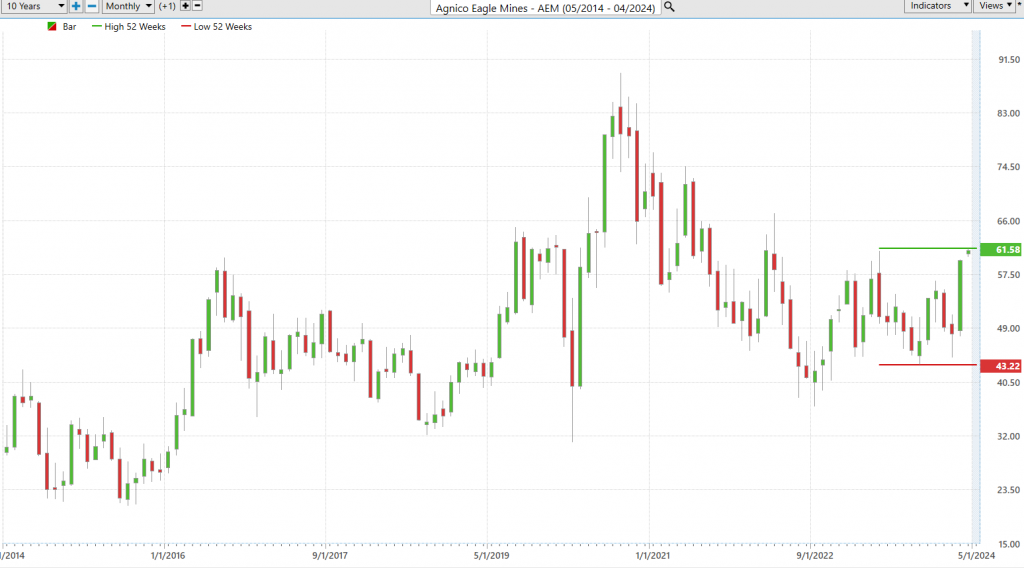
Over the past 52 weeks $AEM has traded as high as $61.79 and as low as $43.22.
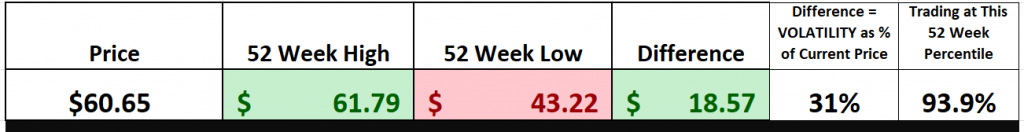
The annual trading range was 18.57 or 31% of the current price. The Stock is trading at its 93rd percentile of the last 52 weeks.
The 52-week thresholds of a stock stand as the Colosseum of the trading world, a grand arena where the titans of psychology and strategy clash. These markers are far more than mere numbers; they are the pulse of the market, the very heartbeat of investor sentiment, and a beacon for those navigating the turbulent seas of stock trading. Let me elucidate why these metrics are the linchpins of the trading strategy.
Firstly, consider the psychological warfare at play. The 52-week high and low serve as the battlegrounds of confidence and fear. Breaching these thresholds is akin to crossing the Rubicon. When a stock ascends beyond its 52-week zenith, it’s not merely scaling a numerical peak; it’s hoisting the flag of investor optimism, signaling a windfall for bullish investors. On the flip side, slipping below the 52-week nadir can send a shiver down the market’s spine, heralding a bearish descent into the shadows of skepticism.
Now, let’s delve into the narrative of trend analysis. Sustaining positions above the 52-week pinnacle isn’t just about staying afloat; it’s about riding the crest of a bullish wave, signaling a stock’s triumphant march into uncharted territories. This isn’t merely market favoritism; it’s an endorsement of the stock’s success, enticing legions of investors to join the fray.
And what of momentum, you ask? A stock repeatedly etching new 52-week highs is not merely on a streak; it’s on a veritable crusade, its banner unfurled and carried forward by the winds of increased trading volume. This is no whisper in the corridors of commerce; it’s a clarion call, rallying investors to its cause, each new high fueling the flames of optimism and an upward trajectory.
But the pièce de résistance, my friends, is the setting of new benchmarks and goals. These are not mere digits on a ledger; they are the stock market’s version of landing on the moon. Each new high is a testament to pushing the envelope of what’s possible. In this arena, perception is reality, and achieving new 52-week highs transforms a stock, such as $AEM, into a veritable beacon of bullish optimism, a lodestar guiding the bulls to dance jubilantly in the streets, leaving the bears to slumber in their dens.
This is the essence of the 52-week metrics—a tale of psychological warfare, trendsetting narratives, unstoppable momentum, and the setting of new frontiers. In the grand tapestry of the stock market, these are the threads that weave the epic saga of triumph and challenge, casting stocks like $AEM in roles of heroes and legends in the making. It’s a narrative of bullish rewrites and rallying cries, where new peaks are not just achieved but conquered, heralding an era where traders chase glory beyond the numbers, in the eternal quest for the next summit.
We can also get a very objective view of the long-term trend by zooming out to the 10-year chart. Doing so provides a quick visual of how the last 52 weeks has compared to the last decade.
Best Case – Worst Case Scenario
As we consider the indispensable tools for every discerning investor and trader, it becomes evident that a nuanced understanding of risk and reward is essential. Though one may encounter various sophisticated methodologies, let’s focus on a clear-cut technique known as the “Best Case – Worst Case Scenario” analysis. This pragmatic approach entails evaluating the most optimistic and pessimistic market scenarios over the previous year and plotting these outcomes on a chart.
By charting the market’s rallies and declines—akin to charting the crests and troughs of a stormy sea—we unveil a potent strategy for navigating the complex dynamics of risk and reward. This method allows us to distinguish between periods of market euphoria and downturns, offering a lucid perspective on the inherent risks, rewards, and volatility.
This is not mere speculation; it’s a disciplined approach to market analysis. By examining both the peaks and valleys of market performance, we gain a holistic view of a stock’s potential, integrating an appreciation for potential gains with a sober understanding of the risks involved. This strategy illuminates the path through the market’s unpredictability, shedding light on the core dynamics of asset valuation.
Therefore, it is essential not to gloss over these analytical charts but to deeply understand their significance. This approach is more than tactical—it’s a strategic foundation that empowers informed decision-making, risk management, and the crafting of a robust investment strategy that adeptly navigates between risk and reward. The forthcoming charts will prove invaluable in decoding the intricacies of market volatility.
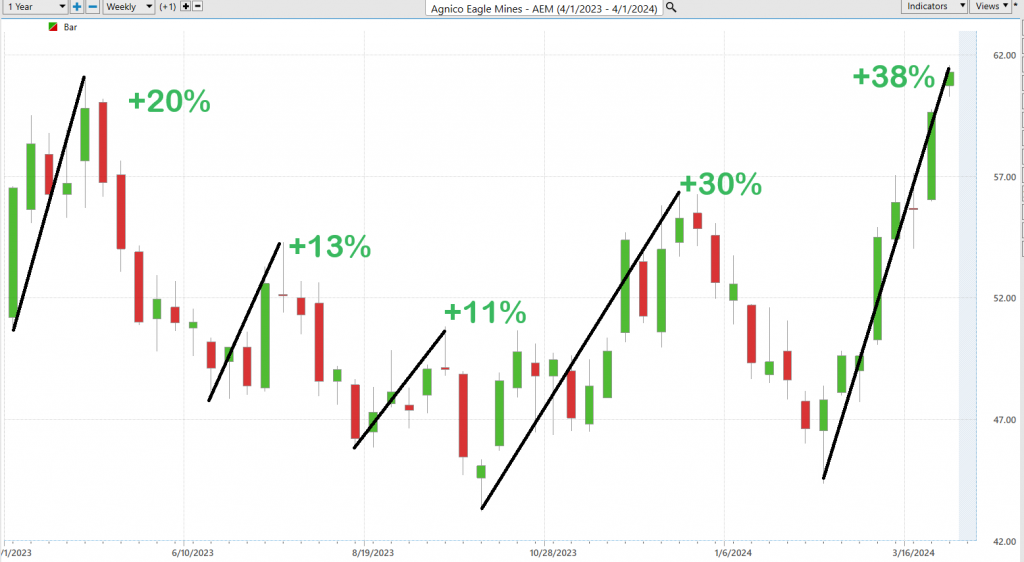
Let’s now apply this analytical lens to Agnico Eagle Mines ($AEM), beginning with a best-case and then a worst-case scenario analysis. Through this examination, we quickly identify the past year’s rewards and risks associated with $AEM.
First the best-case analysis:
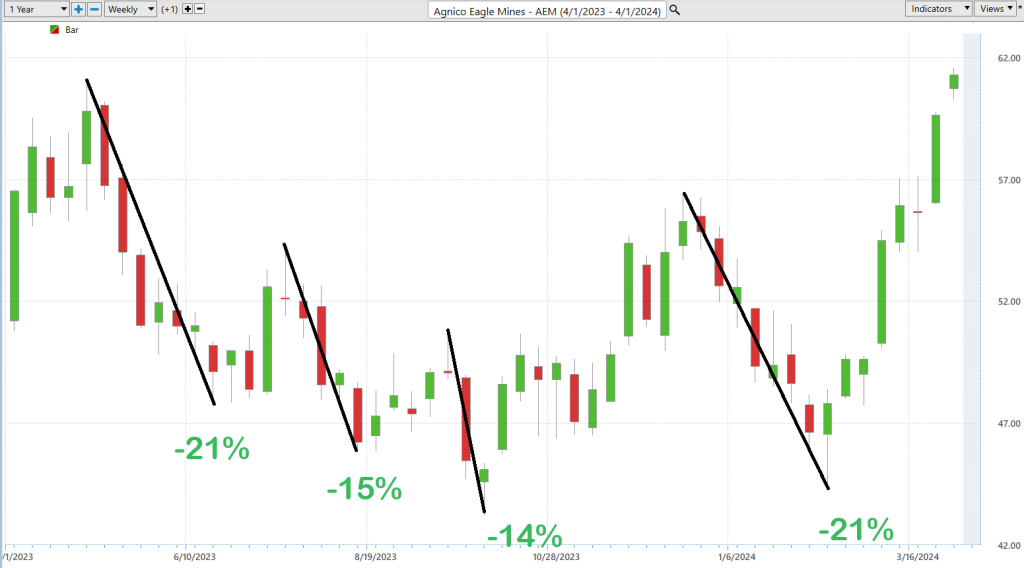
Followed by the worst-case analysis:
Moving forward, a comparative analysis of $AEM against broader market indices is crucial. This comparison not only highlights where $AEM has outperformed or underperformed in relation to the broader market.
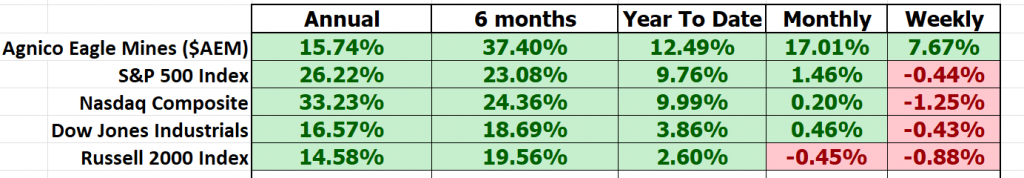
We can see that $AEM is lagging on the annual performance compared to the broader market, but on all other time frames it has outperformed. This is what you would expect if you believed the recent breakout of Gold to all times highs on the chart was legitimate.
A critical component of this analysis involves assessing $AEM’s volatility relative to the broader market, through the lens of the beta coefficient. Beta is a measure of a stock’s volatility in relation to the overall market; a beta of 1 suggests that the stock moves in concert with the market, a beta above 1 indicates higher volatility, and a beta below 1 denotes lower volatility. Agnico Eagle Mines has demonstrated a beta of 1.03 over the past five years, indicating a volatility level that is 3% above the broader market average. This suggests that $AEM, while exhibiting similar volatility to the overall market, is beginning to surpass broader market indices in performance.Next, we compare $AEM to the top gold producers in the world to get an idea of how it is performing in its sector:
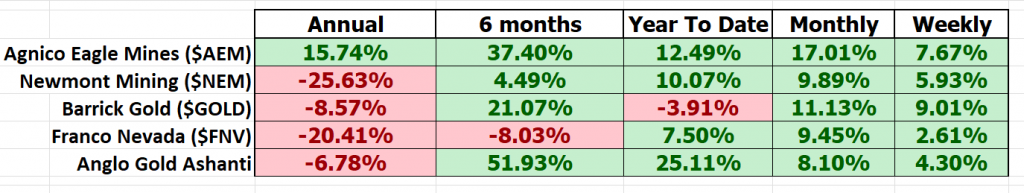
This simple and practical analysis demonstrates the leadership performance that $AEM has demonstrated over the past year. In sum, our disciplined approach to risk and reward analysis, grounded in the “Best Case – Worst Case Scenario” methodology, provides a solid foundation for evaluating Agnico Eagle Mines ($AEM) within the context of its market performance and volatility. This analytical framework is instrumental in navigating the investment landscape with confidence and precision.
VantagePoint A.I. Predictive Blue Line Analysis
Our guiding principles are as follows:
– The trajectory/slope of the predictive blue line dictates the trend forecast and overall trajectory of $AEM.
– Ideally, the VALUE ZONE is determined to seek buying opportunities at or below the predictive blue line or selling opportunities above it during a downtrend.
– Naturally, as the predictive blue line slopes downward, traders anticipate lower prices, either retreating to the sidelines or hedging their positions.
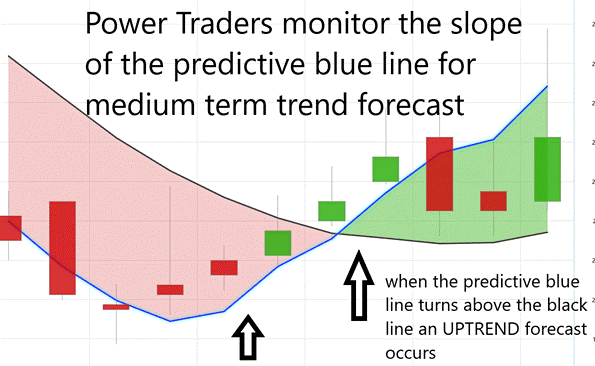
Through VantagePoint Software and its artificial intelligence, traders are apprised of trend forecasts by monitoring the slope of the predictive blue line.
As we navigate the ever-changing landscapes of the financial markets, the guiding star for investors, particularly when it comes to stocks like $AEM, is undoubtedly the predictive blue line. This isn’t just any indicator; it’s a powerful forecasting tool that sets the stage for understanding where the market is headed.
When we see that blue line taking a dip, it’s like the market whispering in our ears, telling us to brace for a potential price slide. Smart investors might take this as a cue to step back, reassess their strategies, or investigate hedging options to protect their investments.
Enter VantagePoint Software, armed with its artificial intelligence prowess. It’s not just any tool; it’s a beacon of insight, helping traders by shining a light on the market’s direction through the slope of that all-telling blue line.
In today’s fast-paced market environment, finding a reliable compass to guide you through the financial storms is crucial. VantagePoint Software emerges as a beacon, with its A.I.-driven insights offering a peek into the market’s soul. That predictive blue line? It’s your financial North Star, signaling bullish signals with its upward trajectory and alerting you to potential selloffs when it heads south.
But don’t be mistaken; this isn’t just guesswork. The predictive blue line represents the pinnacle of VantagePoint’s AI technology, merging neural networks with comprehensive intermarket analysis to dissect the very DNA of market movements and uncover the hidden value.
And let’s not forget the black line, our trusty sidekick, tracing the market’s recent steps like a detective following clues. It lays out the past performance, providing the perfect contrast to the predictive prowess of the blue line, and together, they unlock the market’s momentum, revealing opportunities that might otherwise stay hidden.
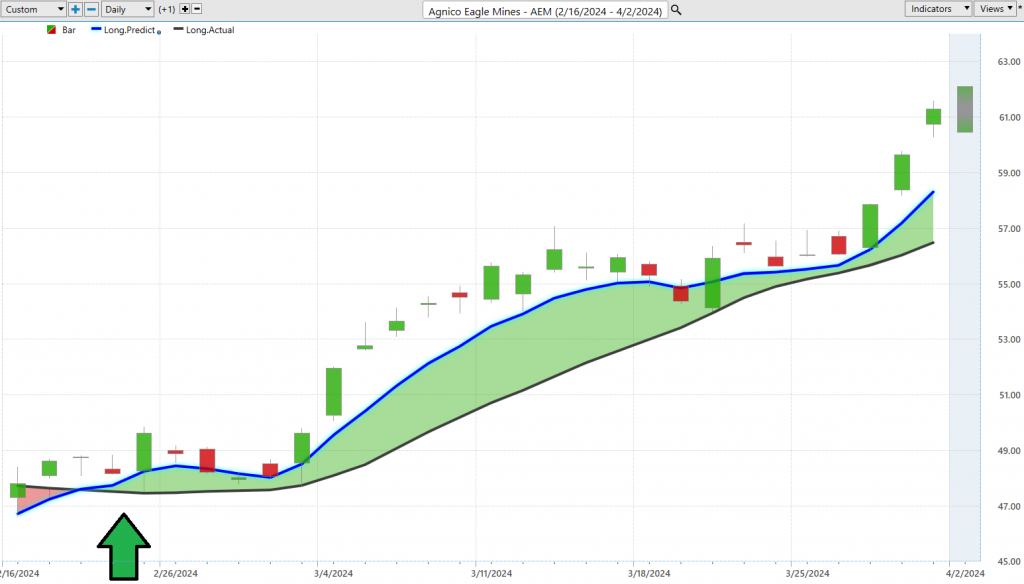
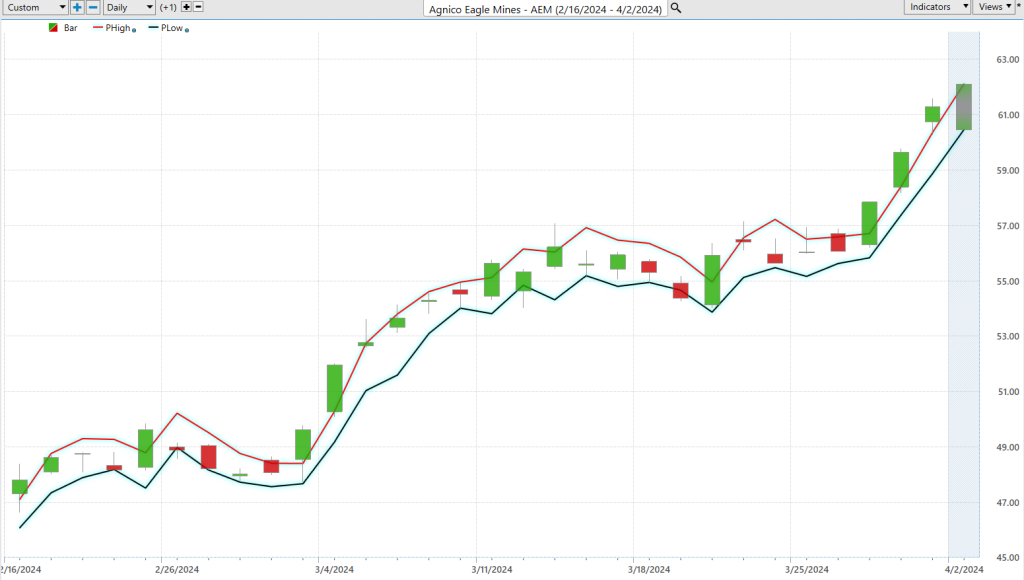
You can see the UP forecast was generated on February 21st at $48.82, and $AEM has rallied 26% since that time.
Neural Network Indicator (Machine Learning)
The Neural Network Indicator residing at the chart’s foundation emerges as a formidable predictive instrument. In a manner reminiscent of a weather forecast for market trends, this indicator has a green hue to herald strength and dons red to sound the alarm on weakness.
We’re talking about neural networks, a game-changer in the world of finance, inspired by the very essence of our human intellect. Imagine a vast web of neurons, not in the human brain, but constructed in the digital realm, each node a beacon of potential, all working in unison to decipher the complex language of the market.
This isn’t just any tech; it’s like having the power of the human brain at your fingertips, tirelessly analyzing mountains of market data, spotting trends, correlations, and even the subtlest of anomalies that might slip past the keenest of human traders. Picture this: a tool so adept at pattern recognition, it can foresee market movements, making the unpredictable seem all the more tangible.
But here’s the real kicker: neural networks are learning machines. They thrive on data, absorbing every bit of information, evolving with each piece of new data, making them especially formidable in the ever-changing theatre of the stock market.
Now, let’s bring this home to where it really impacts us—in the trenches of trading decisions. Think of neural networks as your ultimate risk mitigator, slicing through data with unparalleled efficiency and precision, far beyond human capability. With their knack for identifying even the most nuanced patterns, neural networks enable traders to pinpoint market movements with a finesse that’s simply not possible through traditional analysis. These networks don’t just keep pace; they lead, uncovering emerging trends and signals in the blink of an eye, giving traders the upper hand in a world where timing is everything.
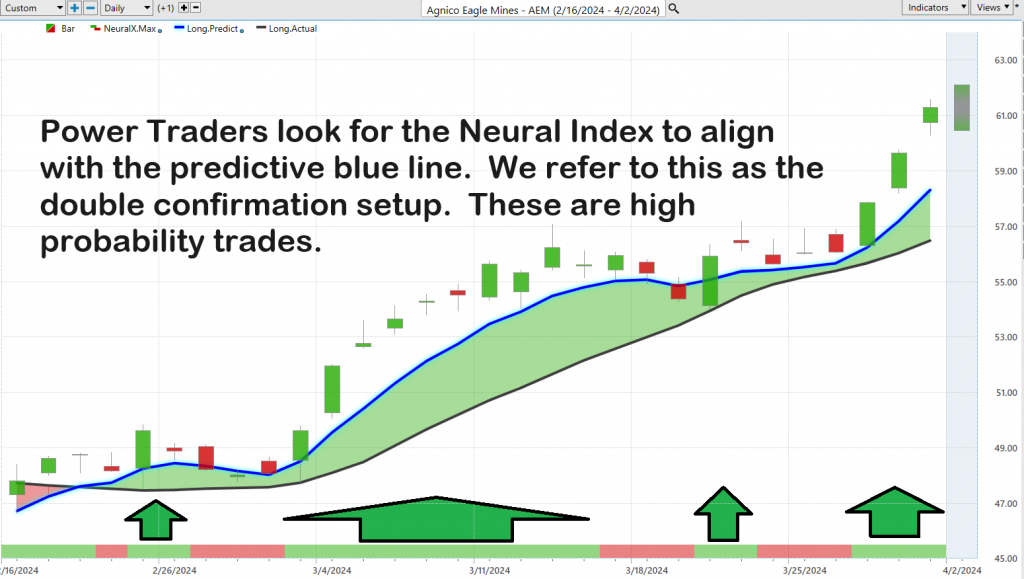
The arrows on the chart above are the moments when the predictive blue line and the neural index were both forecasting the same direction for $AEM.
This fusion of technology and finance mirrors the complexity of the human mind, constantly evolving, constantly learning, offering a deep dive into the market’s psyche. It’s a dynamic force, pushing the boundaries of predictive accuracy by sifting through data on an unprecedented scale.
With the Vantagepoint A.I. Neural Index Indicator in their arsenal, our Power Traders engage in a dance of data and foresight, aligning the predictive blue line with insights gleaned from the neural network. It’s a symphony of precision and prediction, where the concord between the Predictive Blue Line and the Neural Net not only signals an opportunity but carves out a high-probability pathway to trading success.
In this digital age, the chart of $AEM isn’t just a graph; it’s a narrative of technology’s triumph over uncertainty. The Neural Network Indicator, paired with the Triple Cross, lays out a roadmap for our Power Traders, marking those pivotal moments of ‘double confirmation,’ where precision and opportunity converge in the dynamic landscape of market dynamics.
VantagePoint A.I. Daily Range Forecast
In the whirlwind world of trading, where every tick and tock of the clock can spell difference between profit and loss, traders are increasingly leaning on the most sophisticated allies in the digital realm: Artificial Intelligence (AI), machine learning, and neural networks. Picture this: these aren’t just tools, they’re the ace up the sleeve, dissecting mountains of historical market data to unveil patterns, trends, and the hidden threads that tie market movements together.
With machine learning’s keen eye for pattern recognition and neural networks’ prowess in predictive modeling, traders are equipped to see beyond the horizon, forecasting future price swings with a clarity that was once deemed impossible. And it’s not just about having a crystal ball; it’s about having a crystal ball that updates in real time, enabling traders to pivot with the market’s every mood swing, all while keeping a tight grip on risk management and sharpening their decision-making.
Now, let’s zoom in on Agnico Eagle Mines ($AEM), a beacon in the stormy seas of the stock market. Take a moment to marvel at the ebb and flow of its average trading ranges—daily, weekly, monthly.
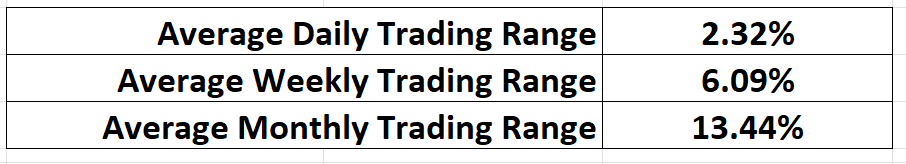
It’s like watching the market’s pulse, a rhythm of volatility that dances to the beat of global economic shifts. But hold on, because here’s where the rubber meets the road: understanding these ranges is just the tip of the iceberg. The real art, the true skill lies in pinpointing those golden moments to jump in and jump out, seizing the opportunities that these ranges reveal.
Imagine standing at the edge of a vast ocean of data, with AI, machine learning, and neural networks as your navigational tools, charting a course through the choppy waters of the market to find those elusive sweet spots. It’s in these moments, with the right technology in hand, that traders can transform insight into action, turning the complexities of the market into opportunities for growth.
In essence, AI-driven tools aren’t just changing the game; they’re redefining it, offering traders the competitive edge needed to thrive in the dynamic tapestry of the financial markets. It’s about having the vision to see beyond the immediate, to uncover opportunities hidden within the waves of data, and to make decisions with precision and confidence.
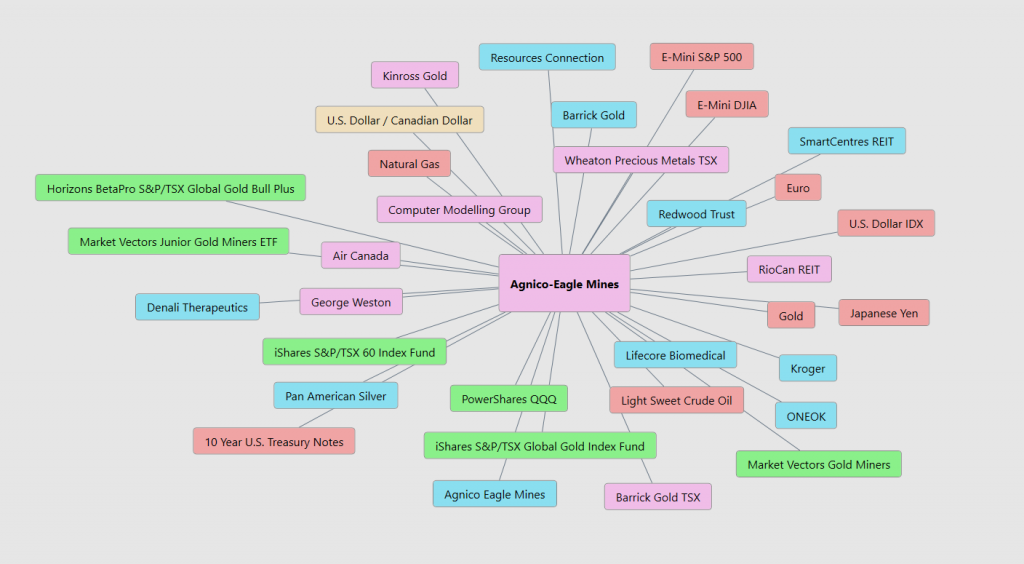
VantagePoint’s A.I. Intermarket Analysis
Intermarket analysis is like being at the center of a vast web, where each thread represents a different financial market. Picture stocks, bonds, commodities, and currencies, each moving in its unique rhythm, yet all connected in a complex dance. For new traders, understanding this interconnectedness is key to unlocking deeper insights into market movements and making informed trading decisions.
What is involved in intermarket analysis? It’s about observing how these different markets interact with and influence each other. For example, a rise in oil prices (a commodity) might lead to higher inflation expectations, which could affect interest rates and, consequently, bond yields. This, in turn, might impact stock market performance, especially sectors sensitive to oil prices or interest rates. Similarly, currency strength can influence commodity prices and thus affect related stocks and sectors. By analyzing these relationships, traders can identify underlying trends and potential market shifts before they become apparent through traditional analysis.
How does it improve a trader’s decision-making process? Intermarket analysis offers traders a 360-degree view of the financial markets. By understanding how different markets influence each other, traders can anticipate movements in one market based on changes in another. This holistic approach allows for better risk management and the identification of new trading opportunities that might not be visible through the lens of a single market.
Who developed intermarket analysis? The concept has been around for decades, but it was popularized in the late 20th century by John J. Murphy, a former technical analyst for CNBC and author of several key texts on the subject, including “Intermarket Analysis: Profiting from Global Market Relationships.” Murphy’s work laid the groundwork for using technical analysis to examine the interplay between equities, bonds, commodities, and currencies, helping traders to better predict market directions. Intermarket Analysis was further developed by the founder of VantagePoint A.I., Lou Mendelsohn, who refined the ability for traders to do intermarket analysis in the suite of VantagePoint Software.
Why is it important? In today’s globalized economy, markets are more interconnected than ever. Events in one part of the world can ripple through the financial system, affecting markets across the globe. Intermarket analysis is crucial because it helps traders understand these complex relationships, allowing them to navigate the markets more effectively. It’s not just about knowing what’s happening in one market but understanding how it fits into the broader financial ecosystem. This comprehensive approach can lead to more strategic trading decisions, better risk management, and the potential for higher returns.
For new traders, embracing intermarket analysis means stepping beyond the confines of single-market focus and adopting a more integrated perspective on global financial dynamics. It’s about seeing the bigger picture and positioning oneself to respond proactively to changes, not just in one market, but across the financial landscape.
Our Suggestion
In conclusion, investing in gold mining is a strategic maneuver, particularly when gold prices are on an upward trajectory on the charts and when the specter of inflation looms on the horizon. Such conditions often herald a period where the intrinsic value of gold and, by extension, gold mining companies, is poised for appreciation. This anticipation of higher inflation tends to drive investors towards gold as a historical hedge against the eroding value of fiat currencies. Consequently, gold mining stocks become an attractive avenue not just for direct exposure to the price movements of gold but also as a leveraged play on gold’s value.
$AEM is pulling GOLD out of the ground at a price of $1179 which offers tremendous profits margins with gold trading at $2250 per ounce. $AEM also is forecasting being able to extract in excess of 3.5 million ounces in 2024 and 2025. The next earnings call on April 25th will shed more light on these important metrics.
As gold prices climb, the profitability and, therefore, the stock prices of these mining companies can increase at a faster rate than the metal itself. Thus, for those looking to capitalize on the dual forces of gold’s breakout and inflationary pressures, allocating a portion of one’s investment portfolio to gold mining stocks could offer a potent blend of growth potential and risk mitigation.
We advise that you practice good money management on all of your trades and follow the A.I. daily range forecast for guidance on positioning on this great stock. $AEM has broken 52-week highs recently and is poised to challenge the 10-year highs over the coming months.
Let’s Be Careful Out There!
Remember, It’s Not Magic.
It’s Machine Learning.
Disclaimer: THERE IS A HIGH DEGREE OF RISK INVOLVED IN TRADING. IT IS NOT PRUDENT OR ADVISABLE TO MAKE TRADING DECISIONS THAT ARE BEYOND YOUR FINANCIAL MEANS OR INVOLVE TRADING CAPITAL THAT YOU ARE NOT WILLING AND CAPABLE OF LOSING.
VANTAGEPOINT’S MARKETING CAMPAIGNS, OF ANY KIND, DO NOT CONSTITUTE TRADING ADVICE OR AN ENDORSEMENT OR RECOMMENDATION BY VANTAGEPOINT AI OR ANY ASSOCIATED AFFILIATES OF ANY TRADING METHODS, PROGRAMS, SYSTEMS OR ROUTINES. VANTAGEPOINT’S PERSONNEL ARE NOT LICENSED BROKERS OR ADVISORS AND DO NOT OFFER TRADING ADVICE.


