


| This week’s a.i. Stock Spotlight is Boeing ($BA) |
Founded in 1916, Boeing Corporation ($BA) is an iconic American aerospace company created by William Edward Boeing in Seattle, Washington. The company continues to be a leader in the world of commercial aircraft and defense, space, and security systems. They design, develop, manufacture, and support a wide range of products including commercial and military aircraft, satellites, weapons systems and more. In terms of their competitors, they go up against Airbus SE as well as smaller companies such as Bell Inc., GE Aviation and Pratt & Whitney. Airbus, of Europe, is widely considered to be Boeing’s closest rival, having supplanted the traditional American giant as the world’s leading aircraft manufacturer. Other companies such as Bombardier and Embraer are gaining share in areas such as commercial aircraft, business aviation and defense sectors worldwide. However, Boeing remains a household name when it comes to top-tier aircraft manufacturing with civilian and military applications alike. Despite other competitors making strides in recent years, none have been able to stop Boeing from achieving success by a comfortable margin.
Boeing’s reach extends far beyond U.S. borders. The company is a major exporter, often ranking as one of the largest in the United States. Its aircraft are a ubiquitous presence in the skies, serving as symbols of American aviation prowess worldwide. Few companies can match Boeing’s global footprint, and its ability to connect people, goods, and cultures is a testament to its immense impact on international travel and commerce. Boeing’s historical contributions to aerospace are remarkable. The development of iconic aircraft like the Boeing 747, the world’s first wide-body airliner, and its pivotal role in the Apollo moon missions underscore its pioneering spirit. Boeing’s Lunar Rovers, integral to NASA’s lunar exploration, showcase the company’s versatility and willingness to tackle ambitious, groundbreaking projects. Boeing’s unique position lies in its dual focus on both commercial aviation and defense. While many aerospace companies specialize in one area, Boeing excels in both, maintaining a delicate balance between civilian and military markets. This duality provides resilience in times of economic fluctuations, as demand in one sector can offset challenges in the other.
In the aerospace realm, Boeing’s extensive portfolio of commercial aircraft, including the groundbreaking 787 Dreamliner and historic 737 series, has made it an integral part of global air travel. Its products connect people and businesses across continents, shaping the future of mobility.
Simultaneously, Boeing’s contributions to defense, with aircraft such as the F-15 and AH-64 Apache, play a critical role in safeguarding national security. The company’s involvement in space exploration, including partnerships with NASA, demonstrates its commitment to advancing the boundaries of human knowledge and capability.
As for their business model, Boeing earns revenue from its client base across four key businesses: Commercial Airplanes; Defense, Space & Security; Global Services; and Boeing Capital Corporation (BCC).
Boeing ($BA) is one of the world’s largest aerospace companies, so it comes as no surprise that its workforce is particularly large. In fact, Boeing employs more than 160,000 people across 25 countries around the globe. The company’s history runs deep, with many iconic aircraft being designed and produced over the years – so having a team that reflects their impressive level of expertise is a must. With such a strong presence in global commercial aviation, defense and space and security markets, as well as over 10 decades’ experience under its belt, Boeing will surely continue to be an integral part of the industry for many years to come.
It is also important to note that being part of the Dow Jones Industrial Average since March 2014 speaks highly about the company’s financial standing within the stock market industry.
In recent years, Boeing has made strategic acquisitions to expand its portfolio. Notable acquisitions include Aurora Flight Sciences and KLX Inc. These acquisitions have aimed to enhance Boeing’s capabilities in areas like autonomous flight and aerospace parts distribution.
There are three key reasons why Boeing is looking to finish 2024 in a stronger position than it did in 2023:
First up, Boeing is revving up its delivery rates for its crucial commercial aircraft programs, like the 737 MAX and the 787 Dreamliner. And this isn’t just a one-time boost; they’re planning to keep that rate climbing throughout 2024.
Secondly, the headaches in the defense industry’s supply chain seem to be easing, and Boeing is on track to hit some critical milestones on its fixed-price defense programs in the coming year. That’s a big deal, given the struggles they’ve faced in this department.
And thirdly, Boeing’s management has its sights set on generating between $3 billion to $5 billion in free cash flow (FCF) by the end of 1st quarter 2024. But it doesn’t stop there; they’re eyeing FCF growth in 2024 as they march toward a whopping $10 billion in FCF between 2025 and 2026.
So, it seems like Boeing is all set to make some substantial strides in 2024.
But the million-dollar question remains: Will these strides be enough to make Boeing’s stock an attractive buy? As of now, Boeing’s market cap stands at a hefty $159.4 billion.
For years, Boeing had experienced massive success with its 737 family of planes. However, when the company released the 737 MAX in 2017, it faced a series of unprecedented issues. As reported by The New York Times, pilots found that the new plane tended to point its nose sharply downwards during flight; this was linked to faulty sensors that incorrectly detected the plane’s angle and triggered an automated safety system. In order to address these issues, Boeing recalled hundreds of MAX airplanes and issued multiple software updates to resolve the false readings given by the sensors. Additionally, they stepped up their training protocols, so pilots knew how to override the automation if necessary. Though controversial, as no crashes involving MAX planes were directly linked to this issue, Boeing has since implemented several changes to ensure passenger safety and reestablish trust in their products. This problem has weighed heavily on $BA’s stock price but it appears that management, having worked diligently to address this issue has successfully put all concerns with the 737 MAX in the distant rear-view mirror.
As the largest aerospace manufacturer in the world, it’s no surprise that competitive and economic pressures are some of the biggest issues Boeing must face as a business. Most notably, continuing struggles in production and delivery of the troubled 737 MAX airplane have caused a massive drag on profits for several quarters. This, combined with an overall uncertain operation environment due to high levels of geopolitical volatility, has led to high costs across several areas of operation. Additionally, increasing public scrutiny on ethical lapses and safety concerns can pose serious long-term threats to their current success. All these factors together create a challenging situation for Boeing executives to navigate in order to ensure maximum efficiency and profitability going forward.
Lastly, although Boeing is poised to reach pivotal milestones in its fixed-price defense programs during 2024, the defense division has been ensnared in a quagmire of supply chain hiccups, labor strife, cost overruns, and associated charges. Now, mark your calendars for January 25, 2024, because that’s when Boeing’s set to reveal its Q4 results. Wall Street seems hopeful, with recent price action pointing towards better financial times ahead. But let’s not forget, Boeing’s been in the red since the pandemic hit in 2020. It’s a head-scratcher, considering they rake in billions from U.S. government contracts. But make no mistake, Boeing’s been in a tough spot, with losses piling up over the past five years.
In the end, Boeing’s a company with a storied past and a future that’s still taking shape. Keep an eye on them, folks. They’ve weathered storms before, and they might just soar even higher in the years to come.
- Wall Street Analysts Estimates
- 52 week High and Low Boundaries
- Best Case-Worst Case Analysis
- Vantagepoint A.I. Forecast (Predictive Blue Line)
- Neural Network Forecast
- Daily Range Forecast
- Intermarket Analysis
- Our trading suggestion
We don’t base our trading decisions on things like earnings or fundamental cash flow valuations. However, we do look at them to better understand the financial landscape that a company is operating under.
Wall Street Analysts’ Estimates
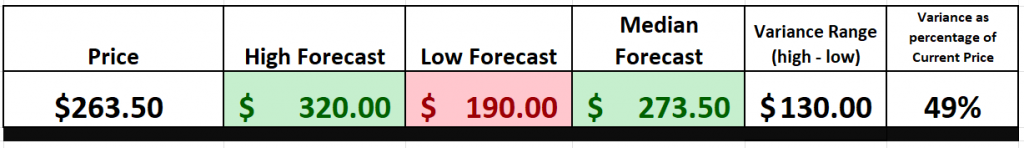
Based on 21 Wall Street analysts offering 12-month price targets for Boeing in the last 3 months. The average price target is $265.05 with a high forecast of $320.00 and a low forecast of $217.00. The average price target represents a 0.58% change from the last price of $263.51.
We look at the Wall Street Analysts primarily to understand the diversity of opinion that exists now. When we look at the most bearish forecast and then compare it to the most bullish forecast, we can see that the variance of opinion represents 40% of the current price. This ingredient is the main catalyst of volatility, so we monitor it closely.
52-week High-Low Chart
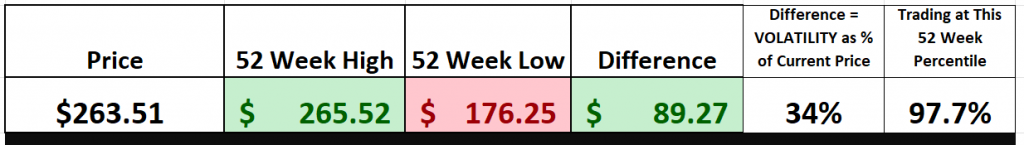
We are big on tracking where a stock stands in its 52-week journey. We believe that the real winners keep hitting those new 52-week highs, and that’s where we want to hitch our wagon. We’re talking about paying serious attention to how a stock dances within the boundaries of its 52-week high and low.
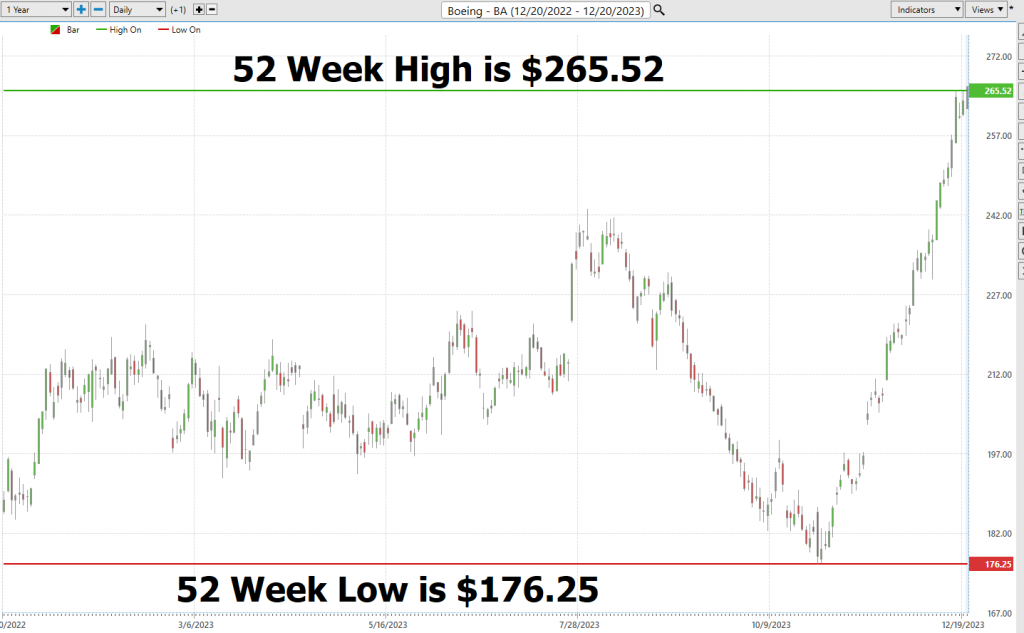
Now, let’s get into the practical details. Over the last year, $BA has seen its share of highs and lows. It soared as high as $265.52 and dipped as low as $176.25. But here’s the kicker: at its most recent close, it clocked in at $263.51. Right now, it’s trading at its 87.7th percentile when we look at that annual range.
Look at the chart and see how in the last 8 weeks it has moved from its 52-week low to its 52-week high. That type of move tells you there has been some serious accumulation of $BA after it made its recent low.
Based upon the high and low prices we can quickly see that the annual trading range of $BA is $89.27. What we also like to do is calculate the statistical volatility to get a realistic view of risk. To do this we simply divide the current price of $263.51 by the annual trading range. This tells us that the annualized statistical volatility is 34%. Volatility can be an informative metric for stock analysis, as it’s the measure of the amount of fluctuation in a security’s price over time. A high statistical volatility tells us that the stock’s price has been highly variable in past periods, which might indicate greater potential returns in the near future. Moving forward, it is important to make sure that any potential trading opportunity is examined thoroughly before committing capital. With an understanding of what high volatility in stocks can tell us, we can proceed with more confidence and insight when making our decisions.
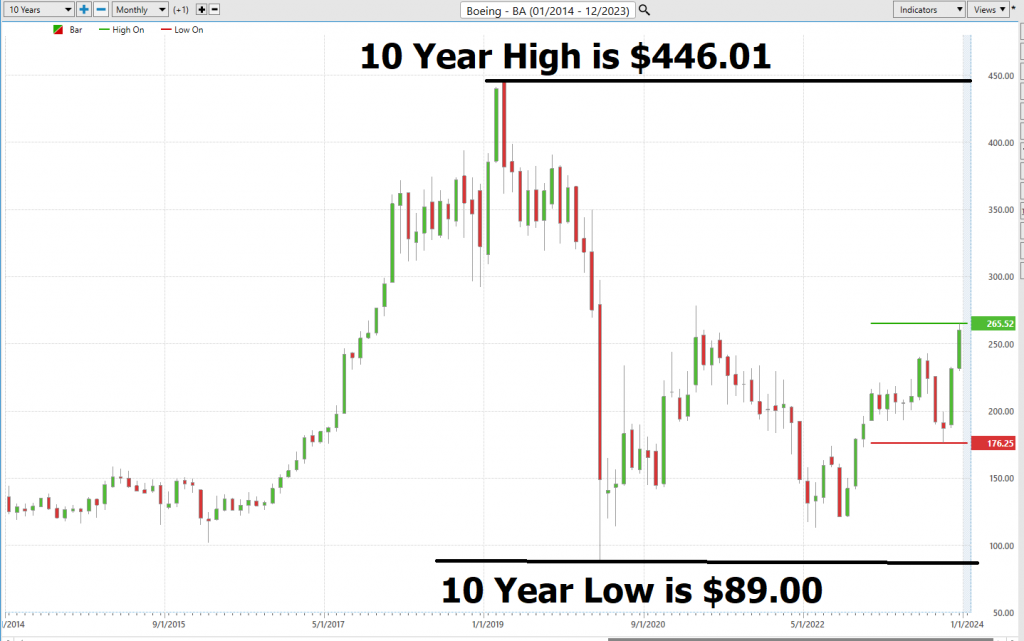
When we zoom out to the longer-term charts for $BA we can see that $BA is still trading well below the annual range of 2018/2019 which is right after when its problems the 737 MAX mechanical issues began.
Best Case – Worst Case Scenarios
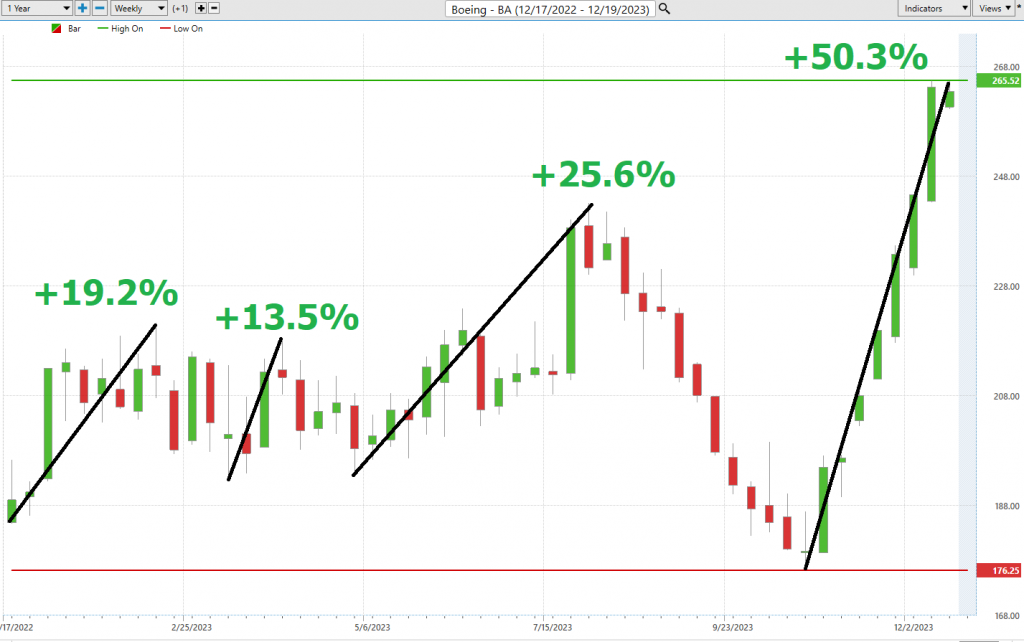
Now, let’s shift our focus to the past year and dig into the ebbs and flows. We’re talking about sizing up those rallies and decline. You see, by connecting a line from a recent low to a recent high, we can get a clear picture of the risks that come with trading or investing in $BA. In other words, we can get a clean perspective of the best case and worst-case scenarios.
Here is the Best-Case analysis:
Followed by the Worst-Case Analysis:
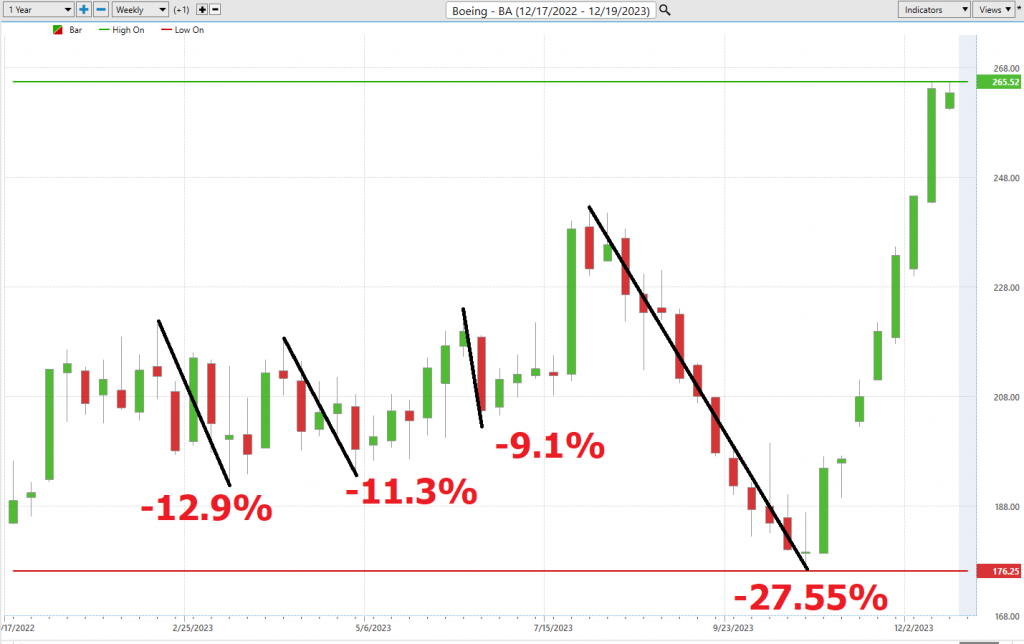
What’s the big takeaway here? This straightforward view gives us a peek into the wild ride that is trading $BA. I mean, over the past year, this stock has been a rollercoaster, and I’m not talking about a kiddie ride! This kind of action, my friends, spells out an open invitation for swing traders hunting for those short-term trends. There’s no denying it, the volatility here is where the actions at.
But we’re not done yet, not by a long shot. We need to put $BA under the microscope and see how it measures up against the broader market. It’s like comparing apples to oranges, folks, and that’s where the real insights come in. We’re talking about getting the full picture here.
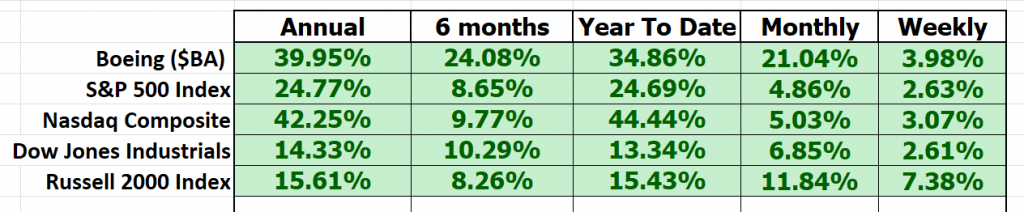
We’ve got a real standout in the market here with $BA. This stock has consistently shone brighter than the broader market indices across every time frame you can think of. And do you know what? Its exceptional performance deserves a closer look, especially when it comes to volatility and comparing it to the big market heavyweights. And in the world of traders, we’ve got a nifty metric known as “BETA.”
Now, in the hustle and bustle of Wall Street’s trading floors, beta (β) is the kingpin, a financial barometer that’s like the Richter scale of the stock universe. It tells us how much a stock dances to the market’s rhythm, like a seismograph capturing market tremors. Beta quantifies a stock’s sensitivity to the market’s ups and downs, often compared against a major index like the S&P 500.
So, let’s break it down:
Beta = 1: Market’s Shadow
Think of a stock with a beta of 1 as the market’s shadow, mirroring every move with precision. The market surges 5%, this stock rises 5% right alongside, a testament to their seamless dance.
Beta > 1: Thrill Seekers’ Delight
Now, picture a high-speed rollercoaster, thrilling yet nerve-wracking with its ups and downs. A beta exceeding 1, say 1.5, sends the stock on a wild ride, 50% more turbulent than the market itself. Market goes up 5%, this high-beta stock takes off on a heart-pounding 7.5% ride, a roller coaster of emotions.
Beta < 1: A Calm Oasis
Imagine a serene meadow amidst the bustling market chaos. A beta below 1, like 0.5, brings a sense of tranquility. When the market enjoys a 5% ascent, this low-beta stock takes a leisurely 2.5% stroll, a peaceful walk in the park amidst the market’s turbulence.
Now, over the past 5 years, $BA exhibits a beta of 1.53, meaning it’s 53% more volatile than the broader stock market. Yet, despite that extra kick of volatility, it’s left both the S&P 500 trailing in the dust.
But folks, it’s vital to understand that beta isn’t some crystal ball that guarantees success. It’s a tool, a powerful one at that, used by investors to make informed decisions. It’s about balancing the promise of lucrative rewards against the inherent risks of the market.
But here’s the kicker: a high beta value, while promising those high returns, also brings the looming specter of significant losses. It’s a double-edged sword.
So, where does that leave you, the investor? It’s a choice, a crossroads if you will. Are you ready for the thrill of potential high gains with $BA, or are you looking for safer ground? This decision is crucial, and it’s deeply personal for every investor and trader out there.
But let’s not forget, beta, much like the Richter scale in seismology, remains a fundamental barometer in the stock market universe. It’s a measure that’ll continue shaping investment strategies and guiding decisions. Whether you’re a thrill-seeker or a safety-first investor, understanding and respecting the role of beta is essential as you navigate the often-turbulent waters of the stock market.
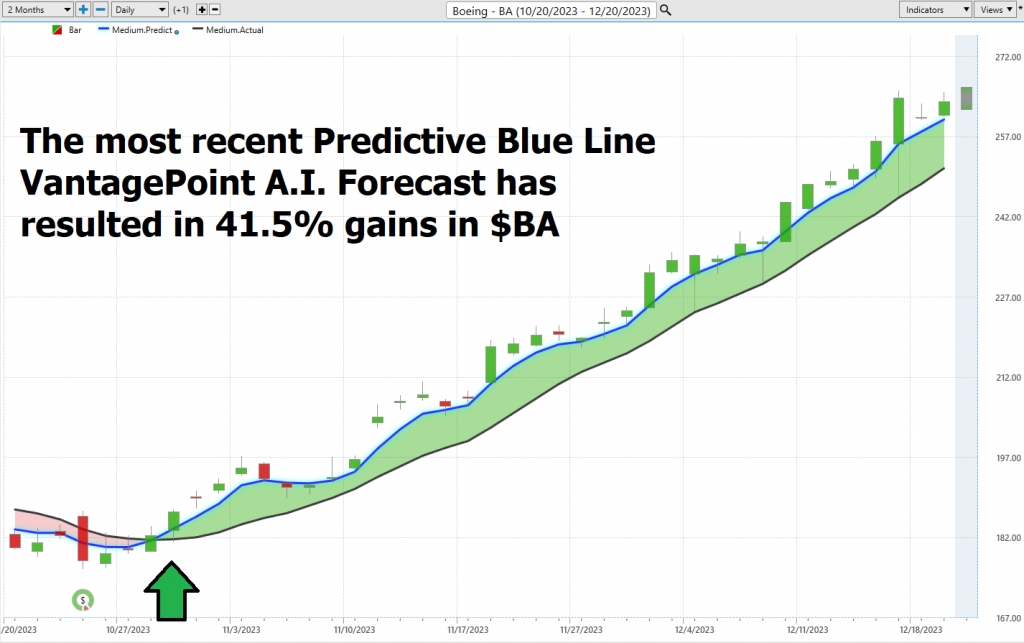
Vantagepoint A.I. Predictive Blue Line Forecast
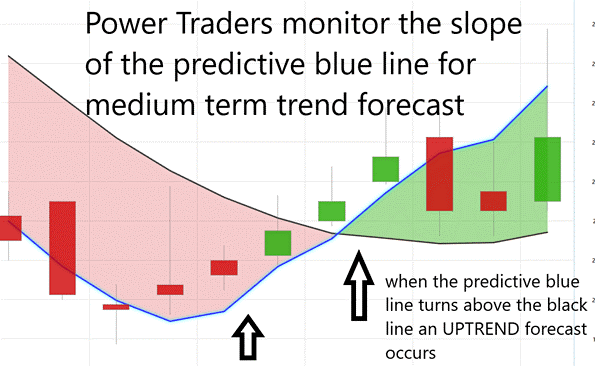
On the following chart, you will see the power of the VantagePoint Predictive blue line which determines the medium-term trend price forecast.
In the ever-evolving world of today’s market, traders are constantly searching for the most effective tools and strategies to help them navigate this intricate financial terrain. That’s where VantagePoint Software comes into play, a true pioneer in the field of artificial intelligence, offering traders a unique and precision-focused perspective on risk and reward analysis. At the heart of this innovation lies the predictive blue line, which serves as a guiding light for forecasting market trends.
Think of this predictive blue line as your financial lighthouse, its slope acting as a reliable indicator of market direction. When that line trends upward, it’s a clear signal of a rising market, pointing the way to smart buying opportunities. Conversely, when it slopes downward, it suggests a market on the decline, hinting at potential selling opportunities.
But there’s more to this story. The predictive blue line also highlights the ‘value zone’ – a strategic sweet spot for traders. In an uptrend, this zone, located just below the blue line, is where savvy investors look to make their moves. It represents a critical intersection of price and intrinsic value, revealing the true worth of an asset.
Now, don’t think of this predictive tool as a shot in the dark. It’s the result of VantagePoint’s groundbreaking A.I. technology, a harmonious fusion of neural networks and intermarket analysis. This potent combination dives deep, dissecting the key price drivers of an asset, leveraging A.I. to uncover its core value.
In addition to the predictive blue line, we also have the black line, a reflection of the recent past – essentially our market rearview mirror. It traces the 10-day moving average of prices, providing context to the blue line’s forward-looking insights. The interplay between these lines is where the magic happens, giving traders a clear view of market momentum and emerging opportunities.
Here’s a crucial takeaway for traders: when the predictive blue line crosses over the black line, consider it the market’s green light, signaling a prime entry point for an upward trend. This intersection of price and potential value is a clear indicator of an undervalued asset poised for an ascent.
So, as you navigate the complexities of the market, keep a close eye on that predictive blue line. Understanding its dance with the black line can be your ticket to informed decision-making and successful trading.
Observe how the SLOPE of the predictive blue line started moving higher a few days before its moving above the black line. A strong trend was evidenced by seeing that prices were consistently closing above the predictive blue line.
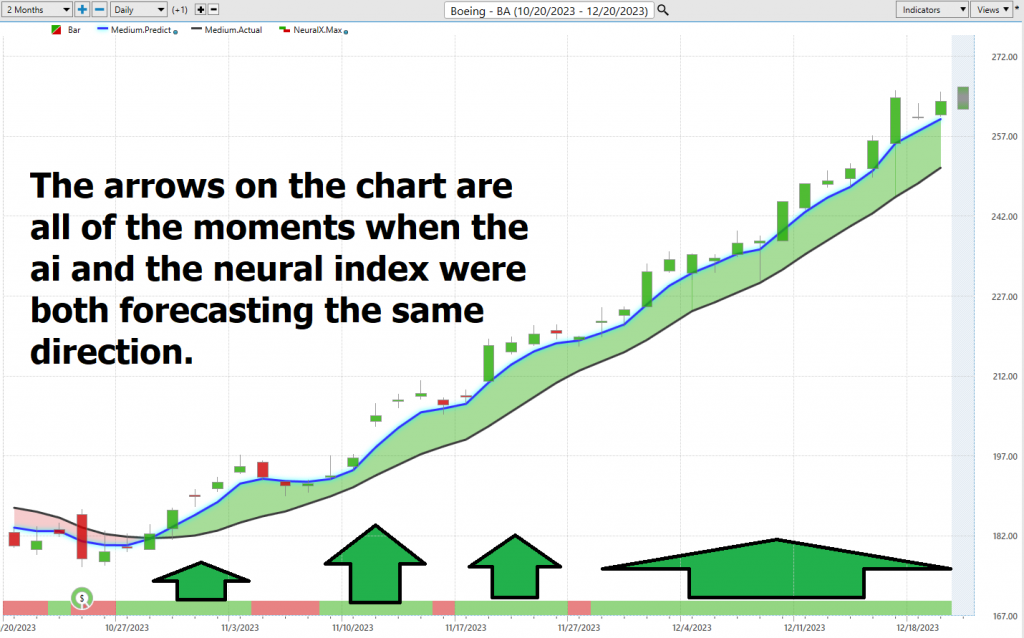
Fine Tuning Entries with The Neural Net Indicator
At the bottom of the chart is the Neural Network Indicator which predicts future strength and/or weakness in the market with a 48-to-72-hour time horizon.
So, what’s this Neural Net all about? Picture it as a super-smart computational learning system, sort of like a gigantic supercomputer. This indicator uses a network of functions to gobble up massive amounts of data and translate it into what we want to know. It’s like a relentless monitor, always watching and getting better at its job. For traders, this neural network is our secret weapon, continuously assessing hundreds of factors in the stock market, making sense of it all, and creating a detailed mental map. Each piece of data gets a weight based on its importance, and it’s like putting together a giant jigsaw puzzle. When you’ve got all these pieces in place, it can give traders a real edge and the foresight to see where the trends and values are headed.
Now, when the Neural Net Indicator is in the green zone, it tells us there’s strength in the market. But when it goes red, that’s a sign it’s predicting a bit of short-term weakness ahead.
Here’s our playbook, folks: we recommend that Power Traders take a good look at this chart, especially the predictive blue line and the neural network indicator. Combine them, and you’ve got what we call the DOUBLE CONFIRMATION setup. It’s all about finding those golden moments for entering and exiting your trades, giving you the upper hand in the market.
Power Traders are always on the hunt for those statistically sound trading opportunities, and using both the neural network and artificial intelligence can be a real game-changer.
We advise Power Traders to cross-reference the predictive blue line with Neural Net for the best entry opportunities.
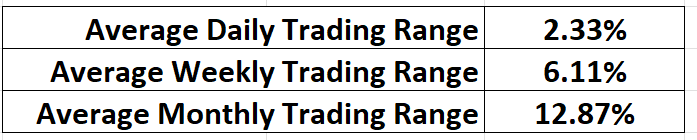
VantagePoint Software Daily Price Range Prediction
The purpose of all these indicators so far is to help traders stay on the right side of the right trend at the right time.
One of the powerful features in the Vantagepoint A.I. Software which Power Traders use daily is the Daily Price Range prediction forecast.
This forecast is what permits Power Traders to truly fine tune their entries and exits into the market, often looking for smaller time frames and more granular trading opportunities.
Here is what the average trading ranges have been on $BA over the past year for the daily, weekly, and monthly time frames.
Let’s talk about the daily puzzle that every trader faces – when to make their moves in the market. It’s a profound challenge, no doubt, but with VantagePoint’s cutting-edge A.I. and the Daily Price Range Forecast, it’s like having a seasoned market sage whispering invaluable advice in your ear.
Picture this: a subtle nudge, a gentle prod that predicts the market’s next move. By seizing opportunities at the lower end of the forecast and crafting exit strategies at their peak, traders can potentially swing the odds in their favor while keeping a watchful eye on risk management.
But here’s the thing, and it’s crucial to understand – the daily valuation of the stock market isn’t just about corporate moves or financial reports. It’s a complex dance influenced by a myriad of factors, and global events. Predicting these market movements is an art form in itself. Yet, VantagePoint A.I. seems to have mastered it, blending A.I., neural brilliance, and machine learning in its relentless quest for the perfect prediction.
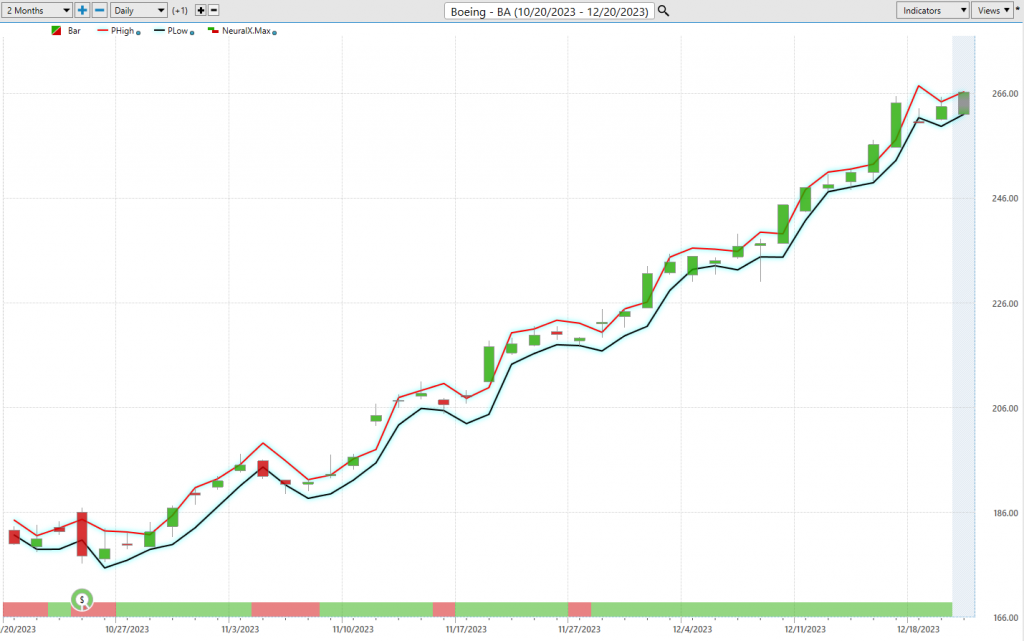
The heart of successful trading lies in spotting the perfect entry and exit points. VantagePoint doesn’t just help you find those moments; it does it with astonishing precision. The Daily Range forecast gets updated daily, giving you a window into potential price paths. It’s like having a seasoned market guru sharing their time-tested insights.
Now, let’s shift our focus to that chart. It’s more than just visually pleasing curves; it’s your roadmap for strategic stops and risk management. Notice how rarely prices dip below that prominent dark line? It’s a clear sign, pointing to the ideal zone for placing buy stops, ensuring that your risks remain finely tuned.
Observe how effective the daily range forecast is in clearly delineating the trend.
All of the tools so far in this analysis attempt to define value and to clearly identify the trend and points within the trend where traders should look to capitalize on.
Intermarket Analysis
Intermarket analysis is a powerful tool in the world of trading, and stocks like Boeing ($BA) are no exception. It’s all about understanding the intricate relationships between different markets, giving traders insights into how individual stocks may be affected. Take Boeing, for instance. A savvy trader can use intermarket analysis to gauge how Boeing’s stock price dances in relation to its industry competitors or related sectors, such as aerospace or airline stocks. But we don’t stop there; we also look at the bigger picture – macro factors like interest rates, government spending, or currency swings that could potentially move Boeing’s stock price. Armed with this knowledge, traders can craft effective strategies for their Boeing trades.
Now, what makes Vantagepoint Software truly special is its knack for performing Intermarket analysis and pinpointing those assets that are most intertwined, the ones that can either push $BA’s price higher or lower.
Sure, studying charts is great, and they give you clear support and resistance levels. But remember, we’re living in a global marketplace, and everything is interconnected. So, the billion-dollar question is, what are the key drivers behind the price of the asset I’m trading? These intangibles may not be visible to the naked eye, but they show incredibly high statistical correlations. Minor shifts in interest rates, crude oil prices, or the volatility of the dollar, among countless other variables, can impact a company’s decisions and survival in these challenging times. Identifying these factors is one of the biggest challenges for investors and traders.
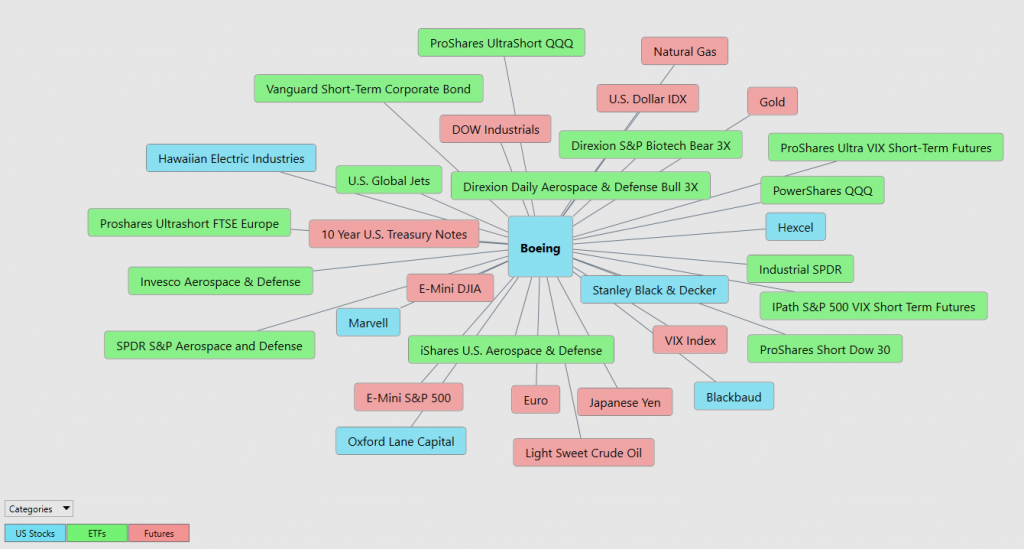
There’s immense value in studying and understanding the key drivers of $BA’s price action. This graphic, right here, offers a wealth of opportunities that can be swiftly explored within the software. It’s a remarkable research tool that consistently uncovers future gems in the world of trading.
Our Suggestion
The trend is $BA is clearly Up. Momentum is UP.
New 52-week highs have been breached.
Earnings are forecasted to grow by 65% per year moving forward.
Boeing is gearing up for a significant year ahead on multiple fronts. First and foremost, they are ramping up their delivery rates for critical commercial aircraft programs like the 737 MAX and the 787 Dreamliner, with plans to maintain this upward trajectory throughout 2024. Additionally, the challenges in the defense industry’s supply chain appear to be easing, positioning Boeing to achieve important milestones on its fixed-price defense programs in the coming year. Furthermore, Boeing’s management is focused on generating substantial free cash flow (FCF), aiming for $3 billion to $5 billion in FCF by the end of 1st quarter 2024, with ambitious goals of reaching $10 billion in FCF between 2025 and 2026. All in all, Boeing appears poised to make significant progress in 2024.
Put $BA firmly on your trading radar and use the ai to navigate the volatility. We think there will be numerous great swing trading opportunities in 2024 for $BA.
Let’s Be Careful Out There!
Remember, It’s Not Magic.
It’s Machine Learning.
Disclaimer: THERE IS A HIGH DEGREE OF RISK INVOLVED IN TRADING. IT IS NOT PRUDENT OR ADVISABLE TO MAKE TRADING DECISIONS THAT ARE BEYOND YOUR FINANCIAL MEANS OR INVOLVE TRADING CAPITAL THAT YOU ARE NOT WILLING AND CAPABLE OF LOSING.
VANTAGEPOINT’S MARKETING CAMPAIGNS, OF ANY KIND, DO NOT CONSTITUTE TRADING ADVICE OR AN ENDORSEMENT OR RECOMMENDATION BY VANTAGEPOINT AI OR ANY ASSOCIATED AFFILIATES OF ANY TRADING METHODS, PROGRAMS, SYSTEMS OR ROUTINES. VANTAGEPOINT’S PERSONNEL ARE NOT LICENSED BROKERS OR ADVISORS AND DO NOT OFFER TRADING ADVICE.


