


| This week’s a.i. Stock Spotlight is Boston Scientific ($BSX) |
Boston Scientific Corporation ($BSX) is a prominent player in the medical device industry, focusing on developing, manufacturing, and marketing medical devices used in a variety of interventional medical specialties. Boston Scientific’s revenue is generated through the sale of these medical devices across various segments, including cardiovascular, rhythm management, endoscopy, urology and pelvic health, and neuromodulation. Boston Scientific Corporation ($BSX) is recognized for its innovative solutions aimed at enhancing patient outcomes across various medical specialties.
Founded in 1979 by John Abele and Pete Nicholas, Boston Scientific has grown significantly over the years. It became profitable after years of growth and innovation, with profitability milestones being publicly documented in financial reports since its initial public offering in May 1992 at $9 per share. The company is headquartered in Marlborough, Massachusetts, and employs 48,000 individuals worldwide, indicating its large scale and global reach.
Boston Scientific’s first major product breakthrough was the steerable catheter, which revolutionized less-invasive medicine. They hold over 13,000 patents globally and operate in 120 countries worldwide.
Boston Scientific’s main competitors include other medical device manufacturers such as Medtronic, Abbott Laboratories, and Johnson & Johnson. The medical device industry is highly competitive, with innovation and technological advancement being key factors for success. Among its extensive product portfolio, cardiovascular products, particularly those for cardiac rhythm management and interventional cardiology, have traditionally been significant revenue drivers.
Boston Scientific’s financial performance over the past few years showcases a trajectory of growth, despite the challenges posed by the global healthcare landscape.
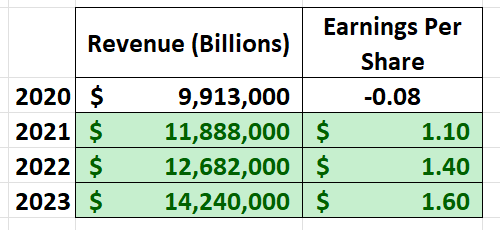
Analyzing Boston Scientific’s financial performance over the last five years reveals trends in annual revenue and earnings, providing insights into the company’s growth and financial health. For instance, in the fourth quarter of 2023, Boston Scientific reported net sales of $3.725 billion, representing a 14.9% increase on a reported basis compared to the same period in the previous year. The company reported GAAP net income attributable to common stockholders of $504 million, or $0.34 per share, compared to $126 million, or $0.09 per share, a year ago. This performance demonstrates significant growth in earnings per share (EPS), highlighting the company’s profitability improvement
In contrast, the fourth quarter of 2022 saw net sales of $3.242 billion, a 3.7% increase on a reported basis compared to the previous year, with GAAP net income available to common stockholders of $126 million, or $0.09 per share. Comparing these figures year over year, there’s a clear trend of revenue growth and profitability improvement, illustrating Boston Scientific’s ongoing success in executing its business strategies.
Earnings are forecast to grow 17.3% per year.
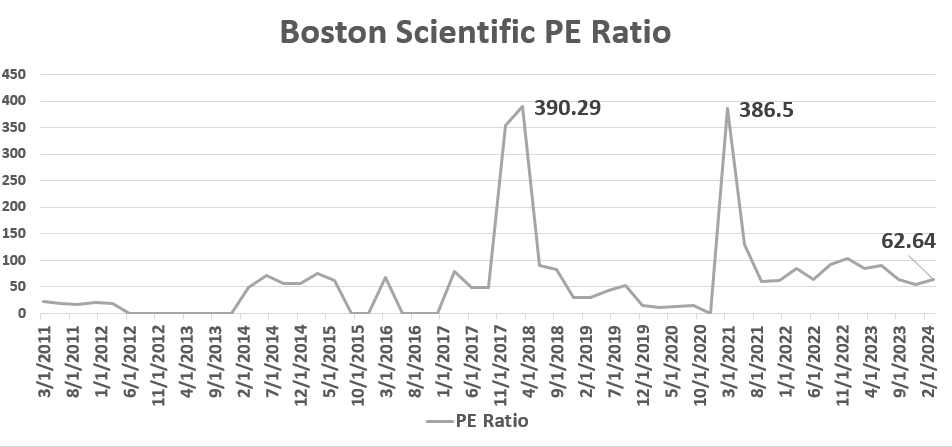
Earnings grew by 144.5% over the past year. What concerns analysts is that the price to earnings ratio is 62 which is high. However, the p/e ratio has been as high as 390 in 2017, so it is not extreme for the stock.
The company has announced an agreement to acquire Axonics, Inc., a move aimed at expanding its urology portfolio with technologies for treating urinary and bowel dysfunction.This acquisition is set to be completed in the first half of 2024, with Axonics expecting a net revenue of approximately $366 million in 2023, indicating a 34% growth over the prior year. The transaction is anticipated to be accretive to Boston Scientific’s adjusted earnings per share from 2024 onwards.
The company’s commitment to research and development has fueled a consistent introduction of new products, contributing to its revenue and earnings growth. In terms of debt, Boston Scientific has managed a balanced approach, investing in growth while maintaining a sustainable level of leverage.
One of the biggest opportunities for Boston Scientific lies in its ability to innovate and expand its product offerings, particularly in high-growth areas such as structural heart devices, neuromodulation, and minimally invasive therapies. Boston Scientific’s business model leverages strategic acquisitions to broaden its product portfolio and enter new markets. Over the last decade, the company has made several key acquisitions, such as the purchase of NxThera, Apama Medical, and BTG plc. These acquisitions have strengthened its position in fields like urology, electrophysiology, and cancer treatment. The biggest opportunity for Boston Scientific lies in expanding its footprint in emerging markets and continuing to lead in innovation within its core segments. However, risks include regulatory challenges, competitive pressures, and the need for constant innovation to stay ahead in the highly dynamic healthcare market. Boston Scientific’s ability to innovate and secure FDA approvals for new products is crucial in maintaining its competitive edge. However, the industry faces inherent risks, including regulatory
hurdles, product liability issues, and the need for continuous innovation to meet evolving healthcare needs.
Wall Street analysts have varied opinions on Boston Scientific, with many viewing the company as a strong player in the medical device field due to its diversified product portfolio, strong research and development capabilities, and strategic acquisitions. The consensus among many analysts is that Boston Scientific is a market leader in several of its core segments, with a strong track record of growth and innovation.
Current Quarterly Earnings:
Boston Scientific reported a significant increase in its earnings per share (EPS) for the fourth quarter of 2023, with an adjusted EPS of $0.55 compared to $0.45 a year ago. This level of growth is impressive in their sector.
New Products, Services, or Management:
Boston Scientific has been active in launching new products and services. Notably, they received FDA approval for the FARAPULSE™ Pulsed Field Ablation System and commenced various clinical trials, such as the AVANT GUARD trial for persistent atrial fibrillation. Boston Scientific’s commitment to innovation is evident in its continuous launch of new products, such as the AGENT™ Drug-Coated Balloon and the Lotus Valve System. Imagine your body has a network of pipes, like the plumbing in your house, but these pipes are your blood vessels that carry blood to different parts of your body. Sometimes, these pipes can get narrow because of stuff sticking to the walls, kind of like how hair and soap can clog a drain. When this happens in your body, it’s harder for blood to flow where it needs to go.
The AGENT™ Drug-Coated Balloon is like a special tiny balloon attached to a very thin tube. Doctors can put this balloon into the clogged pipe (or blood vessel) by threading it through your blood vessels, starting from a larger opening, like in your leg. When they reach the part that’s narrow and clogged, they inflate the balloon.
This balloon is not just any balloon, though. It’s coated with a special medicine. When the balloon inflates and presses against the walls of the blood vessel, it helps push the sticky stuff out of the way to make the pipe wider again. At the same time, the medicine on the balloon’s surface gets transferred to the blood vessel’s walls. This medicine helps keep the blood vessel open wider for longer and prevents the sticky stuff from quickly building up again.
These developments and approvals will positively impact the company’s future growth.
The stock has a market cap of $98.3 billion and trades on average 7 million shares per day. $BSX has strong institutional participation and interest, SEC for 13F shows 91.18% of all outstanding stock is owned by institutions.
Boston Scientific exhibits strong fundamentals, the company’s strategic advancements and the significance of its new product introductions suggest a positive outlook.
In this stock study we will look at the following metrics and indicators.
- Wall Street Analysts’ Estimates
- 52-week high and low boundaries
- Vantagepoint A.I. Predictive Blue Line
- The Best Case – Worst Case Scenarios
- Neural Network Forecast
- Daily Range Forecast
- Seasonal Analysis
- Intermarket Analysis
- Our trading suggestion
We don’t base decisions on things like earnings or fundamental cash flow valuations. However, we do look at them to better understand the financial landscape that a company is operating under.
Wall Street Analysts’ Estimates
Based on 22 Wall Street analysts offering 12-month price targets for Boston Scientific in the last 3 months. The average price target is $68.95 with a high forecast of $81.00 and a low forecast of $60.00. The average price target represents a 2.25% change from the last price of $67.43.
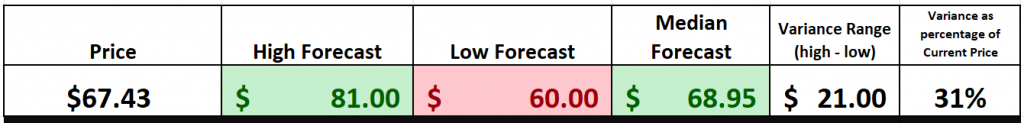
We typically like to look at the variance between the most bullish and bearish forecasts and use that as a gauge for future expected volatility. Currently this variance is 31% or $21 which is considered very moderate in comparison to other high performing stocks.
We find this variance valuable as often rallies and declines are confined to this level of volatility.
52-Week High and Low Boundaries
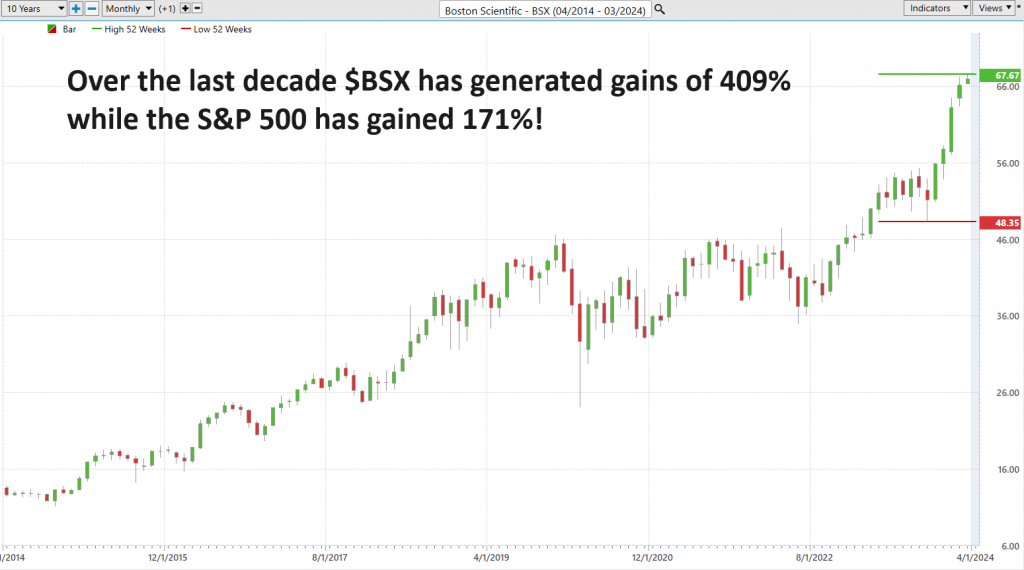
Over the past 52 weeks $BSX has traded as high as $67.67 and as low as $46.20.
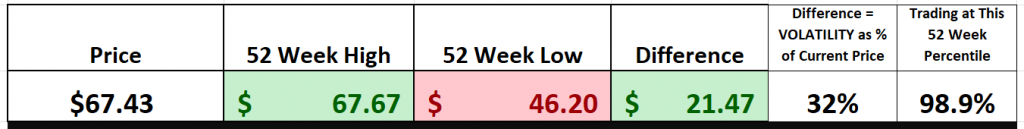
The annual trading range was $21.47. These numbers provide us with an accurate perspective of historic volatility which we can calculate by comparing the annual trading range to the current price. Over the last 52 weeks the historic volatility was 32% which is moderate. This value tells us that based upon the recent past it would be perfectly normal to expect prices to trade 32% higher and or lower over the next 52 weeks
Equally of importance is the fact that $BSX is trading at it 98th percentile of the last 52 weeks.
Power Traders, let’s embark on a journey with the wisdom of the 52-week highs and lows, starting with a spotlight on $BSX. These aren’t just numbers; they’re the storybook of a stock’s year-long quest, a testament to its highs and lows. Imagine them as the milestones of success and caution in our investing voyage.
But here’s where it gets interesting: navigating the market’s waves with these beacons can spotlight opportunities or red flags. It’s like having a treasure map where X marks the spot of potential prosperity or peril.
Let’s anchor this concept with $BSX’s impressive journey, boasting a 409% gain over the last decade, sailing past the S&P 500’s 171% rise. This isn’t just success; it’s a beacon of strategic triumph, signaling robust momentum and a bullish bonanza.
Remember traders, in the vast ocean of the stock market, the 52-week metrics are your compass, and coupling them with the long-term view is your chart to navigate towards treasure troves. When a stock like $BSX not only hits new highs but continues to set the bar higher over a decade, it’s not just sailing; it’s soaring on the winds of unparalleled growth and investor confidence.
To our seasoned explorers, it’s no secret: a stock hitting new 52-week and 10-year highs is like discovering a new world, promising potential untold riches and adventures. This isn’t just an uptick; it’s a testament to enduring excellence and investor confidence. In this grand narrative of success, such milestones are not just points on a chart; they’re the legends of tomorrow, heralding a future of boundless potential and prosperity. So, let’s chart our course with these beacons, and may your trades sail toward prosperous shores.
In essence, analyzing stocks through the lens of their 52-week highs and lows, especially when juxtaposed with long-term performance, offers a powerful setup for identifying both immediate and enduring trading opportunities.
Best Case – Worst Case Scenario
In trading, where the sea of market fluctuations ebbs and flows with unpredictable fervor, lies a pivotal principle that anchors every astute investor and trader to the realms of success: the intricate balance between risk and reward. This isn’t about the convoluted mazes of trading strategies that befuddle even the seasoned veterans; it’s about the clear-eyed analysis, the simple yet profound act of charting the market’s volatility over the annual cycle, much like a seasoned mariner navigates through the tempest-tossed waves of the open sea. This, dear readers, is the quintessence of wisdom in financial navigation.
Imagine, if you will, drawing the lines that connect the top of market rallies to the lows of its downturns. This exercise transcends mere market analysis; it’s an exploration into common sense, uncovering the raw essence of risk and reward that pulsates through the veins of the stock market.
This pragmatic approach demystifies analysis by quickly allowing you to see the best case and worst-case scenarios.
Thus, we delve into the charts not as casual observers but as strategic thinkers, crafting a robust strategy that equips us to make informed decisions, manage exposure, and devise a trading plan resilient enough to withstand any storm.
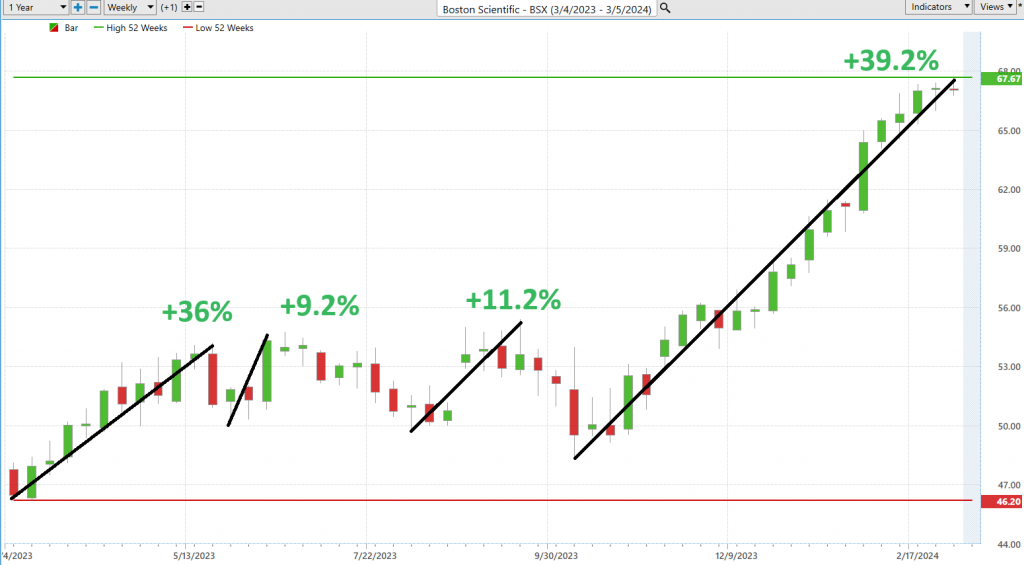
First, we perform the best-case analysis:
Followed by the worst-case analysis:
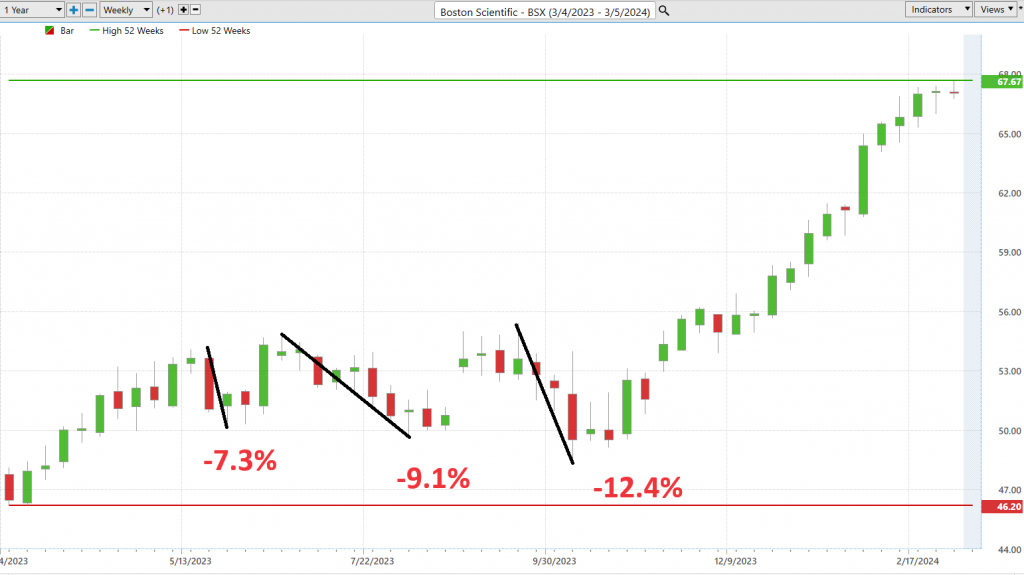
The simple conclusion we can draw from this exercise is that the bulls are clearly in control and that over the past 52 weeks decline of 10% or greater were buying opportunities.
Nest we compare $BSX to the broader stock market indexes to quickly see how it has performed relative to the broader market.
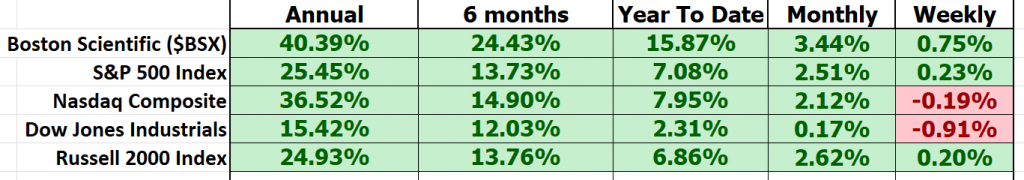
Clearly $BSX has outperformed the broader stock market indexes.
The spotlight then shifts to volatility, measured through the lens of Beta—a metric that quantifies a stock’s volatility in relation to the overall market. With a Beta of .78, Boston Scientific ($BSX) emerges as a paragon of stability, boasting 22% less volatility than the broader market, a testament to its superior performance amidst lesser chaos.
Diving deeper into Beta, we uncover its nuances: a Beta of 1 symbolizes a perfect harmony with the market’s movements; a Beta greater than 1 signals a heightened thrill of volatility; and a Beta less than 1 represents a serene journey, less swayed by the market’s gyrations. Applying these insights to $BSX, we find a rare gem that has managed to enhance its revenue, earnings, and stock price with less volatility than the market—a beacon for investors seeking higher growth with greater stability.
Beta serves as our trusty “risk-o-meter,” guiding us in tailoring a portfolio that aligns with our thrill-seeking thresholds and investment ambitions. It’s in these insights, in this blend of wisdom and strategy, that the path to informed investing and risk management lies. For those who venture into the market’s tumultuous waters, understanding the balance between risk and reward, guided by tools like Beta, is not just beneficial—it’s indispensable.
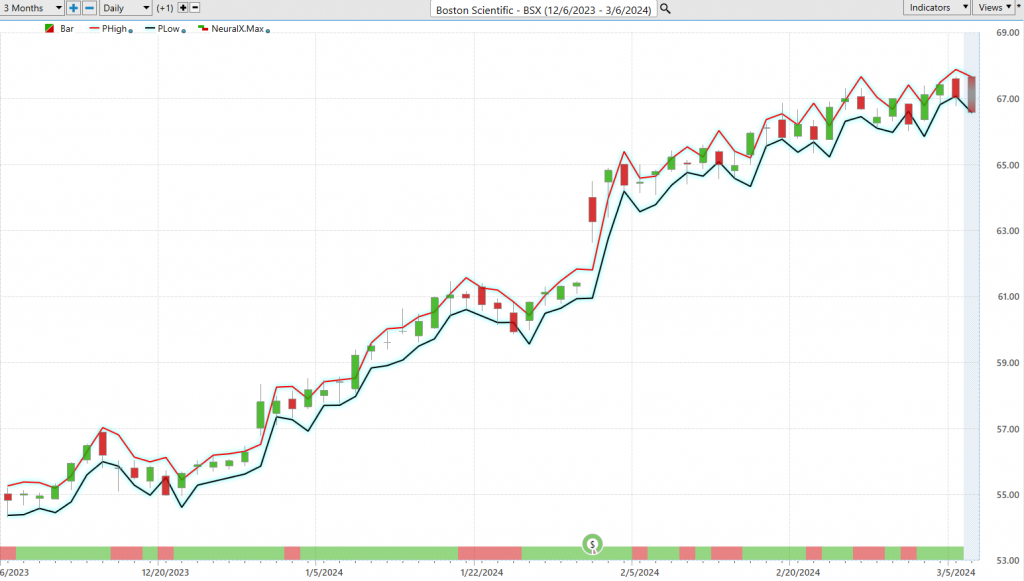
Vantagepoint A.I. Predictive Blue Line Forecast.
Our guiding principles are as follows:
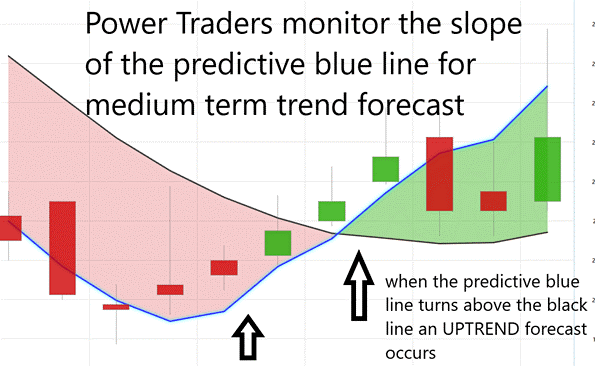
– The trajectory of the predictive blue line dictates the trend forecast and overall trajectory of $BSX.
– Ideally, the VALUE ZONE is determined to seek buying opportunities at or below the predictive blue line or selling opportunities above it during a downtrend.
– Naturally, as the predictive blue line slopes downward, traders anticipate lower prices, either retreating to the sidelines or hedging their positions. In the breakneck pace of today’s financial markets, traders are always on the hunt for the next big thing, the next tool or strategy that can help them stay ahead of the curve, stay ahead of the game. So, what’s catching their eyes now? Well, let me introduce you to VantagePoint Software. This isn’t just another name in the sea of financial tech out there; no, sir. VantagePoint is on the forefront of harnessing artificial intelligence to give
traders a crystal-clear view of what’s ahead in terms of risk and reward. And how do they do it? With something they call the a.i. predictive blue line.
Imagine, if you will, this predictive blue line as your financial North Star. Its trajectory, whether it’s on the up and up or on a bit of a slide, serves as a reliable indicator of where the market’s headed. An upward tilt? You’re looking at a bullish market, ripe with opportunities for those looking to buy. A downward trend, on the other hand, could be your signal to start considering some strategic exits.
But there’s more to this blue line than just direction. It points traders to what VantagePoint calls the ‘value zone’. Think of this as the sweet spot in an uptrend, right under the blue line, where the price meets intrinsic value, revealing the true worth of an asset.
This isn’t just guesswork. VantagePoint’s predictive blue line is the product of cutting-edge A.I. technology, a blend of neural networks and intermarket analysis that digs into the practical details of price drivers, peeling back layers to reveal an asset’s intrinsic value.
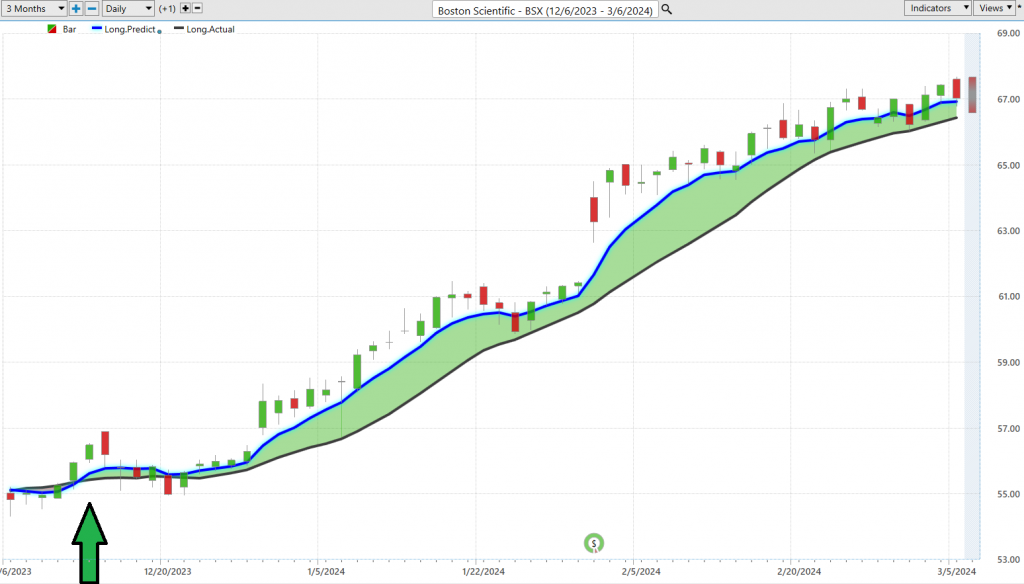
Then there’s the black line, which you might call the yin to the blue line’s yang. This line gives us a peek into the recent past, tracing the 10-day moving average like a trail of breadcrumbs that provides context for the blue line’s forward-looking predictions. The dance between these two lines, the interplay between past performance and future projections, is where the magic happens, unveiling momentum and pinpointing opportunities that might just be the next big thing for traders.
Powered by VantagePoint’s patented Neural Network and Intermarket Analysis, the predictive blue line cuts through the clutter, leveraging A.I. and statistical correlations to bring to light the strongest price drivers for an asset.
And in this fast-paced financial world, who wouldn’t want a glimpse into the future?
In essence, one glance at the chart unveils the forecast of artificial intelligence.
Neural Network Indicator (Machine Learning)
Neural networks, for traders, are essentially complex computational systems modeled after the human brain’s network of neurons. These networks consist of layers of interconnected nodes, each acting like a neuron, and they’re designed to process information in a way that mimics the cognitive functions of the human brain. Constructing a neural network involves a process known as training, where the network is fed vast amounts of data and learns to recognize patterns and relationships within that data.
For traders, especially those just starting, neural networks offer a cutting-edge tool for analyzing market data. These systems can sift through large volumes of data to identify complex patterns and trends that might not be immediately obvious, acting as an advanced pattern recognition tool that can detect correlations, anomalies, and emerging trends in market behavior.
The creation of neural networks involves feeding them with large datasets and allowing them to learn from this information through a process that adjusts the connections between nodes based on the accuracy of the network’s output. Over time, with iterative training and adjustments, neural networks refine their ability to make accurate predictions, adapting to new data and evolving market conditions.
Neural networks can significantly enhance decision-making for traders by:
1. Minimizing human error: They process and analyze data with a level of efficiency and accuracy that surpasses human capability, thus reducing the likelihood of mistakes in trading decisions.
2. Enhancing precision: Their ability to unearth subtle patterns in data enables traders to make more informed and precise predictions about market movements.
3. Keeping traders ahead: By identifying trends and signals in real-time, neural networks help traders anticipate market movements, allowing them to act on opportunities before they become apparent to the broader market.
In the arena of trading, where minutes can be the difference between profit and loss, traders are always on the lookout for that ace up their sleeve. And folks, that ace might just be the neural network. Picture this: a digital brain, inspired by our own, made up of layers upon layers of nodes, each one a digital neuron. These networks, through a rigorous training regimen, learn to recognize the patterns and secrets hidden within mountains of market data.
But what does this mean for our traders, especially the newcomers to this high-stakes world? It means access to a tool of unparalleled sophistication, a tool that can sift through the chaos of market data to find the patterns, the signals that the human eye might miss.
Creating these neural marvels involves feeding them a diet rich in data, allowing them to learn, to adapt, and to refine their predictions with each piece of information they process. This iterative training not only enhances their predictive accuracy but also enables them to evolve with the market, ensuring their insights remain relevant.
Now, why should traders integrate neural networks into their decision-making arsenal? First off, these networks slash the risk of human error, bringing a level of data analysis precision that we, with our all-too-human limitations, can only dream of. They’re also masters of pattern recognition, enabling traders to pinpoint market movements with an unprecedented sharpness. And perhaps most importantly, they offer a glimpse into the future, uncovering emerging trends and opportunities in real time, keeping traders not just in the game but ahead of it.
At the heart of this digital revolution in trading is the Neural Network Indicator. This isn’t just any tool; it’s a predictive powerhouse, flashing signals of market strength or weakness much like a weather forecast predicts sunshine or storms. It’s this foresight, this ability to see the market’s next move, which can be the difference between reacting and leading in the world of trading.
But our Power Traders don’t put all their eggs in one basket. No, they’re strategists, combining the insights of the Neural Network Indicator with other tools like the Predictive Blue Line. It’s this blend of technology and strategy that elevates their trading game.
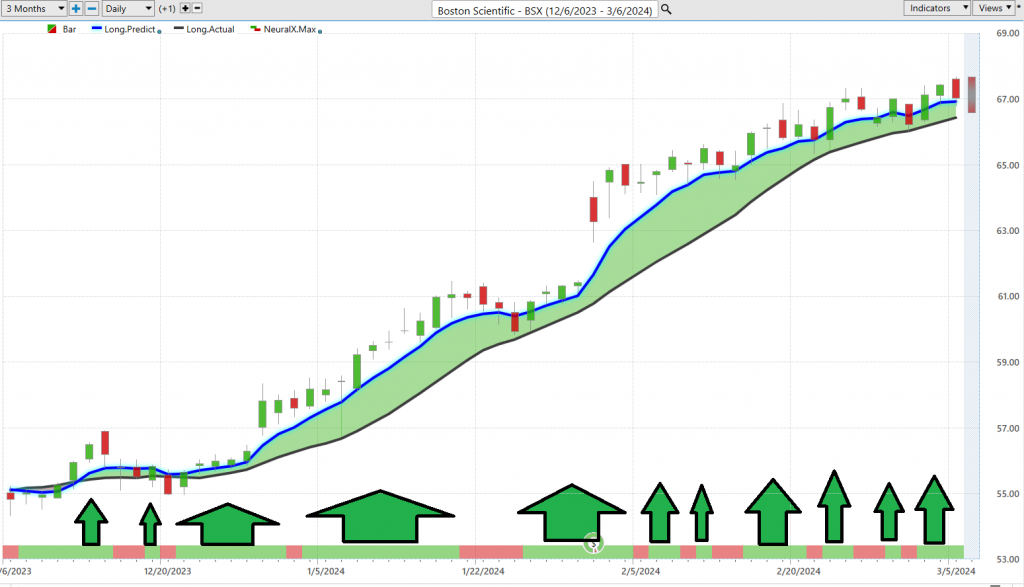
The arrows on the chart above are all the times when the Neural Index and the Predictive Blue Line were both pointing in the same direction. We refer to this as the “double confirmation setup.”
VantagePoint Software Daily Price Range Prediction
In today’s financial markets, where every tick of the clock can spell the difference between profit and loss, the savvy trader is ever in pursuit of that elusive edge. Enter the realm of artificial intelligence (A.I.), machine learning, and neural networks—technological titans that arm traders with the foresight to predict the next day’s trading range with uncanny precision.
By digging deep into the annals of historical market data, these cutting-edge tools unravel patterns, trends, and correlations that dictate price movements, elevating pattern recognition to an art form and predictive modeling to a science.
With machine learning algorithms and neural networks at their disposal, traders are equipped to anticipate future price shifts with a clarity that was once the stuff of fantasy. Real-time analysis ensures that traders remain agile, while the precision in defining trading ranges becomes a linchpin in risk management and strategic decision-making. These AI-driven indicators provide traders a formidable advantage, sharpening their analysis, unearthing hidden opportunities, and refining trading tactics every single day.
Consider, if you will, the average trading ranges—daily, weekly, monthly—over the past year.
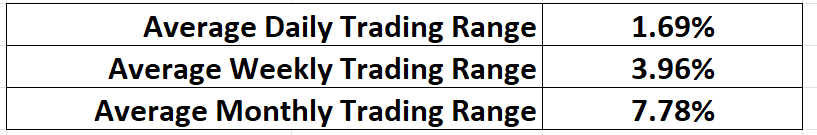
Yet, herein lies the rub: mere knowledge of these ranges is not enough. The quintessential enigma for swing traders is pinpointing those opportune moments, those “sweet spots” for executing their trades with surgical precision.
Now, cast your gaze upon the Daily Range Forecast chart, a tool of unparalleled finesse, engineered with the short-term swing trader in mind. This is no ordinary chart; it’s a visionary beacon, casting light on the path each trading day will likely tread.
In trading, where precision is not merely valued but vital, Vantagepoint A.I.’s Daily Range Forecast emerges as an essential companion. Imbued with the prowess of artificial intelligence, machine learning, and neural networks, this instrument transcends mere data analysis. It deciphers the very cadence of the market day by day, serving as a navigator for those we call Power Traders. It empowers them to slice through the market’s confusing turbulence with the grace of seasoned pilots, pinpointing those critical moments for entry and exit.
Intermarket Analysis
In today’s global financial landscape, understanding the myriad connections that drive market prices is paramount for traders aiming for success. Intermarket analysis emerges as a critical tool in this context, offering a framework to decipher the complex interactions across various asset classes and markets. This analytical approach examines the correlations and interdependencies among diverse financial instruments—including stocks, bonds, currencies, commodities, and indices—to unearth insights into overarching market trends and uncover potential trading opportunities.
The value of intermarket analysis rests in its holistic perspective on market dynamics. By scrutinizing the interplay between different markets, traders can gain a nuanced understanding of the factors influencing price movements and, consequently, forecast trends across a spectrum of asset classes. This comprehensive view is instrumental in enabling traders to make well-informed decisions and manage risks with greater proficiency.
Louis Mendelsohn’s contributions to trading and technical analysis have been pivotal, particularly through his development of the VantagePoint A.I. trading software. Mendelsohn’s innovative work in integrating intermarket relationships into trading strategies has equipped traders with the ability to analyze multiple markets concurrently, significantly enhancing their strategic approach.
Intermarket analysis benefits traders in several key aspects:
**Identifying Correlations:** It allows traders to discern correlations among different asset classes, providing insights into how markets might influence one another. For instance, understanding the inverse relationship between stocks and bonds, or how commodity prices and currency exchange rates are linked.
**Anticipating Trends:** This analysis facilitates the prediction of trends in one market based on movements in related markets. A surge in commodity prices, for example, may herald impending inflationary pressures, influencing currency values and interest rates.
**Diversification:** By grasping the interconnections between markets, traders can diversify their portfolios more effectively across various asset classes, thereby diluting risk. Diversification enables the balancing of potential losses in one market with gains in another.
**Timing Trades:** Intermarket analysis aids in optimizing the timing of trades by pinpointing convergence or divergence among markets. A scenario where stock prices ascend while bond yields descend may signal a bullish trend for equities.
Here are the 31 key drivers of $BSX’s price.
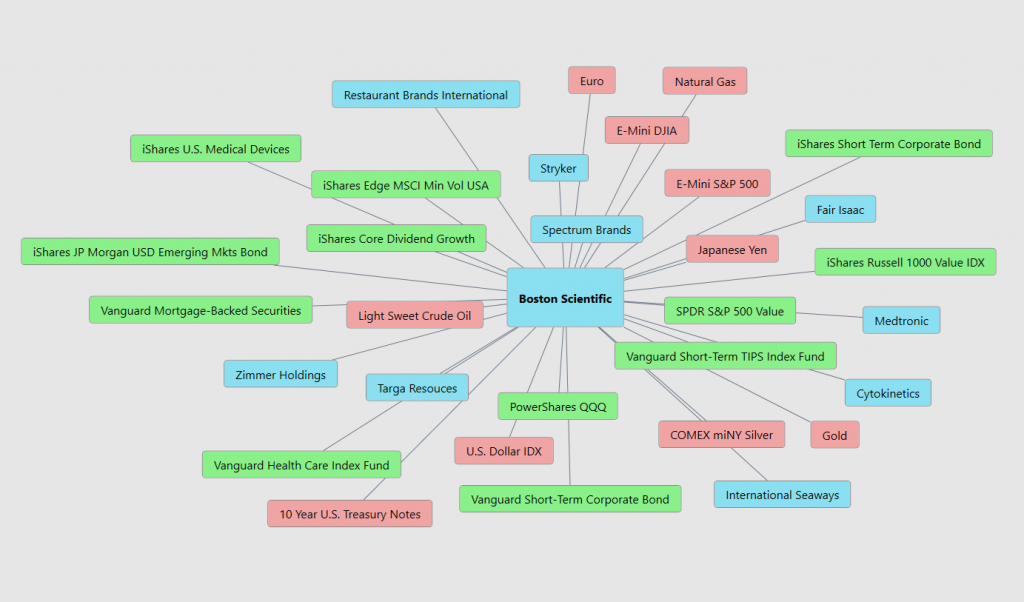
In essence, intermarket analysis endows traders with a more profound comprehension of the market’s interconnected nature, furnishing them with a strategic advantage to enhance their trading performance. By weaving intermarket relationships into their trading frameworks, traders can navigate the complexities of the financial markets with increased agility and acumen.
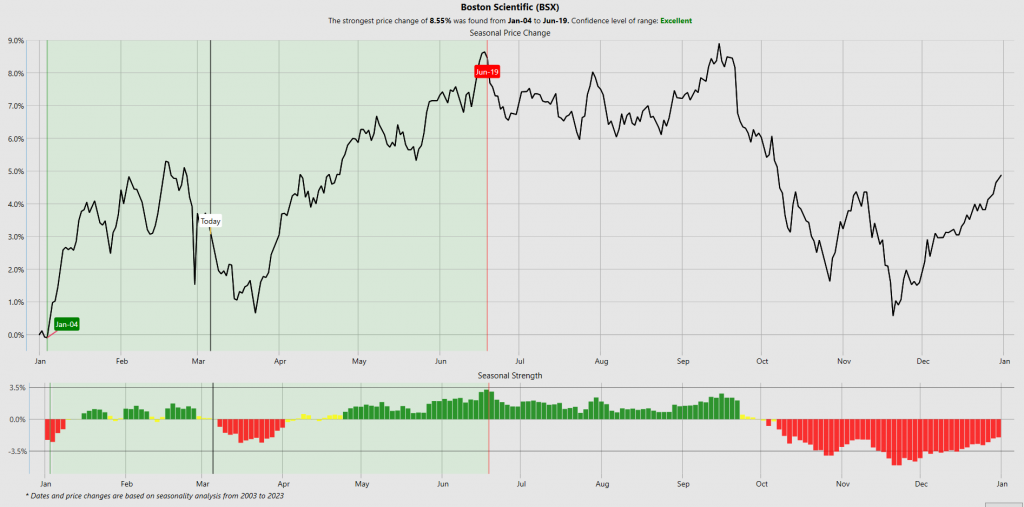
Seasonal Analysis
Seasonal analysis dissects the cyclical nature of financial markets, taking cues from the predictable patterns dictated by the calendar and human behavior. This approach is akin to observing the natural world, where the changing of seasons signals shifts in the environment. In the financial markets, these seasonal trends act as navigational beacons for traders, informed by an array of factors including investor sentiment, economic cycles, and even climatic changes. For example, the observed uptick in retail stocks as the holiday season draws near is not merely coincidental but reflective of the increased consumer activity characteristic of this period.
To harness the insights offered by seasonal analysis, traders engage in a meticulous review of historical data, seeking to identify these repeatable patterns. This process resembles poring over a historical record, discerning which periods were marked by growth and which by decline. By recognizing these patterns, traders are better equipped to strategize effectively, much like preparing for inclement weather by having an umbrella at hand.
It’s important to note, however, that seasonal trends represent probabilities rather than certainties. We suggest to always use them in conjunction with other trading tools. The red line on the chart below is the historical seasonal pattern for $BSX.
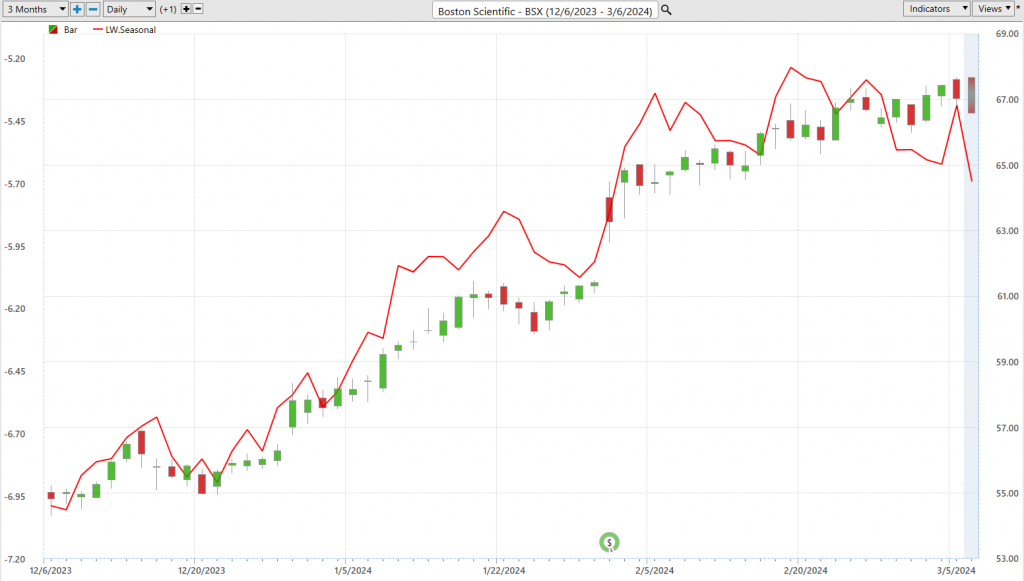
The chart below represents the historical seasonal tendency for the stock based upon all of the historical data:
While seasonal analysis enlightens traders to the potential rhythms of the market, it underscores the necessity for flexibility and a diversified approach to trading. The market’s complexity demands a strategy that acknowledges the value of seasonal trends without being overly reliant on them.
Regarding the seasonal chart for $BSX, it providea a visual representation of these concepts, illustrating the historical performance of Boston Scientific stock across different seasons. This chart reveals, for example, periods of heightened activity or growth, allowing traders to make informed decisions based on these patterns. However, without a specific chart provided, this description serves to contextualize how such a chart might be interpreted within the framework of seasonal analysis.
Our Suggestion
The next earnings call for $BSX will occur on April 24, 2024.
The company is no longer undervalued which requires that traders place even a greater attention on the artificial intelligence for daily guidance.
Analysts expect earnings to continue to grow simply based upon the recent acquisitions. Consensus estimates are around 51 cents per share.
Technically speaking the stock has broken out to new all time highs. For those who are already positioned this is the type of environment traders dream about where you sit back and enjoy the ride. For traders looking to get in utilize the daily range forecast for guidance.
$BSX is firing on all cylinders and the future looks very promising. Earnings will be future drivers of price action. Traders whould anticipate greater volatility than normal. We continue to think that $BSX will continue to offer great tremendous opportunities in the coming year. Pay close attention to the 52 week high for resistance and when it is consistently breached it will act as support.
We advise that you practice good money management on all of your trades and that you follow the A.I. forecast for your trend anaysis to determine optimal entries and exits.
Let’s Be Careful Out There!
Remember, It’s Not Magic.
It’s Machine Learning.
Disclaimer: THERE IS A HIGH DEGREE OF RISK INVOLVED IN TRADING. IT IS NOT PRUDENT OR ADVISABLE TO MAKE TRADING DECISIONS THAT ARE BEYOND YOUR FINANCIAL MEANS OR INVOLVE TRADING CAPITAL THAT YOU ARE NOT WILLING AND CAPABLE OF LOSING.
VANTAGEPOINT’S MARKETING CAMPAIGNS, OF ANY KIND, DO NOT CONSTITUTE TRADING ADVICE OR AN ENDORSEMENT OR RECOMMENDATION BY VANTAGEPOINT AI OR ANY ASSOCIATED AFFILIATES OF ANY TRADING METHODS, PROGRAMS, SYSTEMS OR ROUTINES. VANTAGEPOINT’S PERSONNEL ARE NOT LICENSED BROKERS OR ADVISORS AND DO NOT OFFER TRADING ADVICE.


