| This week’s a.i. Stock Spotlight is Citi (C) |
Citigroup ($C) is one of the giants in the world of finance, and it’s important to take a closer look at this financial powerhouse to understand its role in the industry. Founded in 1812 as the City Bank of New York, Citigroup is a global financial services conglomerate headquartered in New York City, with a rich history spanning over two centuries. It was originally established by Samuel Osgood, a former United States Postmaster General, and it has grown into one of the largest and most influential financial institutions in the world. It operates in more than 100 countries, serving millions of customers worldwide and has a market capitalization of $101.47 billion.
Citigroup operates in multiple segments, including Global Consumer Banking, Institutional Clients Group, and Corporate. Its revenue primarily comes from a wide range of financial services, including retail banking, commercial banking, investment banking, asset management, and credit card services. This diversity in revenue streams has contributed to its resilience in various economic climates.
$C faces stiff competition from other major financial institutions, including JPMorgan Chase & Co. ($JPM), Bank of America Corporation ($BAC), Wells Fargo & Company ($WFC), and Goldman Sachs Group, Inc. ($GS), among others. These institutions are constantly vying for market share and dominance in the financial sector.
Once a dominant player in underwriting state and local government debt, $C is stepping away from that business. This strategic decision reflects Citigroup’s ongoing efforts to streamline operations and improve its stock price under the leadership of CEO Jane Fraser. The municipal bond business, which had a rich history of financing crucial infrastructure projects across the United States, including iconic landmarks like Chicago’s O’Hare Airport and One World Trade Center post-9/11, apparently no longer delivered the expected profits. This move comes as part of a broader restructuring effort aimed at focusing on serving multinational corporations, shedding unprofitable ventures, and enhancing efficiency. Fraser has been steering Citigroup away from consumer banking in various parts of the world and initiating layoffs as part of a substantial internal overhaul. The hope is that these changes will reinvigorate Citigroup’s stock, which has lagged behind its peers and the broader banking index over the past decade. Citigroup anticipates incurring charges of “a couple hundred million dollars” associated with the restructuring.
Now, let’s explore some key aspects of Citigroup’s business model, opportunities, and risks:
**Biggest Opportunities**
1. **Global Presence**: Citigroup’s extensive international presence provides an opportunity for growth in emerging markets.
2. **Technology and Digital Banking**: Embracing digital banking and innovative technologies can enhance customer experience and efficiency.
3. **Wealth Management**: Expanding its wealth management and asset management services can tap into growing wealth in various regions.
**Main Risks**
1. **Regulatory Challenges**: Citigroup has faced regulatory issues in the past, and changing regulations can impact its operations.
2. **Economic Cycles**: Economic downturns can lead to higher loan defaults and reduced demand for financial services.
3. **Cybersecurity**: The increasing threat of cyberattacks poses risks to sensitive customer data and financial stability.
4. **Geopolitical Factors**: Political instability and trade tensions in international markets can affect Citigroup’s global operations.
Over the past decade, Citigroup has made several notable acquisitions, including the purchase of Grupo Financiero Banamex in 2001 and the acquisition of the banking operations of E*TRADE Financial in 2020. These acquisitions have expanded its global reach and product offerings.
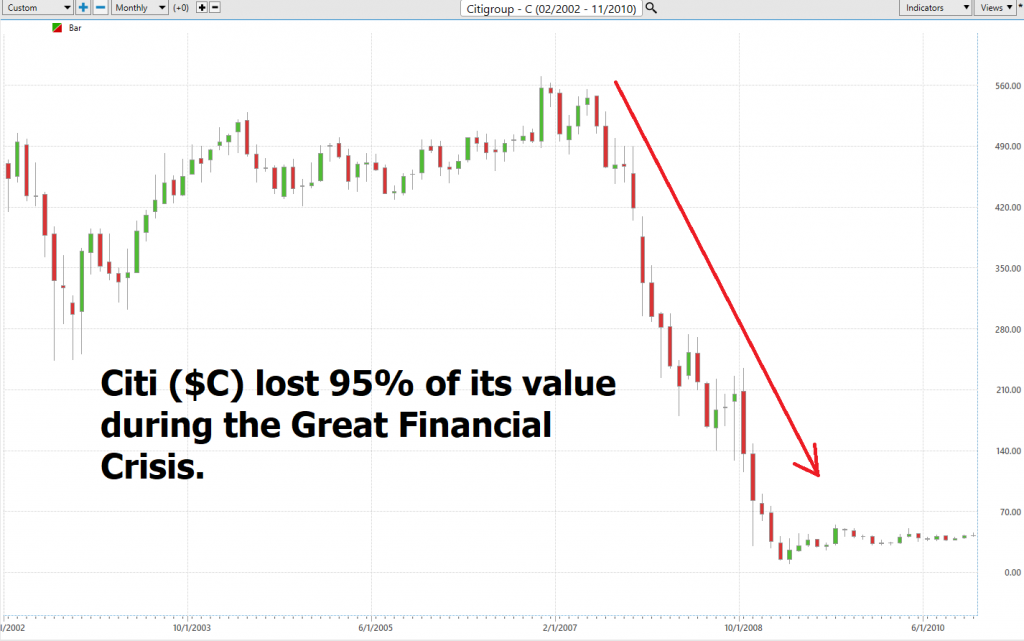
Wall Street analysts have traditionally viewed Citigroup as a major player in the financial industry, often considering it a bellwether for the sector’s performance. However, the company has faced ups and downs, including challenges during the 2008 financial crisis, where its stock fell 95% in a matter of weeks which affected its reputation. Nonetheless, it has made efforts to rebuild and strengthen its position.
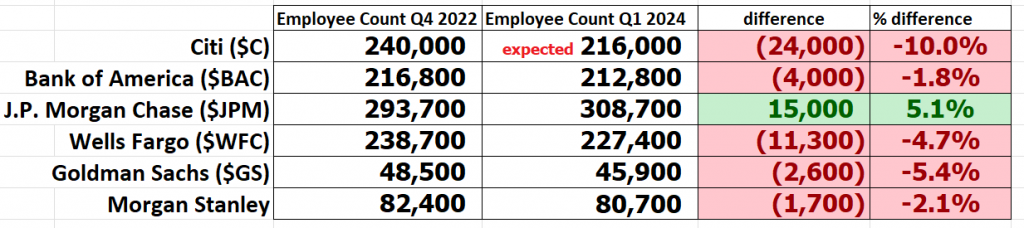
Internally, at Citi they are referring to the restructuring and the layoffs of 10% of its workforce as Project “BoraBora.”
The rumblings on Wall Street are that Citi will cut loose 10% of its workforce in an attempt to reduce expenses. The big question remains: just how many employees will feel the brunt of this corporate restructuring? With Citi already slashing its headcount and shaking things up by scrapping its core operating units, it’s clear that change is afoot. All the largest banks apart from J.P. Morgan Chase have reduced their employees over the last 5 quarters.
Banks report on the number of employees they have every quarter. The following table paints a grim picture of the sector.
While $C has had a healthy rally over the last quarter it has some severe headwinds to contend with. Many analysts are rightfully concerned about the commercial real estate sector and the effect that will have on bank portfolios. Also, it was only 10 months ago that the United States had a banking crisis. This crisis to a large degree was created by banks owning U.S. government Treasury Bonds in leveraged portfolios. Since March 2020 Treasuries have lost as much as 46% of their value. In highly leveraged portfolios the amounts are 2x to 5x as much.
When the banking crisis occurred, the Fed rushed in and allowed banks to not mark to market their Treasury Bond losses and agreed to loan banks the funds to make them 100% whole.
While this offered a short-term solution, the longer-term problem still exists, which is trying to understand how much more risk is there in U.S. Treasuries? Stated another way, how does the U.S. government fund their obligations and operations when Treasury auctions in the United States have been very poorly received over the last several years.
Last month, Citi reorganized itself into five key business units, including trading, banking, services, wealth management, and US consumer offerings. They also axed a whopping 60 management committees, all in the name of cutting costs and streamlining operations. This is poised to become the largest restructuring they’ve seen in two decades.
When analysts reached out to Citi for a comment on these headcount reductions, Citi spokespeople played it coy. They said they’d spill the beans on “Project Bora Bora” when they report fourth-quarter earnings on January 12, 2024. A bit of a cliffhanger, isn’t it?
The banking sector, recently beleaguered by the SVB Financial and First Republic Bank fiascos, has shown resilience. JPMorgan Chase, Citigroup, and Wells Fargo, the trinity of American banking, have posted robust earnings, defying the gloomy predictions that have dogged the industry. This resurgence is a testament to the sector’s inherent strength and adaptability.
And let’s not forget the financial impact of all this. How much will these job cuts cost? Well, it’s expected to hit the balance sheet in the fourth quarter, but the bank’s lips are sealed on the exact numbers until their earnings release on January 12th.
Buffett’s Berkshire Hathaway, a conglomerate that mirrors the man’s investment philosophy, has had its share of missteps. Yet, the Berkshire Hathaway portfolio, a tapestry of diverse holdings, mostly resonates with the wisdom of its architect. Two of its jewels, Citigroup, and another J.P. Morgan Chase, stand out as worthy of investor attention.
Citigroup, often overshadowed by its banking brethren, emerges as a compelling choice, not merely for its robust 5% dividend yield but for the transformative strides under CEO Jane Fraser. Fraser’s crusade to streamline the behemoth, potentially leading to layoffs and a strategic withdrawal from unprofitable international markets, is a bold gambit that could reinvigorate the struggling giant.
The banking stocks, currently undervalued, might present a tantalizing opportunity for the discerning investor. The sector, buoyed by a favorable economic outlook and easing interest rates, is poised for a rebound. In this landscape, Buffett’s long-term vision and the resilience of the banking giants offer a roadmap for navigating the tumultuous waters of the market.
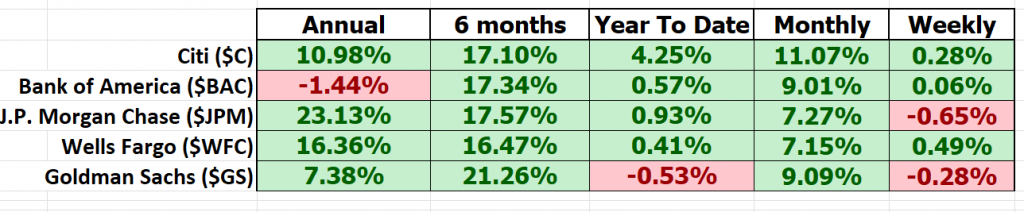
But when you compare the performance of the banking sector stocks you can quickly see that they have been much stronger than analysts anticipated but they are still underperforming the broader stock market indexes.
The top 5 money center banks are releasing earnings on Friday, January 12th and these reports will be the key drivers for the sector and most likely the markets. Despite the economic headwinds, banks are holding up better than expected. Loan losses? Manageable. Interest rates? They’re helping more than hurting. The major concerns among traders and investors is the commercial real estate sector which is facing as high as 25% vacancies in the larger cities and high probability of default. Commercial Real Estate landlords were unprofitable when interest rates were 1%. Now with huge vacancies and substantially higher interest rates the smell of risk is everywhere.
Regional banks across the United States are facing a crisis that could have far-reaching implications for our economy and local governments. These banks, already grappling with significant mark-to-market losses on their substantial Treasury bond portfolios, are now confronting a potential catastrophe in their commercial real estate loan portfolios, which account for a staggering 18 percent of their lending.
The scenario is stark: if property developers begin to default on their loans at a significant rate, we could witness a domino effect of catastrophic proportions in numerous U.S. cities.
The implications of such a crisis are profound. Not only would it spell disaster for the regional banks – with the potential failure of at least 200 of them – but it would also wreak havoc on local government finances. This is a situation that demands immediate attention and action from our policymakers and financial leaders.
Wall Street is hoping for great earnings from the major money center banks. Should this occur, they can buy time to address all of the problems associated with their financial restructuring.
In this weekly stock study, we will look at and analyze the following indicators and metrics as are our guidelines which dictate our behavior in deciding whether to buy, sell, or stand aside on a particular stock.
- Wall Street Analysts’ Estimates
- 52-week high and low boundaries
- Best Case – Worst Case Analysis and Takeaways
- Vantagepoint A.I. Forecast (Predictive Blue Line)
- Neural Network Forecast
- Daily Range Forecast
- Intermarket Analysis
- Our Suggestion
We don’t base our trading decisions on things like earnings or fundamental cash flow valuations. However, we do look at them to better understand the financial landscape that a company is operating under.
Wall Street Analysts’ Estimates
Based on 17 Wall Street analysts offering 12-month price targets for Citigroup in the last 3 months. The average price target is $57.82 with a high forecast of $85.00 and a low forecast of $43.00. The average price target represents an 8.1% change from the last price of $53.48.
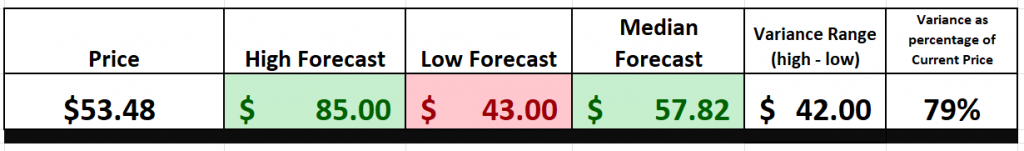
We pay attention to the variance between the most bullish and most bearish analysts. By doing so we can see the different expectations. Currently that variance is 79% of the current price which is exceptionally high. This metric tells us that there is LARGE levels of disagreements amongst top analysts on what all of the numbers mean. The result is to expect greater than normal volatility moving forward.
52-Week High and Low Boundaries
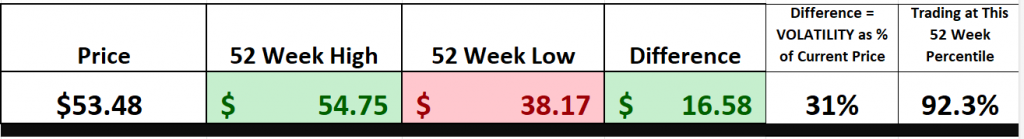
Looking at the Long-Term chart of $C provides us with the 52-week high and low boundaries. Over the past year we have seen $C trade as low as $38.17 and as high as $54.75. The annual trading range has been $16.58. Currently, the stock is trading at the 92nd percentile of its annual range.
We can also see that the annual trading range of $16.58 is currently equal to 31% of the current price. This metric is a simple and fast way to measure historic volatility. It is important because it tells us that if the future is like the past, we should anticipate that prices could be 31% higher and or lower over the next 12 months.
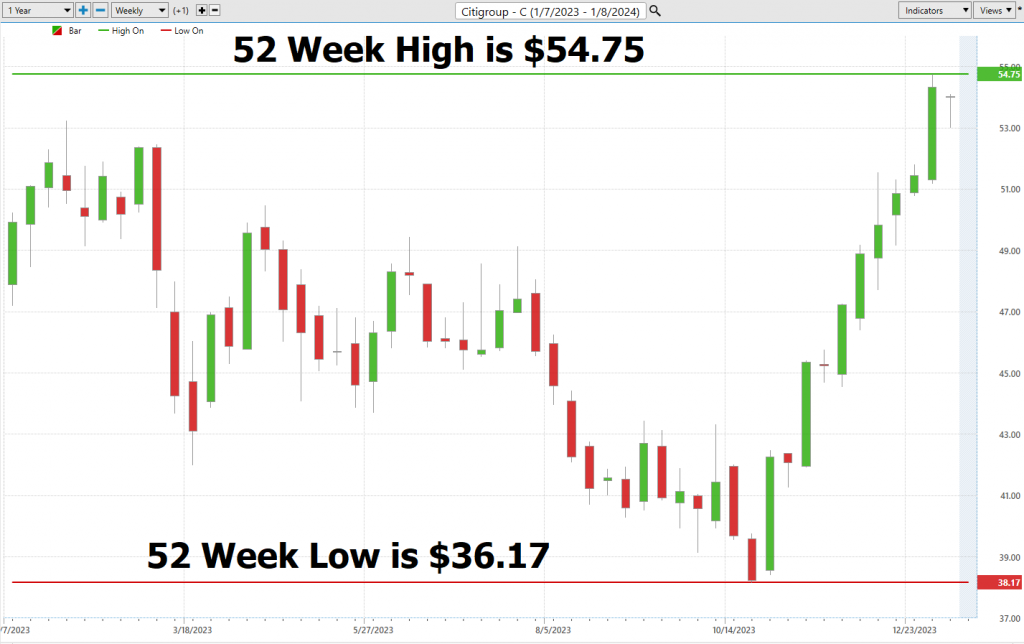
You can quickly understand the volatility inherent in $C when you study the chart. The strange thing is that $C stock rose when rumors began circulating that $C would be cutting 10% of its workforce.
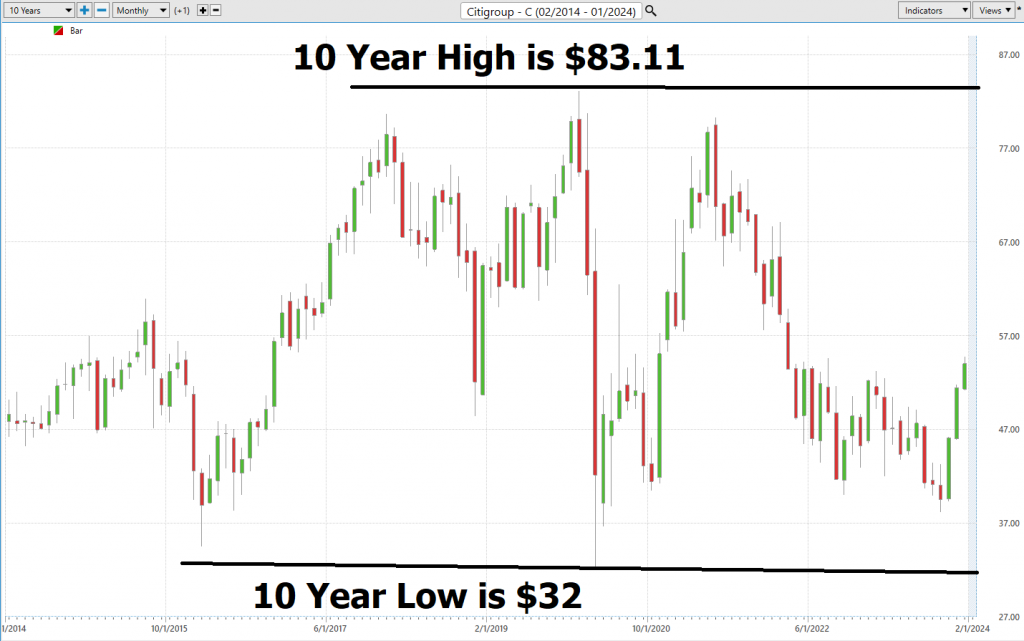
But when we zoom out and study the 10-year chart we can better understand the volatility and depressed nature of $C stock. Observe how in January 2020, pre-pandemic $C posted its 10 year high at $83.11. Two months later the stock crashed to $32, and it has spent the last 4 years consolidating and trying to recover.
Over the last decade $C is up a paltry 8.6% which is a miserable ROI for a decade worth of volatility and risk. This reason alone explains why we are noticeably short term in our trading horizon. Adding concern to the analytics is that over the past 10 years $C has been trading only at the 42nd percentile of its ten-year range.
The charts show very clearly that there is great uncertainty and lack of a clear-cut long-term trend at $C.
Let me tell you something that every savvy investor and trader ought to know – and that’s the undeniable importance of keeping a close eye on those 52-week boundaries on a chart. I can’t stress this enough, because trends, they’re not just some abstract concept. They’re real, and they’re powerful, and you can see ’em clear as day on a 52-week chart.
Now, why are these boundaries so darn crucial? It’s simple, really. They tell you the story of a stock’s journey over the past year. When you study a 52-week chart, you’re getting a front-row seat to the price action. You can see where the highs were, where the lows hit rock bottom, and, most importantly, where the big players were buying and selling. Those boundaries, they’re like the footprints of the market giants, and you’d be a fool not to pay attention.
But it’s not just about hindsight. These charts can give you valuable insights into what might lie ahead. See, when a stock approaches its 52-week high or low, it’s like a signpost telling you, “Hey, something’s happening here.” Whether it’s a potential breakout or a warning of a reversal, these boundaries can guide your trading decisions. So, remember, folks, when you’re in the game of investing or trading, always keep those 52-week boundaries on your radar. They might just be your ticket to success in the market.
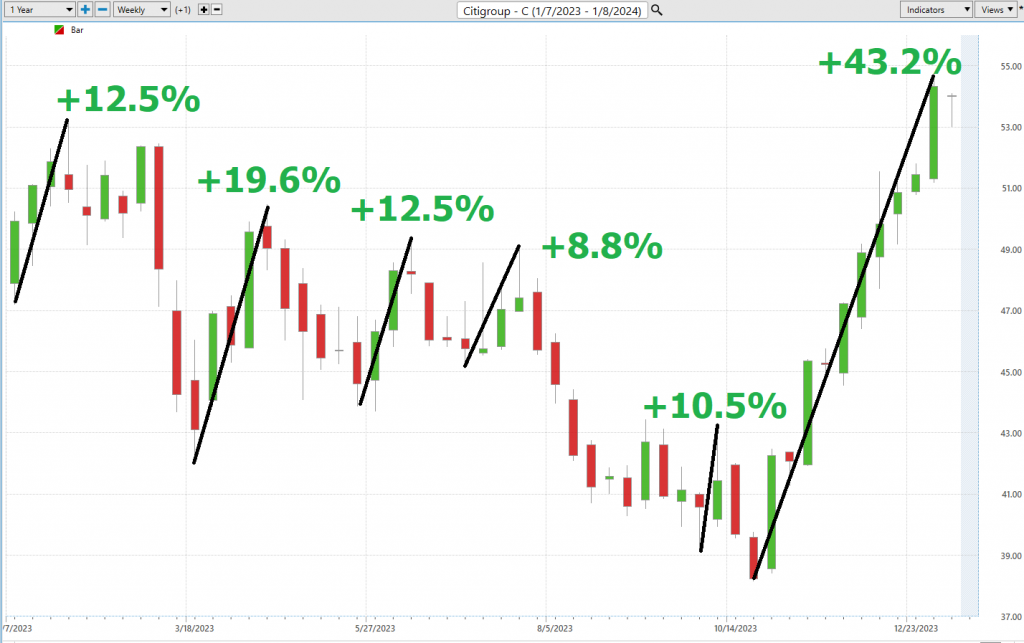
Best Case – Worst Case Scenario
There’s one crucial insight you should always have up your sleeve – and that’s comparing the magnitude of rallies to the size of the declines. It’s not just a fancy chart trick; it’s about understanding the risk and reward potential of an asset, and trust me, for us traders, it’s absolutely imperative. We can’t afford to overstay our welcome or tell the trend what it has to do.
So, how do we get this quick understanding? Well, it all starts with that long-term 52-week chart. It’s a treasure trove of information. By connecting those high points and low points over the past year, you’re creating a visual roadmap of how this asset behaves. You can see how fast it climbs and how swiftly it drops. And let me tell you, it’s worth doing this baseline analysis every single time you consider investing or trading. It’s your financial GPS, showing you the potential risks and rewards right there on the screen.
Here is the best-case analysis on $C:
Followed by the worst-case analysis:
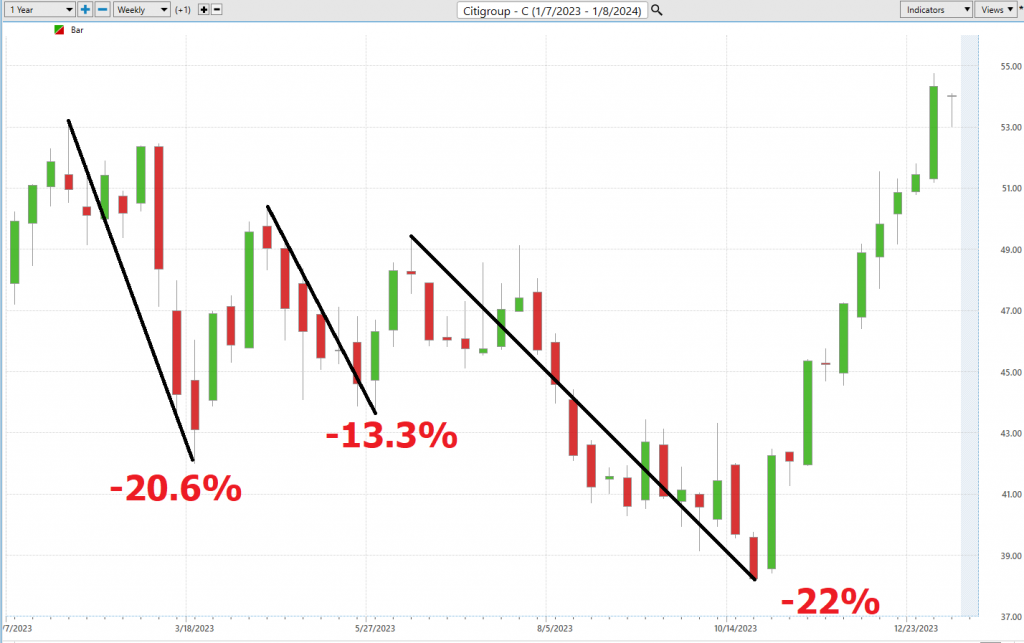
Now, you’ve got to be prepared for anything in this game. By comparing the rallies to the declines, you can quickly see how long it took for those wins and losses to manifest themselves on the weekly chart. The message is clear from this type of analysis: Know you risk and don’t overstay your welcome.
We’ve got to put this into perspective, so let’s compare the performance of $C to the major broad market indexes.
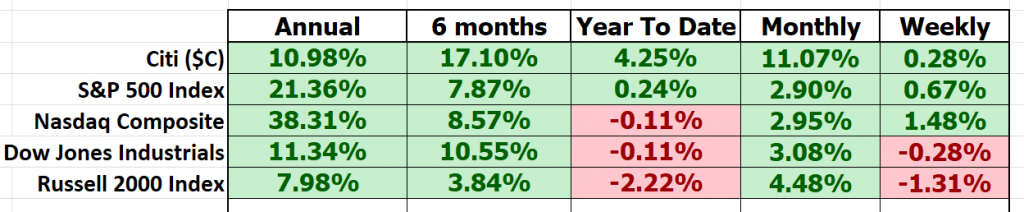
Finally we need to compare the volatility of $C to the broader market. This is done by looking at BETA. Beta is a measure of a stock’s volatility in relation to the overall market. A beta of 1 indicates the stock tends to move in line with the market, while a beta greater than 1 suggests higher volatility, and a beta less than 1 implies lower volatility compared to the market. $C has a beta of 1.56 which tells us that it is 56% more volatile than the broader market.
Citi ($C) has consistently underperformed the broader market indices across various time frames, warranting a closer examination of its volatility, particularly in relation to market heavyweights. In the world of finance, this assessment is encapsulated by the metric known as “BETA.” Amidst the complexities of Wall Street, beta (β) emerges as a financial yardstick akin to the Richter scale for stocks. It quantifies a stock’s sensitivity to the broader market’s movements, offering insights into its behavior during market fluctuations, often benchmarked against major indices like the S&P 500.
So, in $C we can see that it is much more volatile than the broader market and while it has outperformed over the last six months it is still lagging against the longer term’s performance metrics.
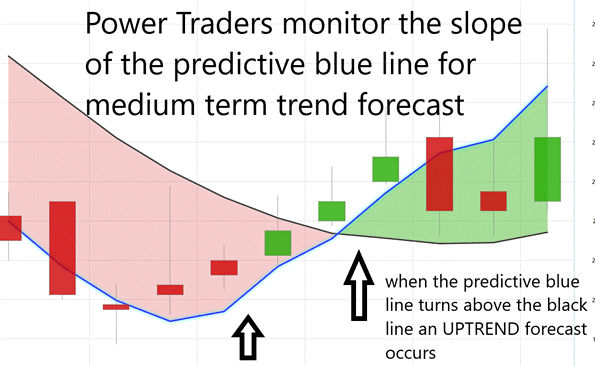
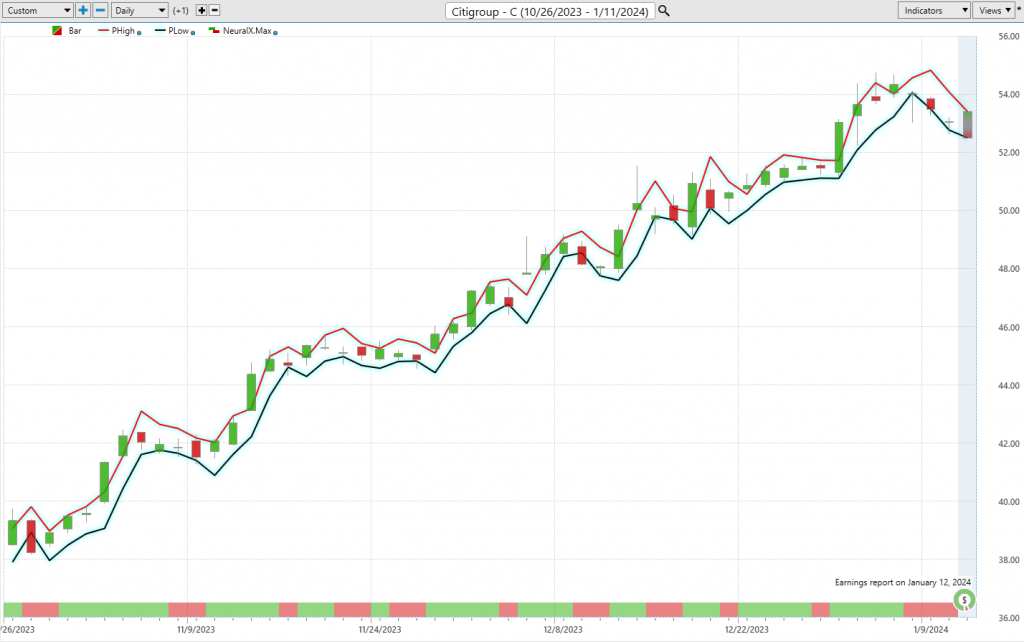
Vantagepoint A.I. Forecast (Predictive Blue Line)
On the following chart you will see the power of the VantagePoint Predictive blue line which determines the medium term trend price forecast.
The guidelines we abide by are as follows:
- The slope of the predictive blue line determines the trend forecast and general direction of $C.
- Ideally, the VALUE ZONE is determined to try and find buy opportunities at or below the predictive blue line, or to sell opportunities above the predictive blue line during a downtrend.
In today’s fast-paced, ever-evolving market, traders are always hunting for the most effective tools and strategies to navigate this intricate financial landscape. That’s where VantagePoint Software comes into play, leading the way with innovative artificial intelligence that provides traders with a precision-focused view of risk and reward analysis. And at the heart of this groundbreaking innovation is the predictive blue line, your financial North Star in forecasting market trends.
Think of this predictive blue line as your guiding light, a dependable indicator of market direction. When it’s trending upward, it’s like a neon sign screaming “market on the rise,” paving the way for astute buying opportunities. Conversely, a downward slope signals a market heading south, hinting at potential selling opportunities.
But there’s more to this tale. The predictive blue line doesn’t just tell you where the market’s headed; it also pinpoints the coveted ‘value zone.’ In an uptrend, this zone, nestled just below the blue line, is where savvy investors look to make their move. It’s a strategic convergence of price and intrinsic value, revealing the real worth of an asset.
Now, let me make one thing clear, this predictive tool is no shot in the dark. It’s the result of VantagePoint’s groundbreaking A.I. technology, a potent blend of neural networks and intermarket analysis that delves deep into an asset’s price drivers. It leverages A.I. to expose the core value of that asset, providing traders with a strategic advantage.
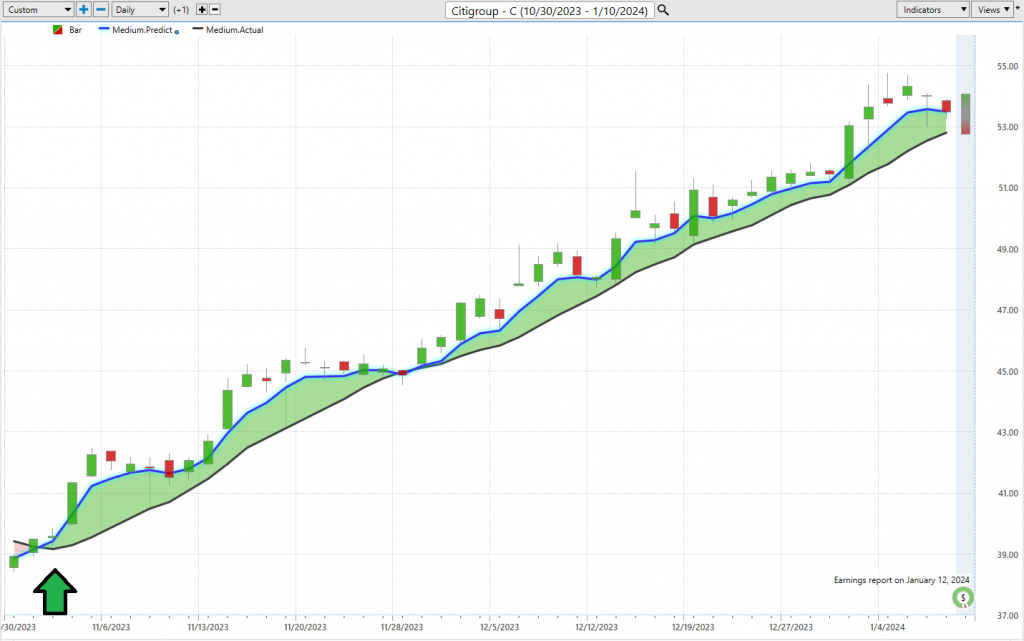
Alongside the predictive blue line, we’ve got the black line, a reflection of recent market history, essentially our market rearview mirror. It tracks the 10-day moving average of prices, offering context to the blue line’s forward-looking insights. The interplay between these lines is where the real magic happens, giving traders a clear view of market momentum and emerging opportunities. So, my friends, if you’re looking for an edge in the market, keep an eye on that predictive blue line – it just might be your ticket to success.
Normally an UPTREND forecast occurs when you have two consecutive closes above the predictive blue line. On the downside the inverse is also true. A downtrend forecast normally occurs when you have two consecutive closes below the predictive blue line.
Neural Network Indicator (Machine Learning)
At the bottom of the chart is the Neural Network Indicator which predicts future short-term strength and/or weakness in the market going out 48 to 72 hours. When the Neural Net Indicator is green it communicates strength. When the Neural Net is Red it is forecasting short term weakness in the market. When it is yellow it is anticipating sideways prices.
A Neural Net is a computational learning system that uses a network of functions to understand and translate massive amounts of data into a desired output, consistently monitoring itself and improving its performance.
Think of it as a computational brain, constantly chewing through colossal amounts of data and spitting out the answer’s we traders crave. It’s like a self-improving student, always learning and getting better. In our trading world, Neural Networks are AI-powered wizards that study market data, learn from the past, and keep evaluating risks and opportunities. They sift through technical indicators, chart patterns, global events, you name it. And here’s the kicker – they can spot connections and opportunities faster than any human trader.
But there’s more to it. These Neural Networks, well, they’re trainable algorithms that mimic the human brain. They can be taught to assess risk and potential reward and make high-probability forecasts based on history. That’s a game-changer.
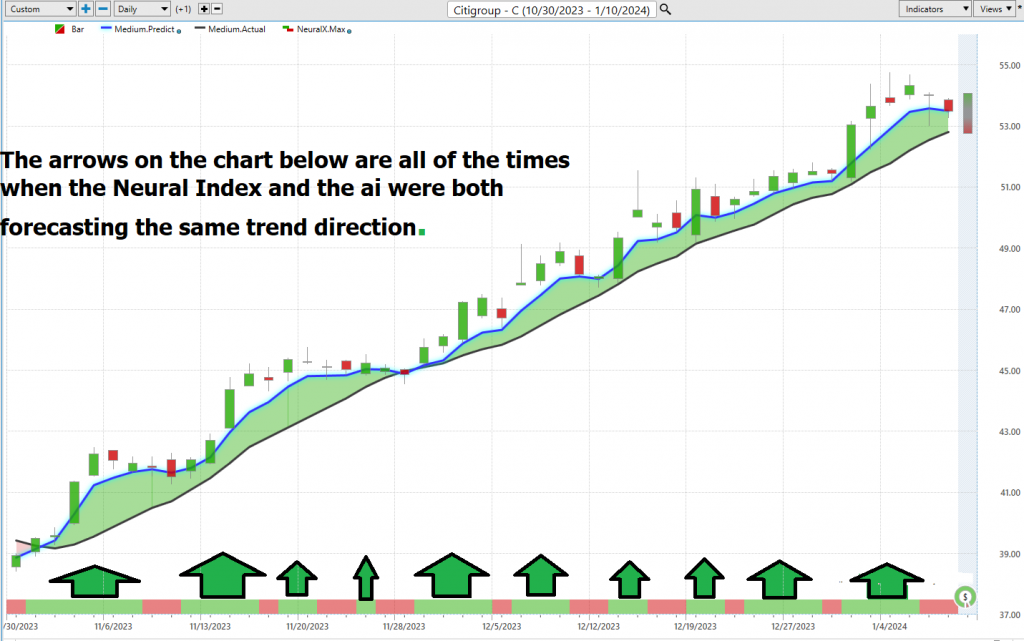
Now, for all you Power Traders out there, here’s the takeaway – cross-reference that chart with the predictive blue line and the Neural Network Indicator. That’s how you create those optimal entry and exit points. These Neural Networks, they’re the next-gen trading tools that can uncover patterns and interdependencies that traditional methods miss. When the A.I. forecast and the Neural Net are both green, that’s a buying opportunity. And when they both turn red, well, that’s your cue to sell. So, remember, Power Traders, always keep an eye on both the Neural Network and A.I. – they might just lead you to some statistically sound trading opportunities.
Power Traders are always looking to apply both the Neural Network and A.I. to the markets to find statistically sound trading opportunities.
VantagePoint Software Daily Price Range Prediction
One of the powerful features in the VantagePoint Software which Power Traders use daily is the Price Range prediction forecast. After determining a trading opportunity this is the tool that Power Traders rely on to fine-tune their market entries and exits – the Price Range prediction forecast. This is the secret sauce that helps those traders make their moves with precision.
Now, let’s talk numbers because we all know data is king in the trading world. We’ve got the metrics that lay out the average trading ranges over the past year – daily, weekly, and monthly.
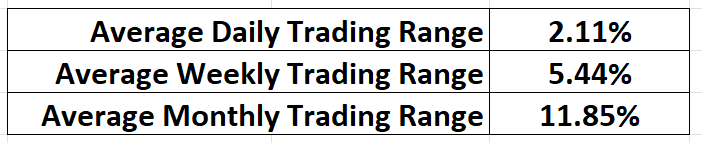
This is the kind of information that gives traders a solid foundation to work with. But it’s not just about knowing the numbers; it’s about deciding when and where to pull the trigger. These values are market history. They are all based on the past. Traders need to know how to implement them moving forward.
Picture this: every day, traders are wrestling with the question of where to make their market moves. It’s like trying to hit a moving target. But here’s where VantagePoint’s A.I. swoops in to save the day. The Daily Price Range Forecast is your trusty companion, helping you pinpoint where to enter and exit the market.

Take a look at that chart, and you’ll understand something clearly at last. It doesn’t just tell you where the market’s been; it shows you where it’s likely to go. And that’s gold for traders. This chart isn’t just about buying and selling; it’s about managing risk. See those dark lines on the chart? Placing your protective sell stops just below them can be a smart move to minimize your risk in a trade.
The upper and lower bands of the price range forecast create a clear channel of trading activity. Swing traders, pay attention – this is your bread and butter. Look for buying opportunities at the bottom of that predicted channel and keep an eye out for selling opportunities near the top band.
In this ever-evolving market, having the Daily Price Range Forecast at your disposal can be the difference between making a winning move or being left in the dust. Power Traders, take note – this is your tool for precision in a world of uncertainty.
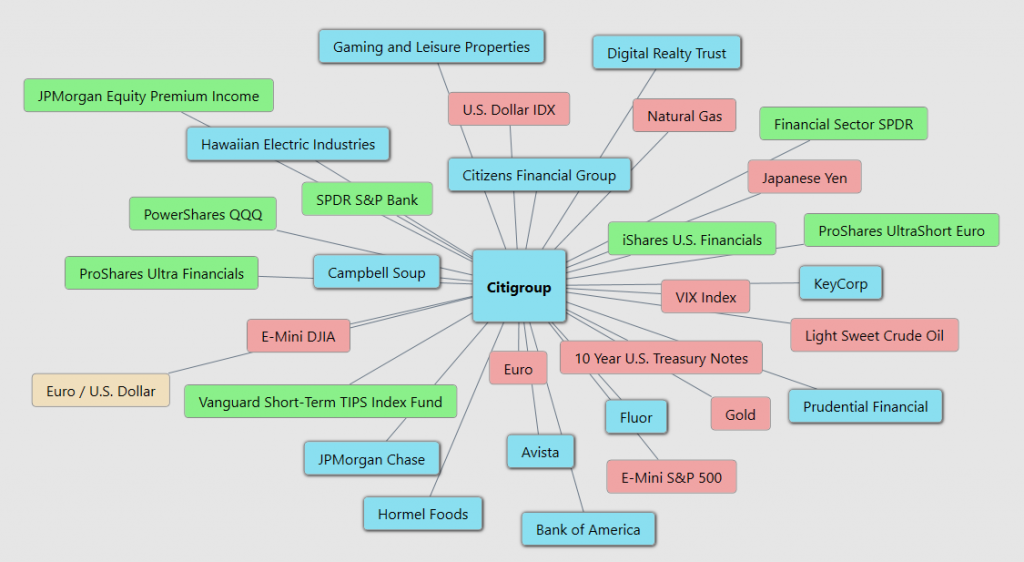
Intermarket Analysis
Intermarket analysis is a critical tool employed by traders to assess various markets and asset classes, enabling them to formulate trading strategies based on the relationships between these markets. It revolves around examining statistical price correlations among different assets. In today’s interconnected global marketplace, where everything is interrelated, intermarket analysis helps traders gain insights into the broader market environment. By studying these correlations, traders can identify potential opportunities and make informed decisions regarding their entry and exit points. For example, changes in commodity prices may signal future developments in related currency pairs, and signals from large-cap stocks can be used to anticipate movements in small-cap stocks. In essence, intermarket analysis equips traders with the knowledge needed to navigate the complexities of the financial world.
Now, let’s dive into this discussion, folks, because we’re talking about the power of understanding the truth behind price movements. In trading, it’s not enough to be captivated by headlines and narratives; we need to comprehend the cause and effect of price changes. And how do we find the underlying cause of it? Through intermarket analysis, of course! It’s the secret sauce that lets us peek into the interconnected web of global markets. Think about it – interest rates, crude oil prices, the dollar’s volatility, and a thousand other variables – they all affect the decisions companies make. And when we’re talking about $C’s price action, studying the key drivers is like holding a magnifying glass to the truth. This graphic shows us the major ETFs that have a stake in $C, giving us a microcosmic view of what’s been pushing it higher.
Our Suggestion
Charts are the footprints of money flows.
If you think RECESSION will happen in 2023 either domestically or worldwide, $C is a bad purchase.
However, if you think that the FED will engineer a soft landing so that we can avoid recession in the economy, betting on $C will be a winning bet.
Independent traders will focus on the short term and look for swing trading opportunities.
Currently, as this gets published, the long terms trend is UP.
Momentum is UP. There is strong resistance at the 52-week high of $54.75.
As we kick off 2024, Wall Street’s got its fingers crossed for a smoother ride ahead. But let’s not kid ourselves, because the road’s looking bumpy. Big Banks are about to roll out their fourth-quarter earnings, starting with the show on Friday, January 12, and brace yourselves, because it might be a tough one. These banks are expected to report lower profits, thanks to setting aside cash for souring loans and shelling out more to depositors.
CEO, Jane Fraser, is on a mission to trim the fat off what some folks consider one of Wall Street’s chubbiest banks. She’s taken the ax to some units, like municipal-bond and distressed-debt trading businesses and sold off chunks of the international retail business. But here’s the kicker, the stock’s been lagging behind rivals like JPMorgan Chase & Co. and Wells Fargo & Co. in 2023. So, the pressures on Jane to prove that this time around, things will be different.
Turning this ship around is no walk in the park. It’s about overhauling the bank, improving returns, and showing that Citigroup can set and meet financial goals. But Fraser’s got to do all this without wrecking staff morale or undermining the strength of one of the world’s most global banks.
So, what’s on Jane’s to-do list for the year? First, she’s taking a sledgehammer to the bureaucracy that’s been weighing the bank down. That’s been going on since September, with more cuts expected in the coming months. Jane’s also simplifying the bank into five key units and slashing 13 layers of management down to eight. And let’s not forget, she’s got to deal with new capital rules from U.S. regulators, prep Citigroup’s Mexican retail unit, Banamex, for a public listing in 2025, and try to offload the Polish retail business.
When Citigroup releases those fourth-quarter results, we’ll get the lowdown on more job cuts and how much those severance packages are costing.
Wall Street’s expectations are to report lower profits for the fourth quarter after they set money aside to cover souring loans while also paying more to depositors.
Put $C firmly on your radar and use the artificial intelligence and to guide your trading decisions. Banks’ profits will likely be squeezed as they set aside more reserves in the fourth quarter to prepare for customers to default on the loans. Profits could also be curbed by banks paying more to keep depositors’ money in their accounts. Analysts expect $C earnings to be 20% lower than 4th quarter from one year ago.
I personally expect we’ll see greater than normal volatility this quarter and it will present numerous trading opportunities.
$C looks vulnerable to a pullback. The narrative on the stock is quite confusing as it is quite possible that $C will reduce expenses and become more profitable after cutting 10% of its employees.
Based upon the trading range possibilities we will continue to look for trading opportunities based upon the Vantagepoint Daily Range Forecast.
Watch the 52-week highs and the volume as prices reach those levels. We like the reality that the stock is highly volatile, which gives our trading style an edge. We will continue to explore the long side of the market for short-term swing trading opportunities.
Our recommendation is to follow the A.I. trend analysis as outlined in this stock study and practice good money management on all trades.
We will re-evaluate daily based upon:
- New Wall Street Analysts’ Estimates
- New 52-week high and low boundaries
- Vantagepoint A.I. Forecast (Predictive Blue Line)
- Neural Network Forecast
- Daily Range Forecast
The short term trend in $C is down. We want to get long but will not disrespect the current trend.
Let’s Be Careful Out There!
It’s Not Magic.
It’s Machine Learning.
Disclaimer: THERE IS A HIGH DEGREE OF RISK INVOLVED IN TRADING. IT IS NOT PRUDENT OR ADVISABLE TO MAKE TRADING DECISIONS THAT ARE BEYOND YOUR FINANCIAL MEANS OR INVOLVE TRADING CAPITAL THAT YOU ARE NOT WILLING AND CAPABLE OF LOSING.
VANTAGEPOINT’S MARKETING CAMPAIGNS, OF ANY KIND, DO NOT CONSTITUTE TRADING ADVICE OR AN ENDORSEMENT OR RECOMMENDATION BY VANTAGEPOINT AI OR ANY ASSOCIATED AFFILIATES OF ANY TRADING METHODS, PROGRAMS, SYSTEMS OR ROUTINES. VANTAGEPOINT’S PERSONNEL ARE NOT LICENSED BROKERS OR ADVISORS AND DO NOT OFFER TRADING ADVICE.