The A.I. stock spotlight this week is Canadian Natural Resources Ltd. ($CNQ)
Canadian Natural Resources didn’t exactly spring from the ground like oil itself, but it might as well have. Founded in the late 1980s when energy was less fashionable than disco, it grew from a modest exploration outfit into a sprawling hydrocarbon empire, survived multiple oil crashes that wiped out weaker players, bulked up through acquisitions when competitors were gasping for air, now pumps out a staggering volume of crude and natural gas across North America, and remains relevant because when energy prices move, this company moves with them like a lever strapped to the global economy.
At its core, this is a company that drills holes in the ground and sells what comes out. It operates across oil sands, conventional crude, natural gas, and offshore production, which is Wall Street’s way of saying it has its fingers in every greasy pie. The oil sands operations are the heavyweight champion, producing long-life assets that behave more like factories than wells. Conventional oil and gas add flexibility, letting the company ramp up or down depending on prices. The revenue engine is simple. Sell oil, sell gas, collect cash, repeat. Its customers are refineries, utilities, and anyone else who needs molecules that burn. Headquarters sit in Calgary, management has a reputation for operational discipline bordering on stubbornness, and the workforce numbers in the thousands. Competitors include the usual suspects in large-cap energy, but the company’s advantage is scale, cost control, and assets that don’t decline as fast as your average shale well.
Financially, this is where things get interesting and where many traders get it wrong. Revenue moves with commodity prices, which means it looks brilliant in good times and merely competent in bad ones. Margins can expand dramatically when oil prices rise because costs don’t move nearly as fast as revenue. Cash flow is the real story here. This company prints it when energy markets cooperate. Debt exists, as it does in all capital-heavy industries, but it has been managed down over time with the kind of discipline that would make a banker smile politely. The business is capital intensive, yes, but these are long-life assets, not treadmill drilling programs. Traders often misunderstand this and treat it like a fragile shale operator when in reality it behaves more like a slow, steady cash machine with occasional bursts of brilliance.
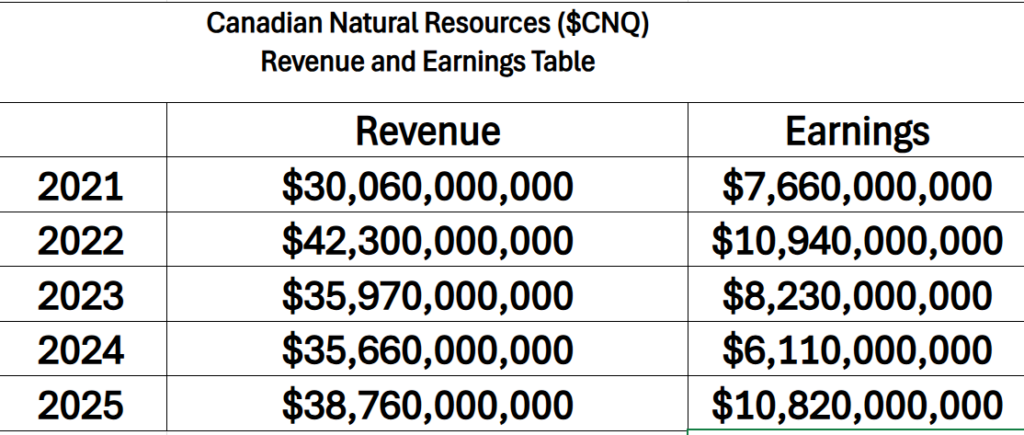
When you study the revenue and earnings associate with $CNQ you begin to appreciate the volatility of the Oil and Gas sector.
Right now, traders are asking a handful of very simple but very important questions. First, how long can energy prices stay elevated without breaking global demand. Second, is this company nearing peak production or still climbing. Third, will governments decide that energy companies are too profitable for their own good and start tinkering with taxes or regulations. Fourth, how sustainable are the dividends and buybacks if prices wobble. Those questions matter because the stock doesn’t trade on what happened last quarter. It trades on what the next few quarters might look like.
Over the past month, the news flow has been about as subtle as a sledgehammer. Energy prices have remained firm, geopolitical tensions have kept supply concerns alive, and investors have rediscovered that oil and gas companies actually make money when commodities rise. What is new is not that energy is profitable. That has been true for a while. What is new is that capital is rotating back into the sector after spending years chasing technology stocks that promised the future but delivered volatility. What is already priced in is the obvious benefit of higher oil prices. What Wall Street may be missing is just how disciplined these companies have become. They are not racing to oversupply the market like in previous cycles. Expectations could be wrong if analysts assume a quick reversion to lower prices. The market is telling a different story.
The stock has been climbing, and not by accident. Over the past 90 days, the move has been driven by rising crude prices, improved sentiment toward energy, and a broader rotation out of overcrowded trades into tangible assets. Year to date, the gains reflect a continuation of that trend, with investors favoring companies that generate real cash instead of hypothetical profits. Compared to its sector ETF, it has held its own and in many cases outperformed because of its scale and operational efficiency. The narrative helping the stock is simple. Energy is back. The data that actually matters is even simpler. Cash flow is strong, production is steady, and returns to shareholders are real. Analysts who support the stock tend to point to these fundamentals, and they are not wrong. Where analysts often fail is assuming that the cycle will behave like it always has. This time, supply discipline is tighter, and that changes the math.
Opportunities here are not hard to find. If energy prices stay firm or rise further, this company benefits disproportionately because of its cost structure and production scale. If global demand remains resilient, it continues to print cash. The biggest upside surprise would be a sustained period of elevated oil prices combined with continued capital discipline across the industry. That is the scenario where this stock can keep grinding higher. On the other hand, risks are just as real. A sharp drop in commodity prices would hit revenue quickly. Regulatory changes could impact profitability. The biggest blind spot for traders is assuming that because the stock has gone up, it must keep going up. Energy has a long history of reminding people that cycles still exist.
In the end, this is a stock for traders who understand cycles and respect commodities. It is not a story stock. It is not going to promise you artificial intelligence or revolutionize your daily life. It digs, it drills, and it sells what it finds. For the trend to continue, energy prices need to remain supportive, capital discipline must hold, and demand cannot collapse. Trouble would show up early in the form of falling oil prices, weakening cash flow, or a sudden shift in sentiment away from energy. Until then, the trend is doing what trends do when nobody believes in them. It keeps going.
In this weekly stock study, we will look at an analysis of the following indicators and metrics which are our guidelines which dictate our behavior in deciding whether to buy, sell or stand aside on a particular stock.
Wall Street Analysts Ratings and Forecasts
52 Week High and Low Boundaries
Best-Case/Worst-Case Analysis
Vantagepoint A.I. Predictive Blue Line
Neural Network Forecast (Machine Learning)
VantagePoint A.I. Daily Range Forecast
Intermarket Analysis
Our Suggestion
While our decisions are ultimately guided by artificial intelligence forecasts, we still take a brief look at the fundamentals to understand the financial landscape in which $CNQ is operating under.
Wall Street Analysts Forecasts
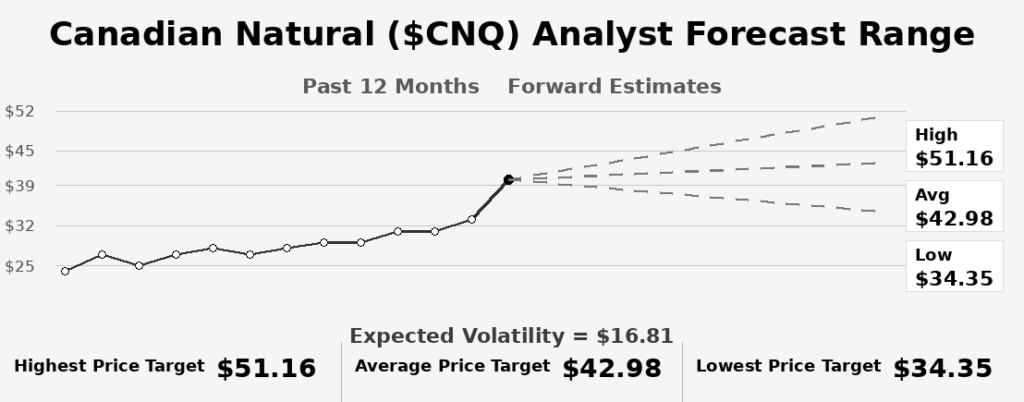
Wall Street just handed us a roadmap, and buried inside it is the only number that really matters. Not the average forecast. Not the headline target. The spread. The disagreement. The fight.
That spread between the highest and lowest forecast is $16.81.
Now take that number and stack it against reality. $CNQ is sitting at $48.98. Do the math and you’re looking at roughly 34.3% expected volatility baked into forward expectations. That’s not background noise. That’s a wide, breathing, money-making range.
Here’s what most traders miss. They stare at the average price target like it’s gospel. It’s not. It’s a compromise. A polite handshake between analysts who don’t agree. The real story is the distance between conviction and doubt. And right now, that distance is telling you one thing loud and clear.
Movement is coming.
When you see a 30%+ implied range, you’re looking at opportunity and at a market that is unsure, reactive, and highly sensitive to new information. That’s exactly where traders get paid.
So the takeaway is simple. Don’t anchor to one price. Trade the range. Respect the volatility. Because when Wall Street disagrees this much, price doesn’t drift.
It moves.
52 Week High and Low Boundaries
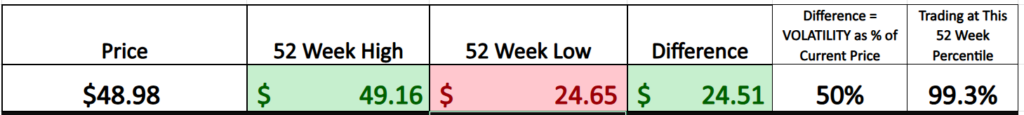
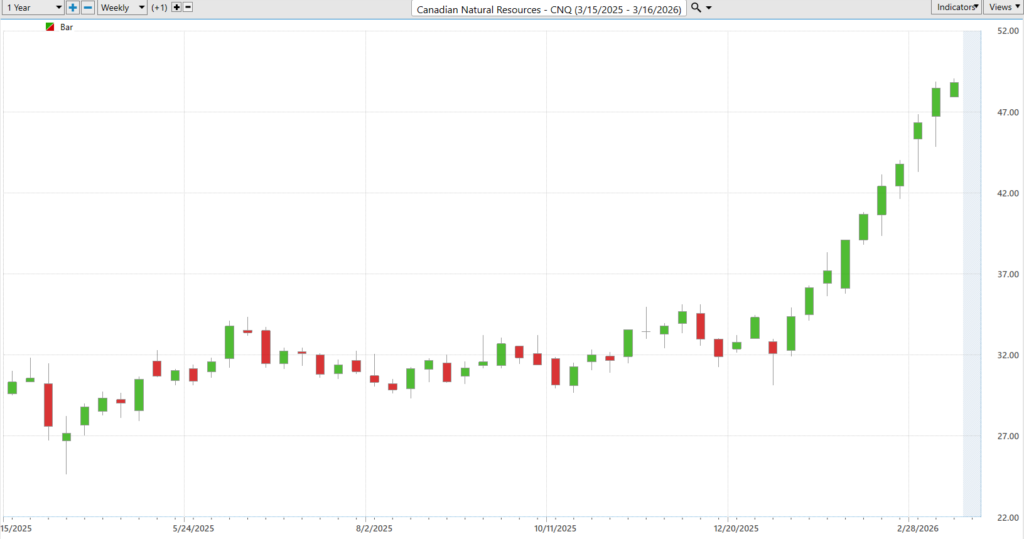
The numbers, on their face, are straightforward. The stock is trading at $48.75, just shy of its 52-week high of $49.16, and a considerable distance from its 52-week low of $24.65. Over the past year, it has carved out a range of $24.51, or roughly 50% of its current price. That is not trivial volatility. But what matters more is where the stock sits within that range. At 98.3% of its 52-week high, it is not merely elevated. It is effectively operating at the upper boundary of its own recent history.
The chart reinforces what the statistics suggest. What began as a period of lateral movement has given way to a more decisive upward trajectory, marked by a consistent pattern of higher highs and higher lows. This is not the erratic behavior of a stock searching for direction. It is the kind of orderly advance that tends to reflect sustained institutional interest. Investors are not simply reacting. They appear to be allocating.
The implication, then, is less about how far the stock has come and more about what that positioning represents. A 50% annual range establishes the context for what is normal. Trading at the very top of that range is not. It signals a market that is pricing in strength, or at the very least, refusing to discount it. The critical question is whether that strength can be maintained. A failure to extend beyond current highs, coupled with a breakdown in the sequence of higher lows, would suggest a reversion toward the middle of the range. Until then, the evidence points to a stock that is not retreating from resistance, but testing it.
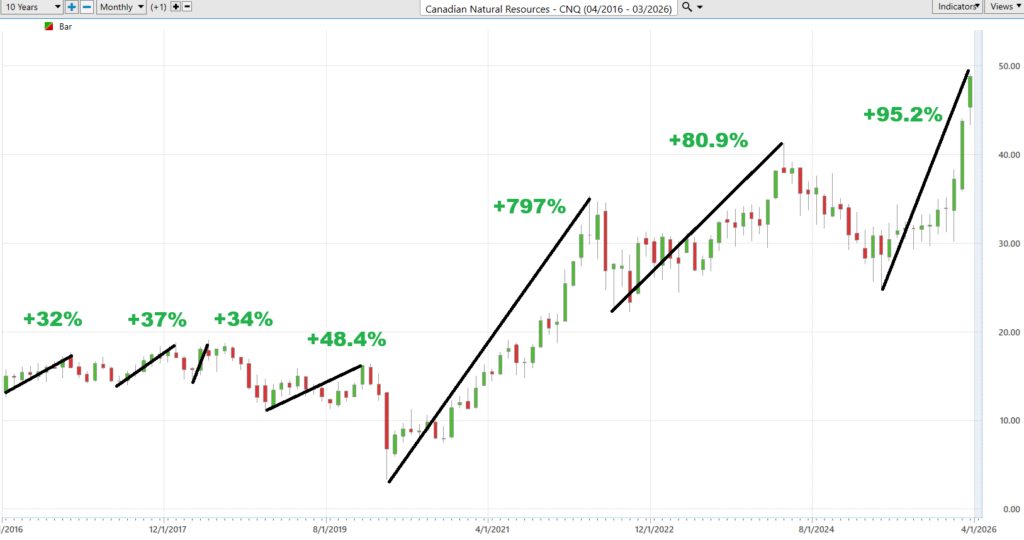
You’re looking at an asset pushing into new 52-week highs and now stretching into fresh 10-year highs, and it tells you demand is overwhelming supply in real time. But here’s where it gets interesting. We never take that signal at face value. We cross reference it with the AI forecast because strength without confirmation can turn into a trap. Now look closer at $CNQ. These rallies aren’t polite, orderly advances. They’re explosive, vertical surges that can rip higher in a hurry. That’s the opportunity. But it’s also the warning. Because when a stock moves like this it can come down just as hard if the trend breaks.
Best-Case/Worst-Case Scenario Analysis
The simplest way to truly understand volatility has been to step back and measure the largest uninterrupted rallies and declines. This very simple exercise provides a practical risk reward profile of any asset. You do not enter a trade just looking at the upside potential. That is Amateurville. You also have to measure the risk which is found in the declines. Once done you can determine position sizing which remains one of the most persistent challenges for traders.
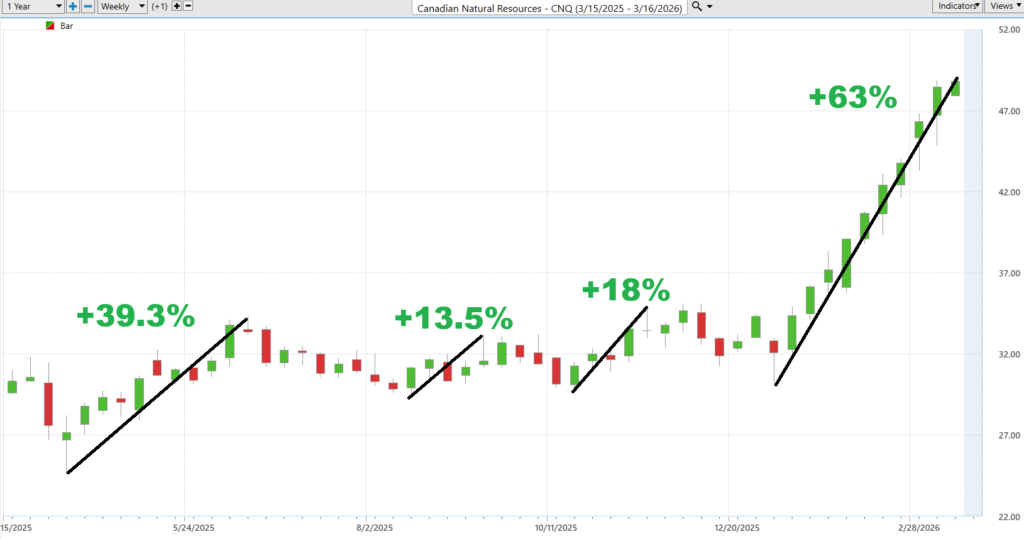
Start with the rallies, because that is where conviction is easiest to see. What stands out is not just that the stock moves higher, but how it does so. The advances tend to unfold in sustained bursts, where momentum builds on itself and price climbs with a kind of persistence that suggests institutional sponsorship rather than retail enthusiasm. These are not fleeting spikes. They are sequences. Each leg higher reinforces the last, creating a staircase effect that, over time, reshapes the entire trend. At a distance, the message is clear. When this asset gains traction, it has a tendency to continue, and often longer than most participants expect.
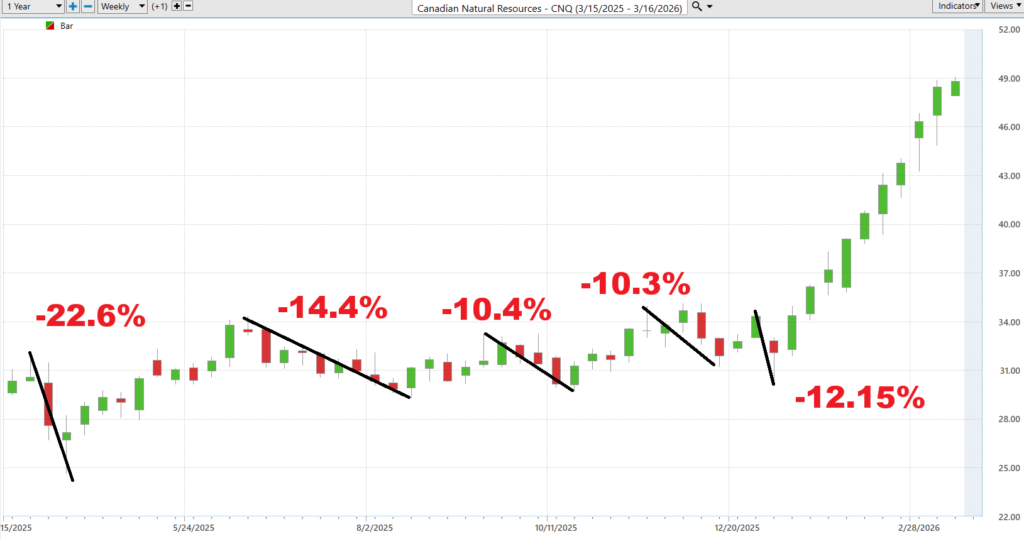
But that is only half the story, and perhaps the more comfortable half. The declines, while less celebrated, are just as instructive. They tend to arrive with less fanfare but no less consequence. Pullbacks unfold in clean, directional moves that can test conviction quickly. They are not chaotic, but they are decisive. And importantly, they often occur after periods of strength, reminding traders that momentum is not a one way street. The market, in its quiet efficiency, rebalances.
Taken together, the sequence of rallies and declines reveals something more nuanced than simple direction. It reveals behavior. This is an asset that trends, but does so with meaningful counter moves that demand respect. For traders, the implication is straightforward but often ignored. Opportunity exists in the upside, but survival depends on understanding the downside. Position sizing, then, becomes less about ambition and more about alignment with the asset’s natural rhythm.
There is only one honest way to determine whether a stock is a leader or a laggard, and that is to measure it against the broader market averages. Everything else is storytelling. Relative performance strips away the narrative and replaces it with evidence. When you line this up against the major benchmarks, the conclusion becomes difficult to ignore.
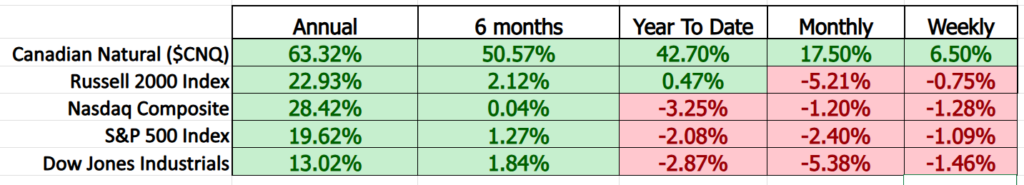
No matter how you frame the time horizon, Canadian Natural is not just outperforming, it is separating itself. While the major indexes are struggling to find direction, this stock continues to advance with consistency. That divergence is the signal. It tells you where capital is flowing, and more importantly, where it is not.
This is what leadership looks like in real time. It is not subtle, and it does not require interpretation. The spread between this stock and the broader market is wide, persistent, and across every meaningful timeframe. For traders, that simplifies the decision process. You can argue with opinions, but it is much harder to argue with relative strength.
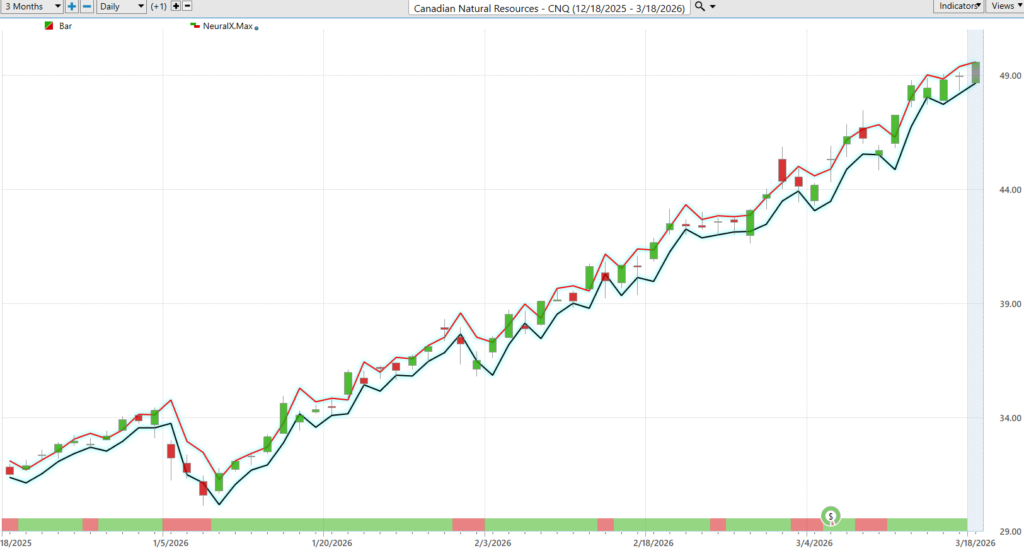
VantagePoint A.I. Predictive Blue Line
What VantagePoint Family members focus on first is not the candles, not the headlines, but the slope of the predictive blue line. That line is predictive and represents where price is likely headed, not where it has already been. By contrast, the black line is a simple 10-day moving average, and it does exactly what all moving averages do. It tells us where price has been. The relationship between the two is where the edge lives. When the predictive blue line crosses above the black line, the bias from a probability standpoint shifts toward higher prices. When it rolls below, the expectation flips the other way.
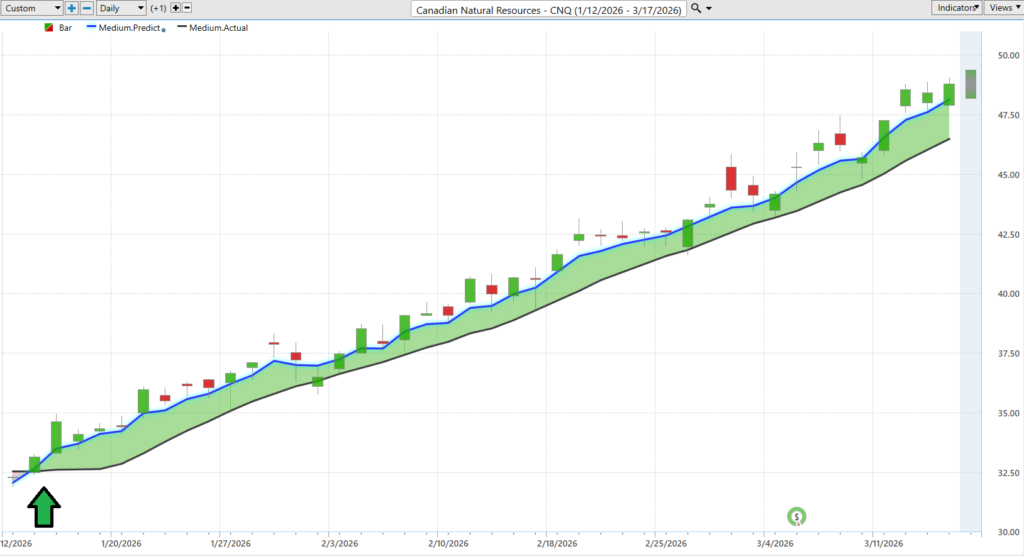
What stands out in this chart is how cleanly that relationship has played out. The blue line remains consistently above the black line, with a steady upward slope that confirms persistent strength. The result is not theoretical. It is visible in the price action itself. Over the span of just 43 trading sessions, the stock has rallied 43%. That kind of move does not happen randomly. It happens when trend, momentum, and probability align.
VantagePoint A.I. Neural Index (Machine Learning)
A neural network, in the context of trading, is essentially a system trained to recognize patterns across vast amounts of intermarket data and translate them into short term forecasts. It is not predicting the future with certainty, but it is identifying probability shifts, often before they are visible in price alone. In this case, the Neural Index is offering a forward-looking signal over the next 48 to 72 hours, acting as an early warning system for changes in momentum. When that signal turns red, what follows is not chaos but a fairly orderly response. Price tends to soften, pulling back toward and often below the predictive blue line, creating moments where the trend resets and more favorable entry points emerge.
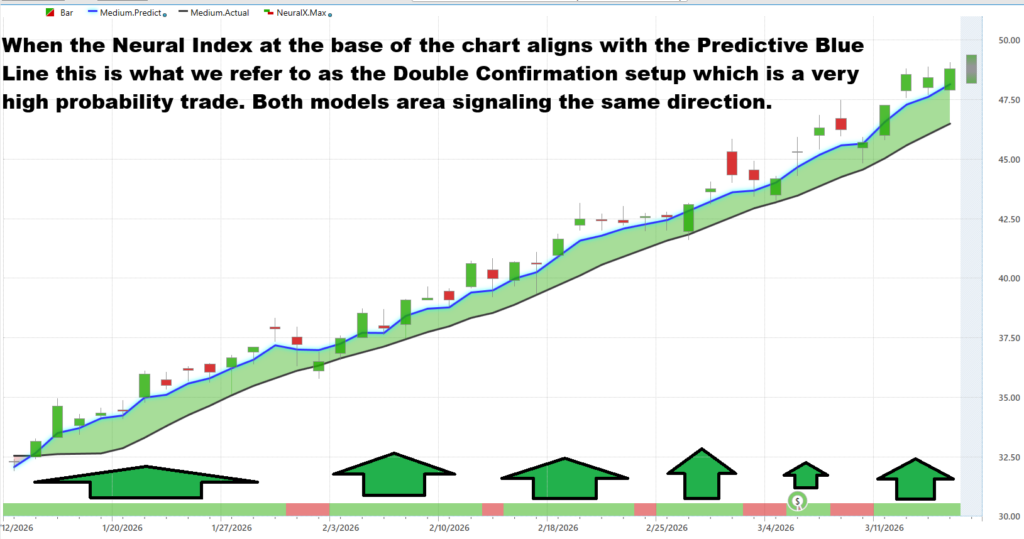
What becomes particularly compelling is when these two systems align. The predictive blue line defines the broader directional bias, while the Neural Index captures short term inflections. When both are pointing in the same direction, the signal is no longer isolated. It becomes reinforced. That alignment is what traders refer to as a high probability setup, not because it guarantees an outcome, but because it reflects agreement across multiple models interpreting the same market conditions. And as the chart suggests, those moments of alignment are often where the most decisive moves begin.
VantagePoint A.I. Daily Range Forecast
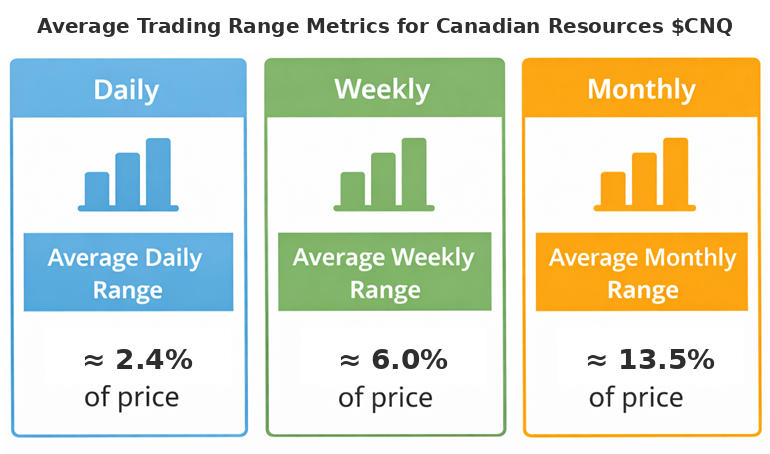
Start with the math, because the math is what keeps you honest. When an asset is consistently moving a meaningful percentage on a daily basis, and expanding that movement over weekly and monthly horizons, what you are really looking at is opportunity. Not theoretical opportunity, but repeatable, tradable movement. For short term swing traders, that is the entire game. There is enough “meat on the bone” here to matter. The challenge, of course, is not identifying that movement exists. It is knowing when to participate and how much risk to take when you do.
That is where a repeatable framework becomes less of a luxury and more of a necessity. The daily range forecast is not just another overlay. It is a forward looking map that updates every trading day, outlining both the expected range and the prevailing direction. What stands out in the chart is how consistently that forecast tracks the trend, providing a structured view of where price is likely to travel and where it may pause or pull back. It does not eliminate uncertainty, but it organizes it. And in a market defined by constant movement, that ability to frame both opportunity and risk in advance is what separates reactive trading from deliberate execution.
Intermarket Analysis
Intermarket analysis begins with a simple but often overlooked truth: no asset trades in isolation. Stocks, commodities, currencies, and interest rates are all connected, shaping and influencing one another in ways that define price movement. To understand where a stock is going, you have to understand the environment around it. In the case of $CNQ, the graphic makes that environment unmistakably clear. This is an energy story first and foremost, with oil acting as the dominant force. When crude rises, revenues rise, and the stock tends to follow, often with greater intensity, turning it into a higher beta expression of the same underlying trend.
But the story becomes more nuanced when you widen the lens. Currency relationships, particularly with the U.S. dollar, introduce a secondary layer of influence. As oil strengthens, the Canadian dollar often does as well, which can slightly offset gains when revenues are translated back into U.S. terms. At the same time, rising oil prices tend to coincide with inflationary pressure, pushing interest rates higher and shifting capital flows across markets. In that environment, energy equities often emerge as relative winners, attracting investors looking for exposure to assets that benefit from rising prices rather than suffer from them.
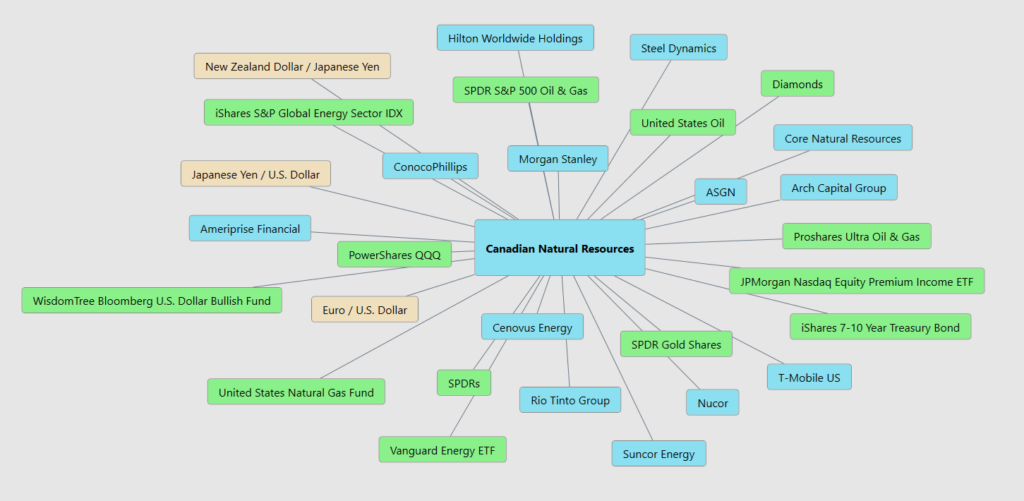
The broader implication is that leadership cannot be judged in isolation. A stock like $CNQ must be measured against oil, currencies, rates, and the broader equity landscape to determine whether it is truly leading or simply moving with the tide. What this graphic reveals is a tightly connected system where oil sits at the center, but where multiple crosscurrents shape the final outcome. For traders, the lesson is clear: understanding these relationships transforms price action from something that appears random into something that, while complex, follows a discernible logic.
Our Suggestion
Let me put this in plain English. The last two earnings calls from $CNQ sound like what every management team wishes they could say but very few actually can. They are doing what they said they would do. Production is growing. Operations are running smoothly. The balance sheet is being handled with care. And they are returning capital to shareholders without getting reckless. But here is what really matters. The tone. Calm. Confident. No hype. No chasing shiny objects. They are running a long cycle business like a long cycle business. That is exactly what you want to see after a big move in the stock.
Now, they are not walking around pretending risk does not exist. They know the game. This is still an oil business. Prices move. Demand shifts. Geopolitics can flip the table overnight. Management talks about it openly. They stay disciplined with capital and keep flexibility front and center. Translation: They are enjoying the good times, but they are not betting the company that the good times last forever. At the same time, they are leaning forward just enough to signal confidence. Slightly higher expectations. Continued execution. Nothing dramatic, just steady.
So what comes next. The next earnings calls should land around early May 2026. And this is where the conversation changes. Nobody is asking if they can survive anymore. That chapter is closed. Now the question is, can they sustain this level of performance. Can they keep delivering without getting sloppy. And for you as a trader or investor, here is the part you cannot ignore. No matter how good the story sounds, you manage your risk. Every trade. Every time. Position sizing and discipline are not optional. They are the price of admission if you plan on staying in this game.
It’s not magic.
It’s machine learning.
Disclaimer: THERE IS A HIGH DEGREE OF RISK INVOLVED IN TRADING. IT IS NOT PRUDENT OR ADVISABLE TO MAKE TRADING DECISIONS THAT ARE BEYOND YOUR FINANCIAL MEANS OR INVOLVE TRADING CAPITAL THAT YOU ARE NOT WILLING AND CAPABLE OF LOSING.
VANTAGEPOINT’S MARKETING CAMPAIGNS, OF ANY KIND, DO NOT CONSTITUTE TRADING ADVICE OR AN ENDORSEMENT OR RECOMMENDATION BY VANTAGEPOINT AI OR ANY ASSOCIATED AFFILIATES OF ANY TRADING METHODS, PROGRAMS, SYSTEMS OR ROUTINES. VANTAGEPOINT’S PERSONNEL ARE NOT LICENSED BROKERS OR ADVISORS AND DO NOT OFFER TRADING ADVICE.