


Welcome to the Artificial Intelligence Outlook for Forex trading.
VIDEO TRANSCRIPT
VANTAGEPOINT A.I. MARKET OUTLOOK | WEEK OF MARCH 16, 2026
Okay, hello everyone, and welcome back.
My name is Greg Firman, and this is the VantagePoint AI market outlook for the week of March the 16th, 2026.
Now, to get started this week, we’re going to begin where we always do with that very important US dollar.
Wisdom Tree Bloomberg US Dollar Bullish Fund ($USDU)
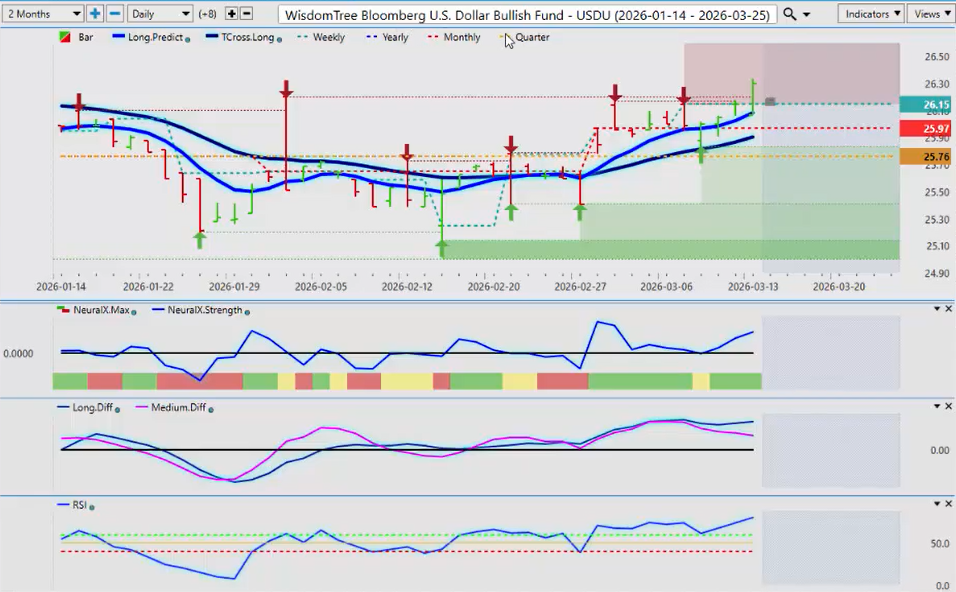
Now, the Wisdom Tree Bloomberg US bull fund, the USDU, we’ve had a big push up to finish the week. Now, there’s our Monday high low. We’ve broken down below it at the beginning of the week, and then we’ve retraced and started moving higher, closing above the weekly opening price.
But in my respectful opinion, I think we’ve seen this movie before. Then the dollar remains strong till about 12 noon, 1:00 on Monday, and it reverses again. The MA diff cross from VP is warning of exactly that. So again, when we’re looking at the indicators, yes, we have recovered. We’ve had a retracement back to our T-Cross Long. That is definitely bullish for the dollar. But with all of the things that are going on, if there’s any kind of resolve with the US and Iran and Israel, then this can change very, very quickly. But again, this outlook is for one week only. So going into next week, in most cases when I see a big push to the upside on Friday in ultra thin illiquid markets, we often see the exact opposite at the beginning of the week, Monday or Tuesday of the following week, and that is indirectly supported by the VP crossover.
Gold/US Dollar ($XAU/USD)
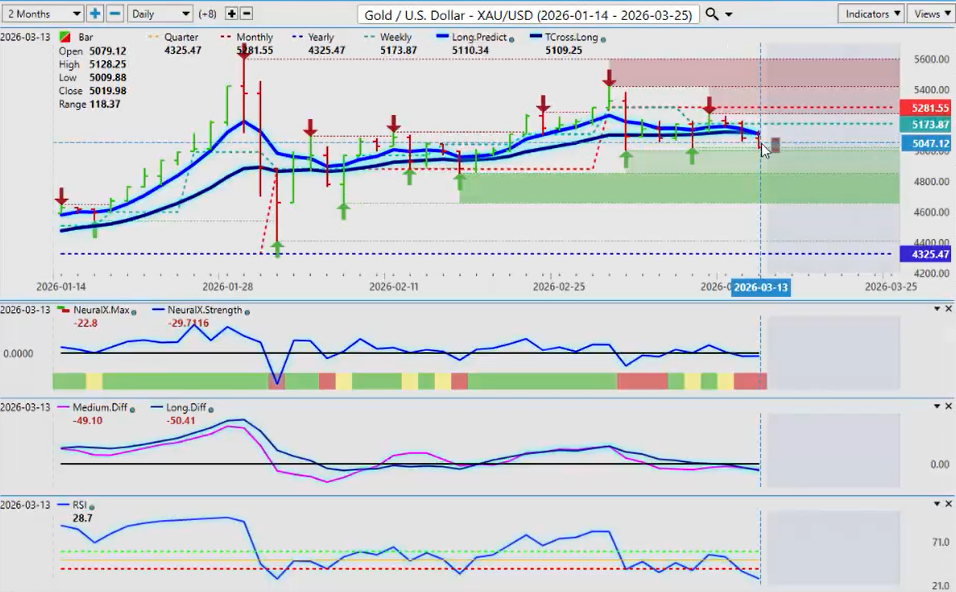
Now gold remains again very bullish on the year. Starting out the year in January, I believe we’re up 29%. Had a retracement close to the yearly opening price, then continue to advance another 22% back to the upside. So, a little bit further retracement here, but ultimately it is likely that gold will be the between the battle between buying dollars and buying gold. Gold has predominantly been the winner of that fight every time going back 20 some odd years. Remember the dollar index is well below its inception price where gold continues to climb along with silver and some of the other metals, but we are seeing some bearishness here. A little bit of downward momentum, but buying the dip would definitely be a very reasonable play even at current levels.
SPDR SPY ETF ($SPY)
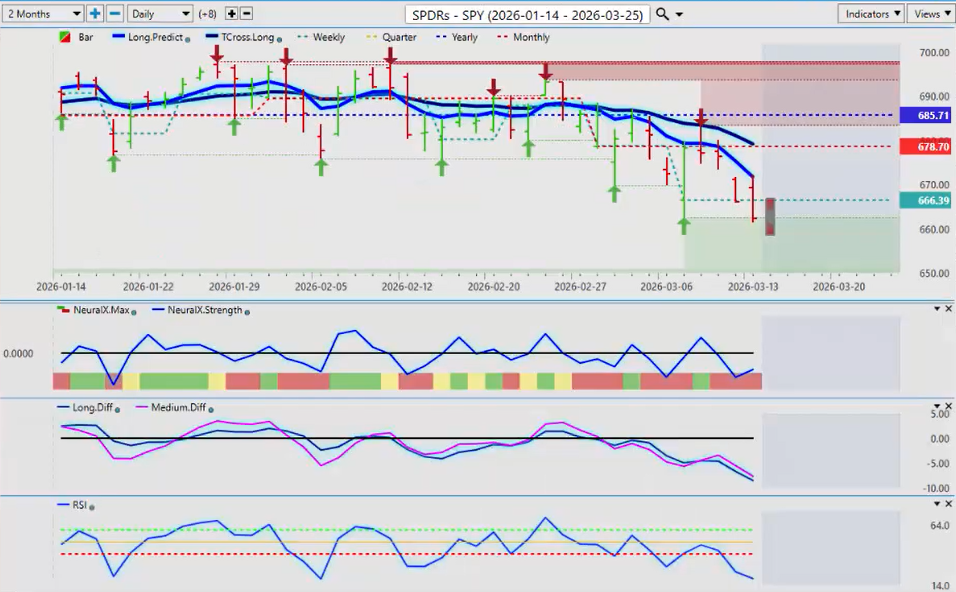
Now the equity markets, most of them other than maybe the UK index, are doing very, very poorly with the Iran US war. Obviously that’s putting downward pressure on the SPY, the Russell, and even the DAX. So the way we would look at this, guys, is again identify the primary trend. We’re below the yearly opening price, the T-Cross Long, and the long predictive. So we’re going to need a bit of a turnaround with this war to get things settled down here, but it doesn’t look like that’s going to be next week. So always remember your retracement points. The T-Cross Long, that’s 671. The T-Cross Long 679. The T-Cross Long 671. We would apply the same values to the Russell.
iShares Russell 2000 Value IDX ($IWN)
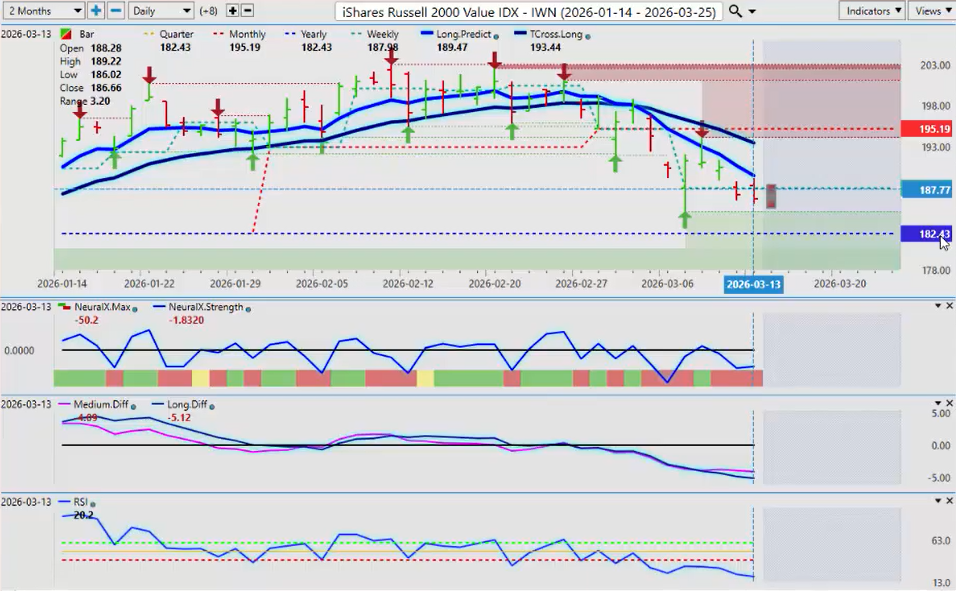
Now the Russell, particularly I’ll point out the IWN on the ETF side, remains above its yearly opening price. The Russell futures have broken down below that. And I just want to point out that I believe, as I’ve discussed on here before, that these ETFs can weed out some false signals. So maybe we’ve got a turnaround coming. The MA diff cross here, the pink line over the blue line, has crossed to the upside. That is a big warning sign of a retracement coming. And those two levels again, the long predicted 189, T-Cross Long 1934.
DAX
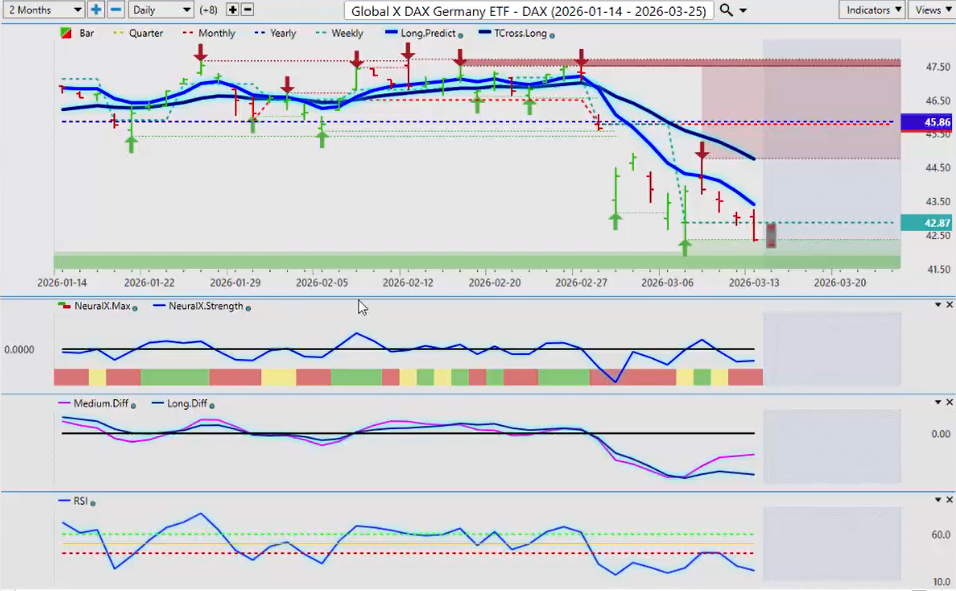
So when we look at the DAX, the DAX is following the euro lower. So if the euro can turn back up to the upside, which I’ll discuss in a minute, then we could see the DAX also follow that higher. We do have an MA diff cross, a reversal signal that if nothing else is telling us we’re going to retrace back to one of these, one or both of these two levels. The first one coming in at 4340, the second one 4475. The primary trend like the euro has now shifted to the downside, but largely because of fundamental events that are occurring. Once that eases off, we’re likely going to see a reversal.
Volatility Index ($VIXY)
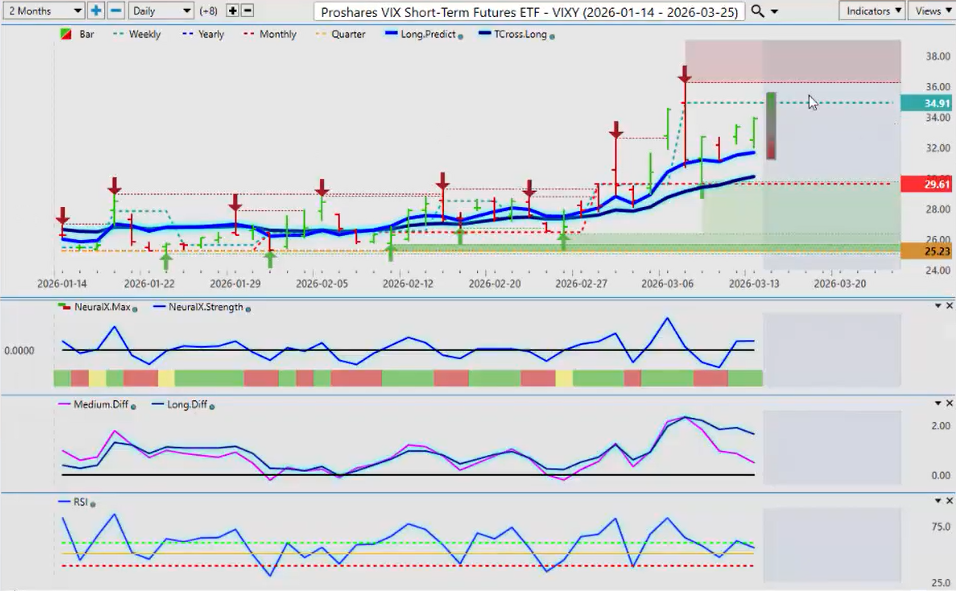
But when we look at the ProShares VIX Short-Term, it continues to advance. But I will point out that over the last three months this is an anomaly. You don’t normally see a bullish VIX and the global indices above their yearly opening price. But again the VIX is the one that has moved forward, but another big warning sign with that MA diff cross to the downside that potentially the VIX is getting ready to reverse.
So again the presentation is for one week only, but it’s always done ahead of the market. This one being done Saturday afternoon at 1:39 p.m. before the market opens, not after. We see a lot of presentations that basically show us things that have already occurred. That is not the idea with this particular presentation. It’s to get out in front of these moves before they happen, not after.
Bitcoin ($BTC/USD)
Now, speaking of that, I’ve been a very strong advocate of Bitcoin in the month of March only. And what the systems show is basically that Bitcoin does have, even in a down year, and always remember the real cycles that are occurring with Bitcoin that I’ve discussed on here. Three years up, one year down. Three years up, one year down. Last year was the third year. We are expecting, and I’ve discussed, a move lower in Bitcoin months before this occurred, actually back in January of 2025 because it’s a repetitive cycle.
However, in those down years over the last five years, Bitcoin has seen substantial upside pressure in the month of March only. Not April, not May, not June, but March.
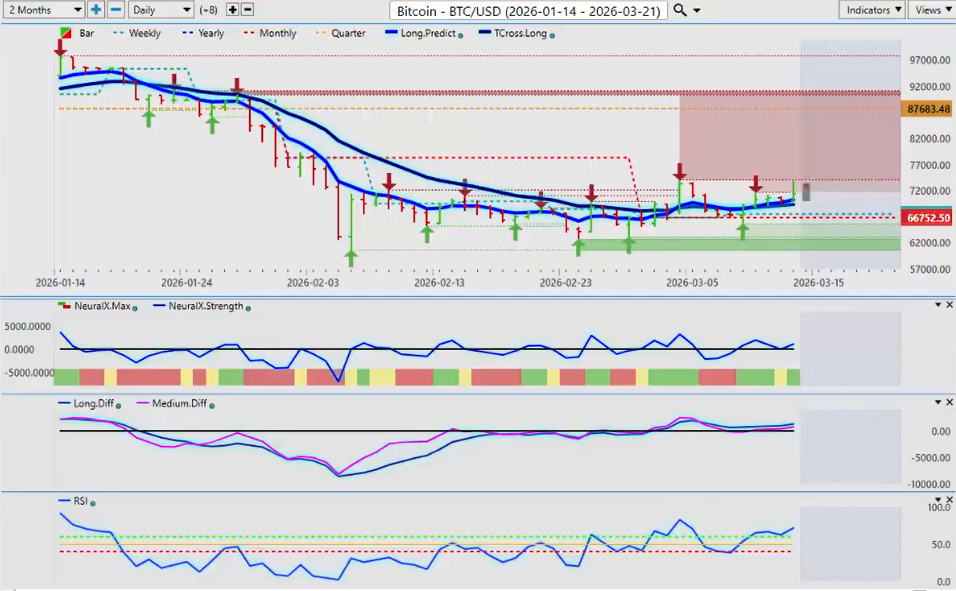
So right now we are starting to form a stronger buy signal. Now again what I will warn everybody is that at the end of the month that doesn’t mean that Bitcoin is going to remain to the upside. In fact I don’t think the closer we get to the end of the month that’ll be it for Bitcoin again. But for now we’re above the monthly opening price. T-Cross Long 69,338 and our long predicted at 70,230.
So some pretty and again the VP indicators are definitely warming up to a long trade as momentum now is starting to build. Now with the predicted RSI using a 60/40 split, we’re gauging momentum, guys, not overbought, oversold, accumulation distribution, none of this stuff. We’re looking at momentum only. Do we have momentum building to the upside? Well, this is saying yes we do. In my respectful opinion only, that is the only hurdle we have to clear. 73,984.
But we also remember guys we hit this high in March. Bitcoin in the month of March has already moved up from the beginning of the month up over 10%. We’ve had a retracement back to the monthly opening price where the buyers have stepped in again, and now we’re up another 10%. So again pretty good move for the savvy trader that uses the monthly opening price with the T-Cross Long.
Crude Oil ($USOIL)
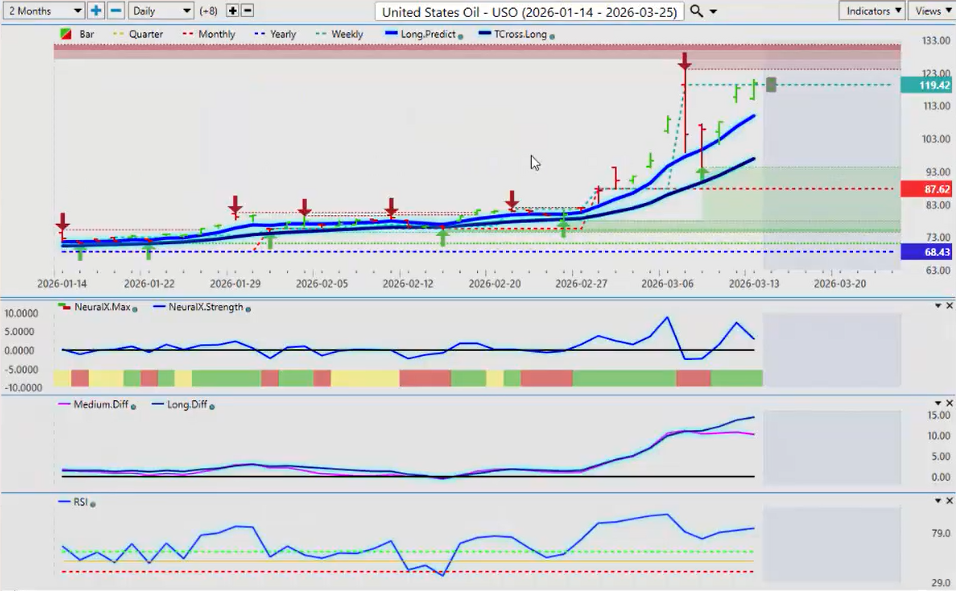
Now oil prices continue to climb higher, but again a big move up on Monday, also a big move down last Monday, and then we finished right up near the weekly opening price was the retracement point. But you’ll notice that we came right back between the VantagePoint Long and the long predicted, and that’s where the buyers stepped right back in.
So for next week your support low is going to be 94.23.
So I imagine that we are still going to extend higher. There’s a lot going on on the weekend right now. Iran striking, the US striking. Who knows where we’ll be on Monday with this? But either way oil is likely to benefit. But I will further point out that we have the MA diff crossed to the downside while the market has continued to advance. We have that divergence of the strength of the medium-term crossover versus the strength of the long-term crossover, and it’s showing that this is weakening actually. So we’ll see how next week pans out. But for now my specific advice would be to be very cautious if you’re trading anything on the energy side, even including silver and gold.
Euro versus U.S. Dollar ($EUR/USD)
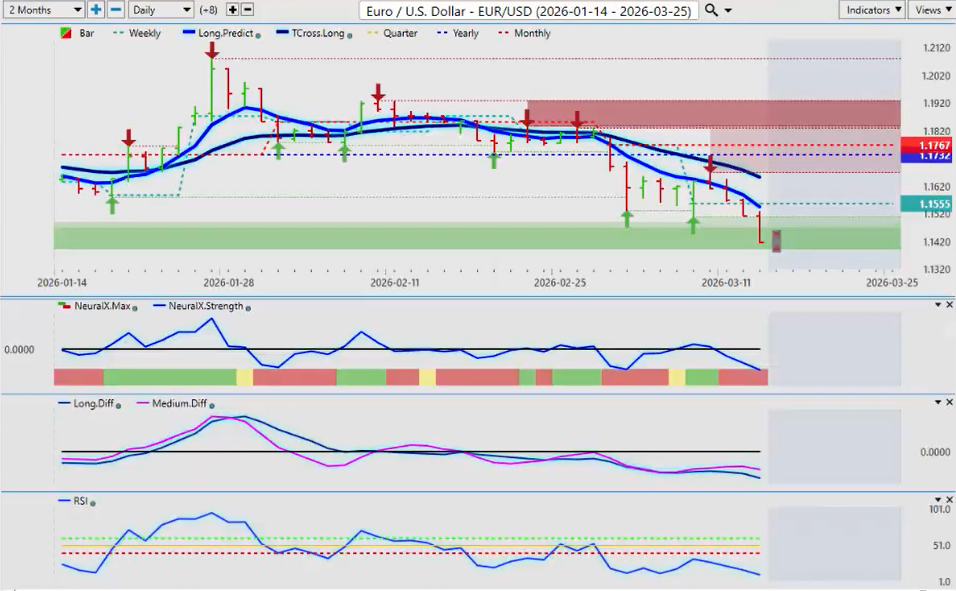
Now the euro held out pretty decent last week. We can see that we rose, but then we got all tangled up in the VantagePoint T-Cross Long, the monthly and the yearly opening price, and it was just too much for it and it pushed down again. So we’ve had a pretty bearish close on the week where normally we would see strength in the euro. So I would respectfully submit we could see that this coming week, but I’m looking for something in the VP software to confirm that.
And I believe it will come from the neural index strength. The MA diff cross has occurred right here. So remember guys we’re only a few pips off the lower end where that signal came in and the bulk of the losses all occurred right here on Friday when we broke down below the Monday bar low at 1.157.
U.S. Dollar versus Swiss Franc ($USD/CHF)
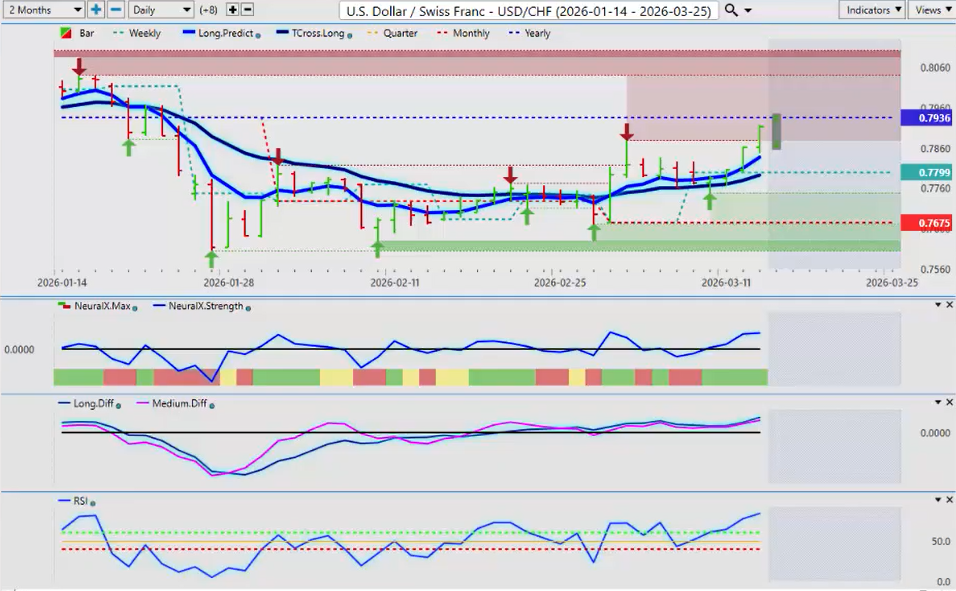
Now the US Swiss Franc, again the Swiss National Bank once again trying to intervene in the currency markets here guys. And this is textbook failure, what they did with the Euro Swiss Franc years ago. So they’re at it again. We’ll see where this one goes, but 0.7936 that is the key level that you want to watch for next week. We would need a sustained break of this level and we would need to close above this level for two or three days in a row to shift the trend from the downside to the upside.
I don’t believe that that will occur and if it does it will be temporary until the tensions between the US and Iran subside. But I ultimately believe money will go back into the Swiss Franc versus the US dollar even with the carry trade.
British Pound versus U.S. Dollar ($GBP/USD)
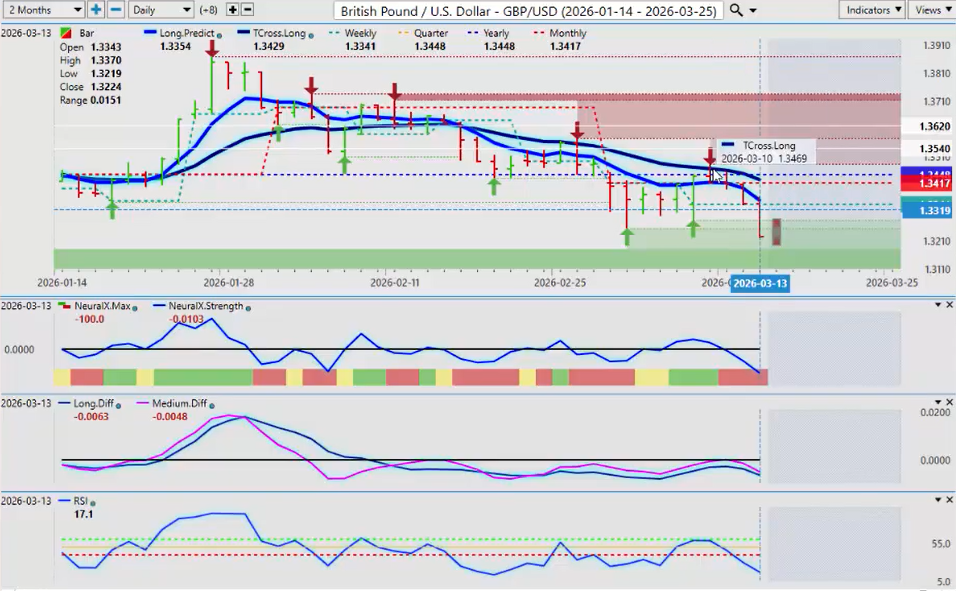
So when we look at the British pound US dollar, basically following the euro to the downside, the bulk of the losses again occurring on Friday. We had a move up. We got tangled up again right up and around the yearly opening price where the T-Cross Long also resides. That was too much. Again the secondary failure on Wednesday, that was it right there guys, and then down we go.
But again usually when I see a big move down like this on a Friday, that move continues initially on Sunday night into early Monday trade. But usually by 9:30 between 9:30 and 1:30 p.m. on Monday very often this Friday move reverses.
So keep that in the back of your mind before you pile into shorts on either EUR/USD or GBP/USD.
U.S. Dollar versus Japanese Yen ($USD/JPY)
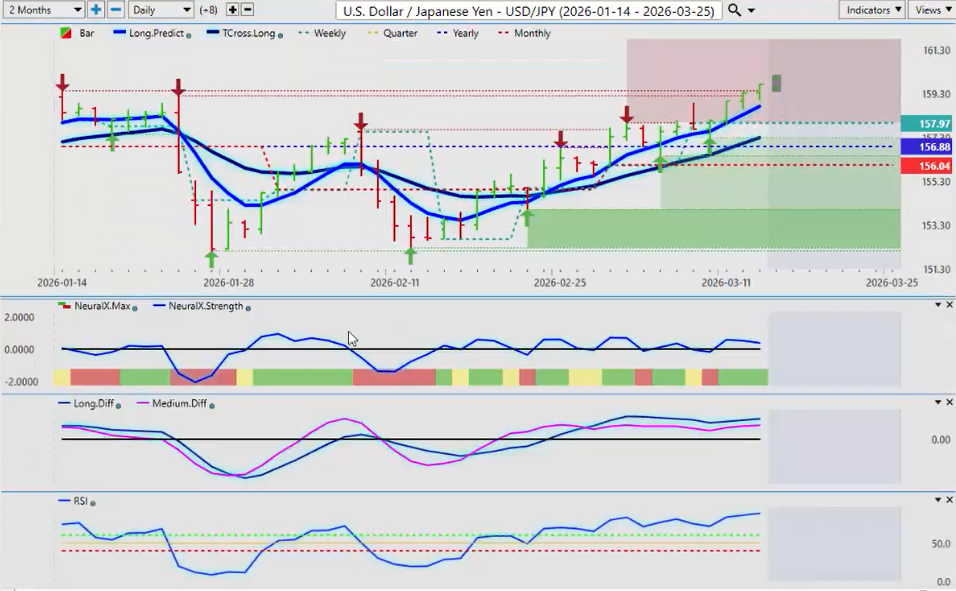
Now the USD/JPY remaining somewhat quiet this past week but continues to advance based on the carry trade. But again when we see tensions like this, the equity markets crashing historically there are three currencies that strengthen. The yen, the Swiss Franc, and the US dollar.
So right now the only one of those three currencies that is strengthening is the dollar. And that is a big warning sign again that the dollar strength could be limited.
Now again a lot of talk about the Fed possibly even hiking rates. I don’t believe the new incoming Fed chair is going to do anything of the sort. He’s going to be looking to cut. So the sentiment in the dollar can change very very quickly and likely will in the weeks ahead. So again be very cautious with longs on this particular pair.
U.S. Dollar versus Canadian Dollar ($USD/CAD)
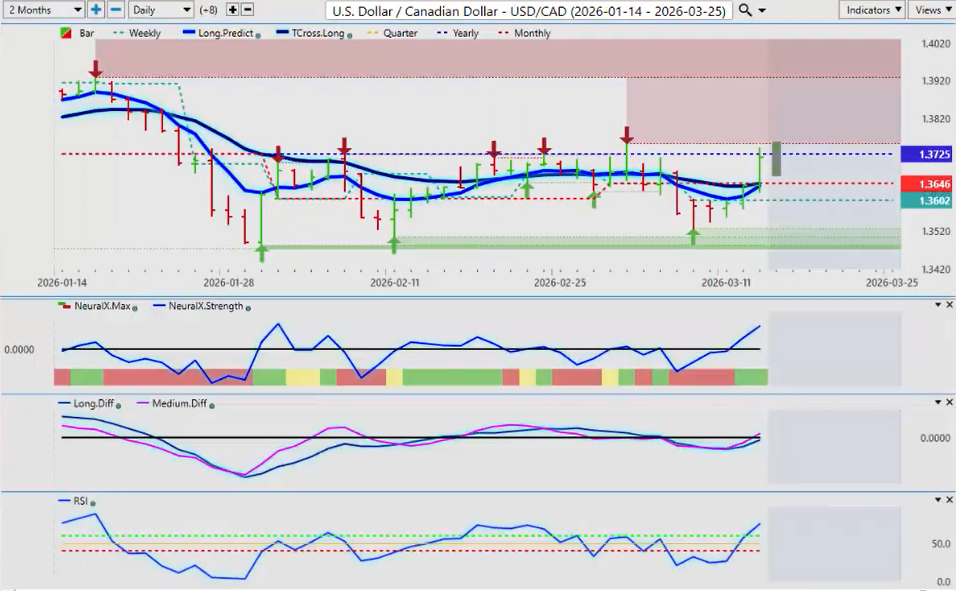
Now the Canadian, the CAD, the Aussie, and the Kiwi, all of which have maintained significant gains against the dollar even during the height of this newest war. But the Canadian dollar making a big push up on a Friday.
So again we are yet to close above the yearly opening price and we’re closing. That’s a strong close on Friday, 1.3717, but the yearly opening price is 1.3725. Be very cautious of a bull trap up here.
Now a lot of that push up again is a horrific jobs number out of Canada. We were supposed to create 10,000 jobs. We lost 83,000 jobs and the unemployment rate went up. So that obviously was a pretty big negative for the Canadian dollar, but there’s also some positives here too. Higher oil prices and potentially an equity market reversal.
So again watch this 1.3725 area next week very closely.
And always remember on the Monday Tuesday reversal the highest pair, the pair with the highest percentage of doing this, is the USD/CAD pair. Meaning whatever it does on Monday it very often does the exact opposite on Tuesday.
So again be careful with that. That’s my warning there.
Australian Dollar versus U.S. Dollar ($AUD/USD)
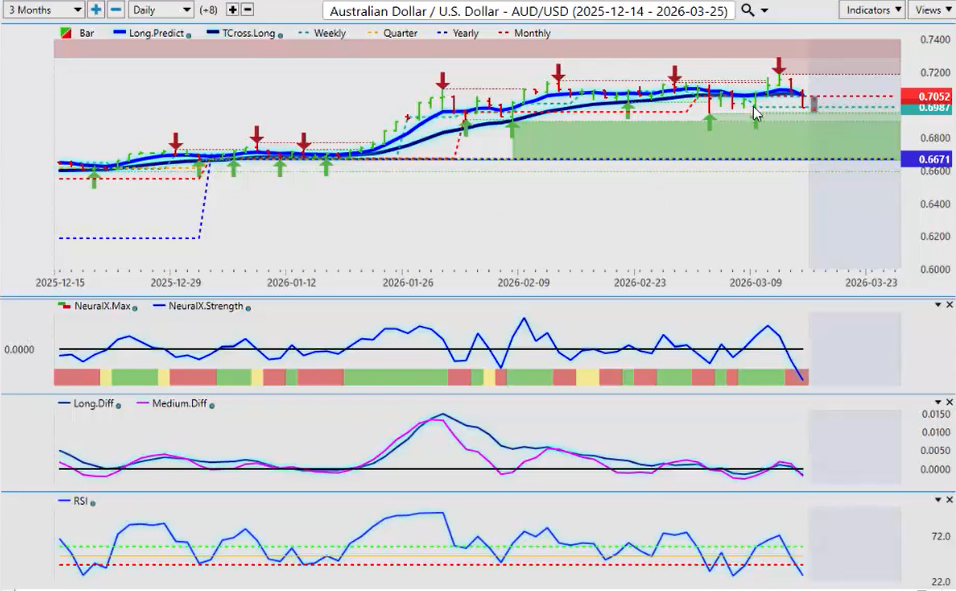
Now the Aussie had actually had a heck of a week and it wasn’t until the end of the week that it started falling and it basically came right back to where it started.
Now the indicators are bearish here guys in the near term, but always remember that the Aussie remains grossly positive on the year. 0.6671 the yearly opening price.
The AUD/NZD cross pair doing very well further supporting the Aussie currency.
So again looking at this pair watch for reversal signals by the latter part midweek, but again unless we break down below 0.6671 the primary trend remains to the upside.
New Zealand Dollar versus U.S. Dollar ($NZD/USD)
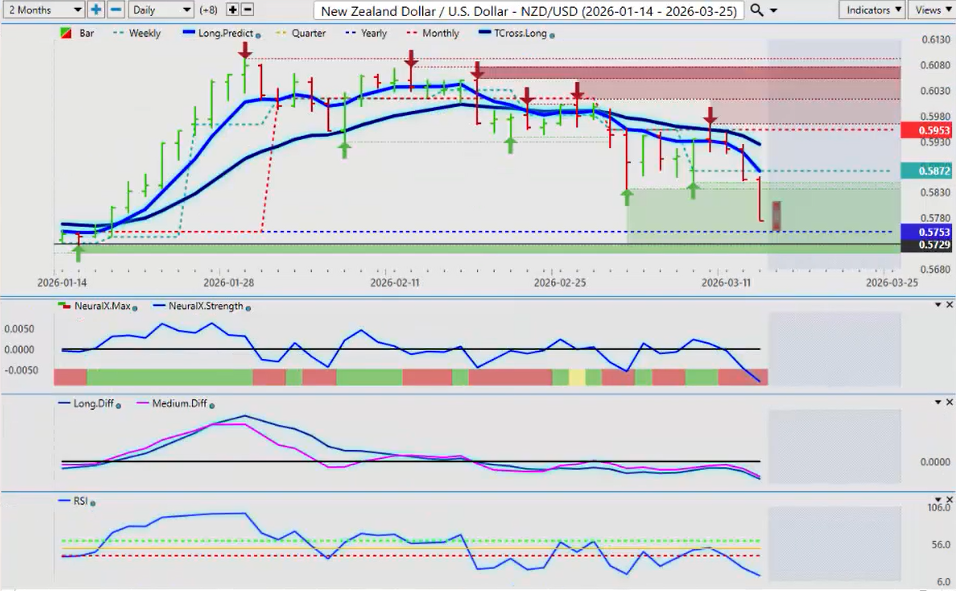
The same or similar could be said for the Kiwi, but again the Kiwi is under heavy pressure from the Australia New Zealand cross pair, and you’ve got some interest rate issues there in New Zealand too.
But again 0.5753 this is the critical level.
What I will be watching personally next week is if this level at 0.5753 can hold or if we break down below it but we don’t close below it for at least two to three days in a row.
If that doesn’t happen guys you have a very very strong possibility of a great long trade.
But the key thing is know your levels. If you know those levels and you’re cognizant of the fact that very often Monday is a fake price, then Tuesday, Wednesday, Thursday of next week you really want to keep an eye on this one because it could be very very good value.
But again next week we are likely to see heightened volatility, but with that will definitely come opportunity.
So with that said, this is the Vantage Point AI market outlook for the week of March the 16th, 2026.


