


Register for a Free Live Training
The Hot Stocks Outlook uses VantagePoint’s market forecasts that are up to 87.4% accurate, demonstrating how traders can improve their timing and direction. In this week’s video, VantagePoint Software reviews forecasts for SPDR SPY($SPY), HESS ($HES), Oracle ($ORCL) Chipotle ($CMG). Ross Stores ($ROST), Verisk Analytics ($VRSK), Darden Restaurants ($DRI), Tesla Motors ($TSLA),
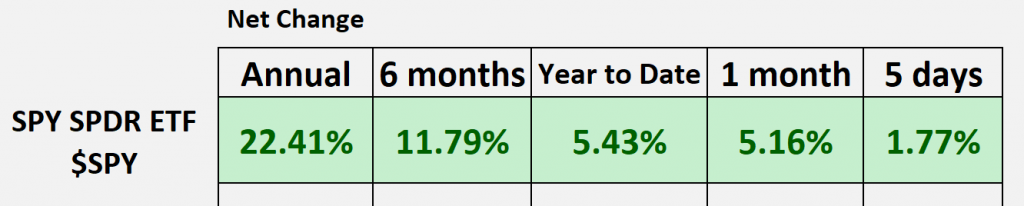
SPDR SPY ETF ($SPY)
Hello again, traders, and welcome back to the Hot Stocks Outlook for February 9th, 2024. Hope you all are having a nice week out there in the financial markets. Here to go ahead and really recap a lot of these opportunities, and look at some of these short-term forecasts from this previous week here. So, if you haven’t already, make sure you go ahead, click on that link in the description below. What you can do is get a live demonstration and learn all of the specifics about how this predictive technology can help you make much better trading decisions in the marketplace.
And now, as we typically do, we can look at the SPY ETF and get a sense of where has that broader market for equities been over the past given span of time here. And we can see, well, we’re about 5 and a half percent at our year-to-date number here, and we’ve had a really nice past few days here. So, you know, last Hot Stocks Outlook, talking about a lot of the strength in the market, seeing a lot of these opportunities. And so, short-term traders really have a lot of that momentum on their side. And so, let’s go ahead and take a look at that.
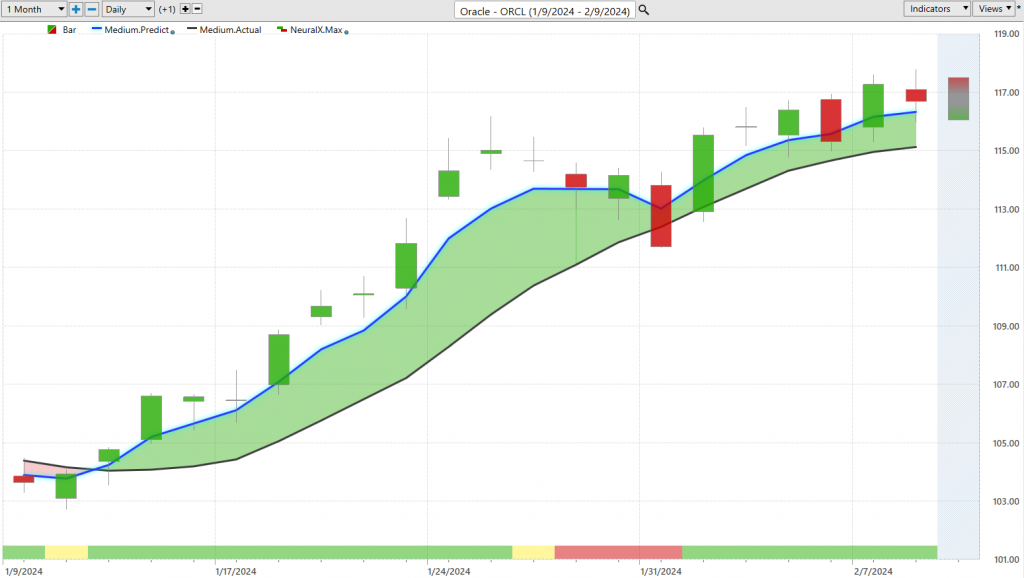
So, we’ll go ahead and we’ve got a mix of some things we’ve looked at before, some new opportunities here, but Oracle—this is a really good example of how all these predictive indicators work. And also, this is a market that we looked at last week, so we can see, you know, how those updated forecasts have performed. But what we have here is daily price action, right? So, each one of these candles that you’re seeing is going to represent a full and complete trading day, and it’s right up against all that price data. That you’ll also see this black and this blue line value there. And so, this is very important to understand, that what that black line value on the chart is, is actually a simple moving average. So, we refer to that as the actual simple moving average. It’s a very common technical indicator because what it does is really just look back at the actual last 10 period closes, add those all together, and divide by 10. And so, that acts as a good measure of where market prices may have been over a given period of time. But one of the weaknesses in relying on a tool like that is that all of the information just comes from the past, right? It has no predictive technology; it’s really just summarizing things that have already occurred. So, what we can do is really think of that as our baseline, right? Saying, okay, where have prices actually been here? And what we want to do is actually compare that to this proprietary predicted moving average. And so, for this number, which has to be calculated and then plotted every evening, what’s essentially, you can think of it as a prediction of future average prices, and it’s utilizing the technology of artificial neural networks to perform that analysis. So, what that means is, specifically for Oracle here, which is a big ERP tech stock here, well, this is going to share relationships with certainly the broader market like that SPY or the S&P 500 futures and the NASDAQ. Um, but it’s also going to share relationships with other individual stocks, right? Maybe SAP, uh, maybe PeopleSoft, some of these other ERP companies, but also share some inverse relationships. And the beauty of intermarket analysis, and uh, artificial neural networks, is some of these relationships lead and lag and aren’t so obvious. And this is where the technology is able to figure out what are those significant relationships that we can use to generate a highly accurate prediction. And so, it’s really looking at dozens of markets, looking at those relationships, and using those price clues to essentially create forecast, essentially predictive forecast of where price is headed next. And so, whenever we see that blue line move above the black line, well, we can assume that average prices are going to start drifting higher, and we therefore would want to take a long position in this case. So, we see, you got about, uh, almost 12% move over the past 20 trading days. But what I want to highlight here, in this session here, is these shorter-term indicators, right? So, every week, we look at the predicted neural index. You see this green and red bar at the bottom, and we also have a predicted high and a predicted low range. Uh, and so, this is what’s exciting about this, is that every week, we’re really provided with, okay, well, going into the week, uh, we can see that the trend is up, and this predicted neural index at the bottom of the chart is an extremely accurate indicator. It’s utilizing that same technology of artificial neural networks, but it’s tuned to solve a different problem. And this is really just looking ahead two days, strength or weakness in the market. So, you can see here, as we actually move into, this is the FED announcements, and so when you see this candle on all of our charts, you know, you know you have that big FED announcement. You’re going to see volatility there, but what you see here is that the neural index gets bearish, sort of warns of some of that short-term weakness coming in, that you know, potentially, you know, without the FED announcement, you probably still would have seen some weakness there. But the overall trend remains up, and then what I want to really highlight is we have this predicted high and predicted low range.
So, this was really an excellent week where we had a lot of markets in uptrend, a lot of existing momentum, and traders can say, “Okay, well, where are those predicted high and low ranges to look to make a trading decision?” And so, last week, we looked at Oracle here, and you can see how accurate these forecasts are, right? So, the overall trend is up. Where do you want to be a buyer? Where do you want to be looking to take some sell positions? And even though the market hasn’t made a tremendous move this week, there’s still ample opportunity for numerous trading opportunities, right? So, we see that the overall range here, just early in the week, is about 1.79%, but easily opportunity to take that profit and even get in almost where you got in earlier, right? So, really nice stuff here from the VantagePoint forecast, but let’s take a look at some more markets here.
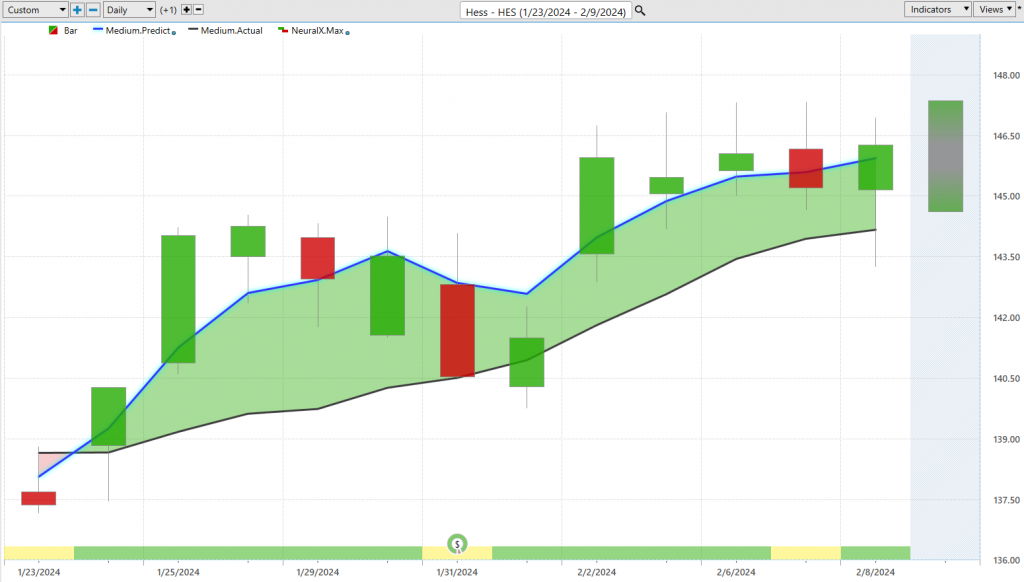
Now, here’s Hess, and we’ve seen some interesting things coming out of energy, right? So, we had this big sell-off last week, but we’re starting to see a lot of these stocks actually turn higher. This is very interesting here in Hess. Now, you see, you got this blue line crossing above the black line, and look at this neural index. So, even despite some of that weakness around the FED, look at all this strength, and you can kind of see what’s going on here is what happens with these predictive neural networks is that it’s really skewing this data to be more bullish here in Hess. So, you see how even after you get this short-term price weakness where price moves lower, those neural network predictive forecasts are saying, “Look, energies are actually going higher here,” maybe some relationships with the dollar and other oil markets or other oil stocks are skewing this indicator and this forecast more bullish. And you see that, well, things are getting more bullish, and what did we have this week at a crude oil? Well, things marching back pretty aggressively. Again, we can look at those predicted highs and lows, got a little bit again, this volatility around the FED day, but again, notice how you come into the week, and you’ve got these excellent levels to take a position.
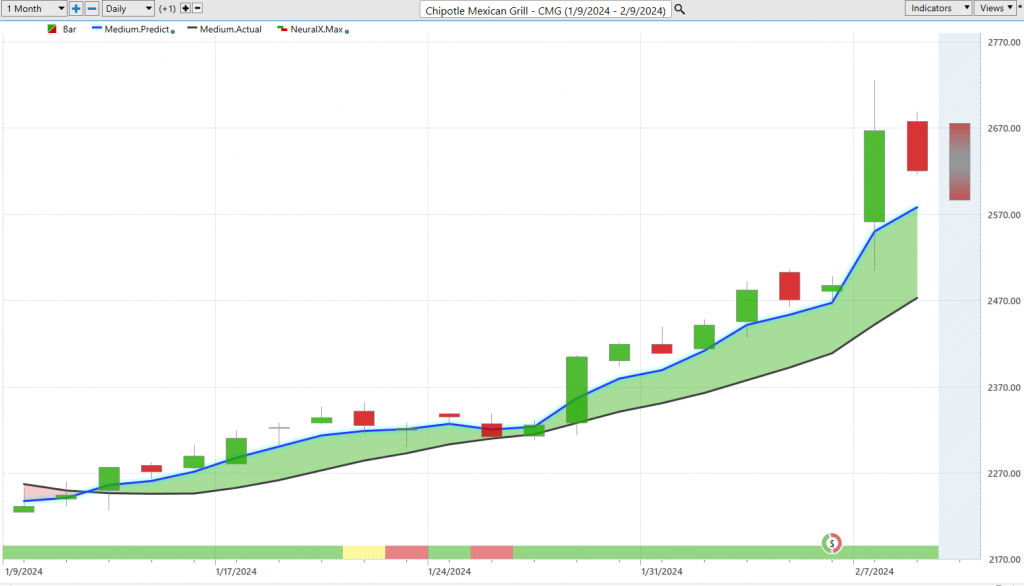
And now, going into a Friday, we’ll see what we get here. Here’s Chipotle Mexican Grill. This is actually the market we started on last week, and you see this crossover early on. We get this sideways price action with our predicted neural index. We get that sideways price action there, but what do we have more recently going into this week and leading into earnings? So, you get this really great opportunity to potentially build a position, get a lot of cushion going into that volatility around earnings, where then you can make a lot of money. So, you see these multiple entries down near these VantagePoint predicted lows, and again, these levels that you’re seeing are provided before each and every trading day, right? Like, we see here, we have a shadow candle that will be filled in with the actual trading day, but the predictions won’t move, and we can see how accurate they are. So, again, you see, even if you wanted to sneak in there before earnings, get some excellent entries to participate, and seeing a really nice bounce in the stock there.
So, again, just kind of highlighting these different ways where traders can get things on the radar and then utilize these tools to be very aggressive, right? Be, not very aggressive, but, you know, aggressive in identifying, “Okay, well, this is the place where you want to go ahead and participate. These are the price levels that we’re hitting where there’s real opportunity,” both in the short term and potentially the long term. You see about an 18 and a half percent move after that move after earnings, pulled off a little bit but still a very, very bullish forecast.
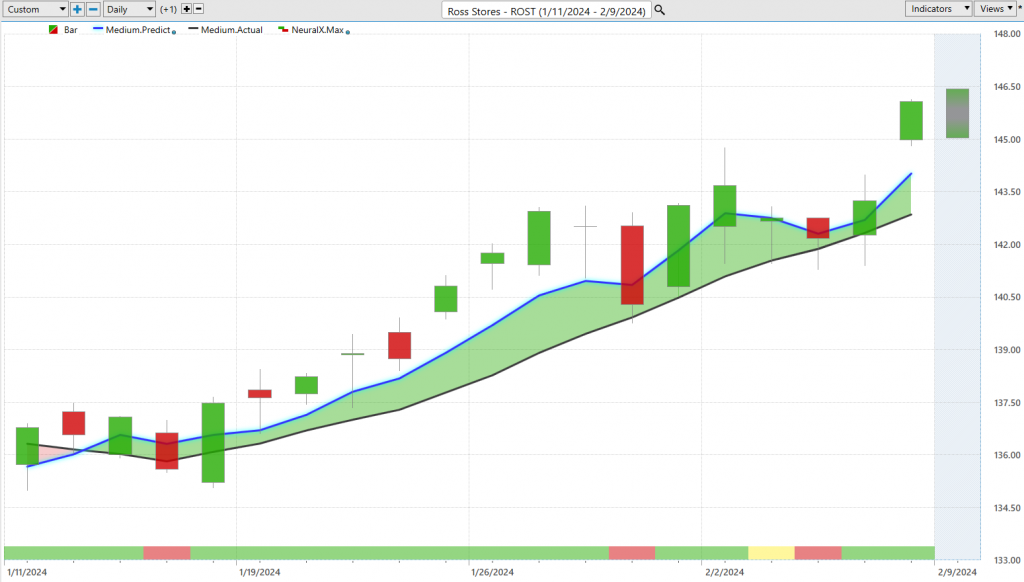
Here’s Ross Stores. So, again, this week we had a lot of strength around, you know, TJ Maxx, Ross Stores, really all throughout the marketplace here. But we see that this forecast really reversed, going all the way back to mid-January. See that blue line crossing above the black line. We, of course, have our sort of wild FED day in there that you always want to be aware of. You know, traditionally, as an equity trader, it’s FED days and earnings reports is where you’re going to see things really start to move around and maybe push outside the VantagePoint forecast because they don’t, you know, know the earnings reports and all this. They’re looking at those in-market relationships on a consistent basis and producing a very high level of accuracy through that type of analysis. But you see here in Ross Stores, again, this week, Tuesday, or well, Monday, Tuesday, Wednesday, Thursday, and we’ll see where things continue on here towards the end of the week here. But again, really nice move here and some pretty straightforward places to identify that, yeah, there is some strength, certainly do some trading there.
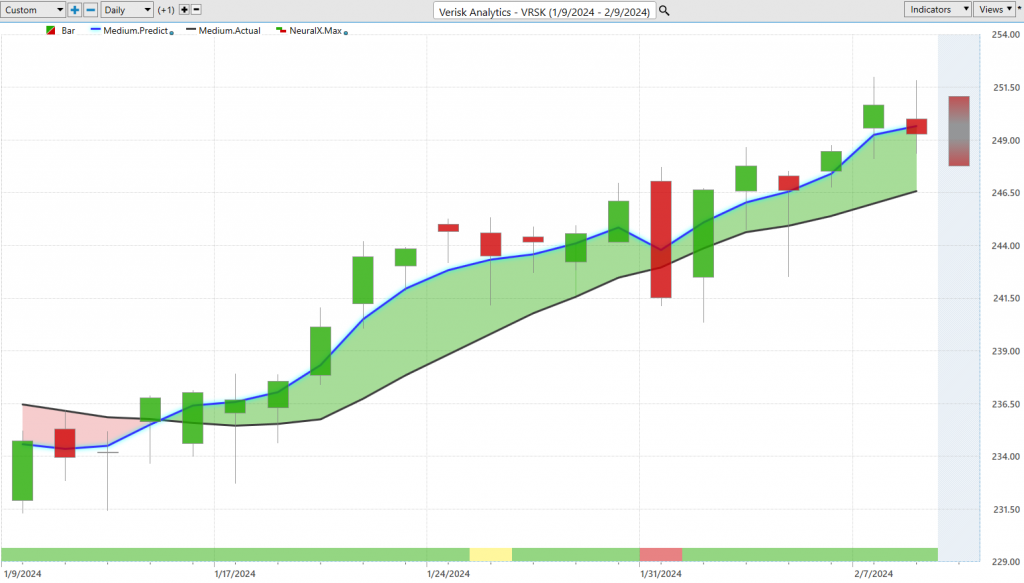
Another stock here, Verisk, and again, a lot of these opportunities, just this week, being really nice opportunities because you see all this strength in the marketplace. So, we see this crossover, a lot of good entries, FED day there, and then as soon as we get through that volatility, well, the software is doing a good job of letting you know where to pick up some shares and take advantage of that opportunity. So, really, just this week, we really got a nice move from these predicted lows, and this is just all across the board. It was like Monday, we went lower, and it was, you know, into those predicted lows, and you saw a lot of stocks just come right back out of a 2 and a half percent move this week.
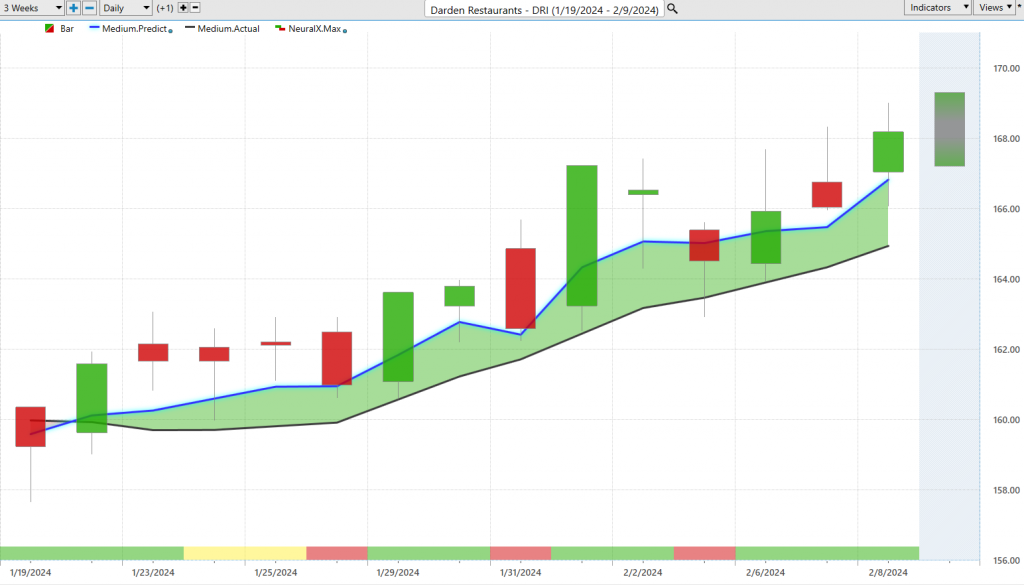
Here’s Darden. This is another stock we looked at last week. See this blue line over black line, the neural index goes bearish here, and you see you get this sort of sideways price action, and not much going on, but the overall trend here is certainly bullish. And again, you know, just from the forecast from the previous week here, you see you get this move lower, um, you know, on this trading day here, and then immediately getting bit up again that Monday where we saw things go lower and then immediately the market starting to go higher, things recovering, and opening up again some more opportunity here.
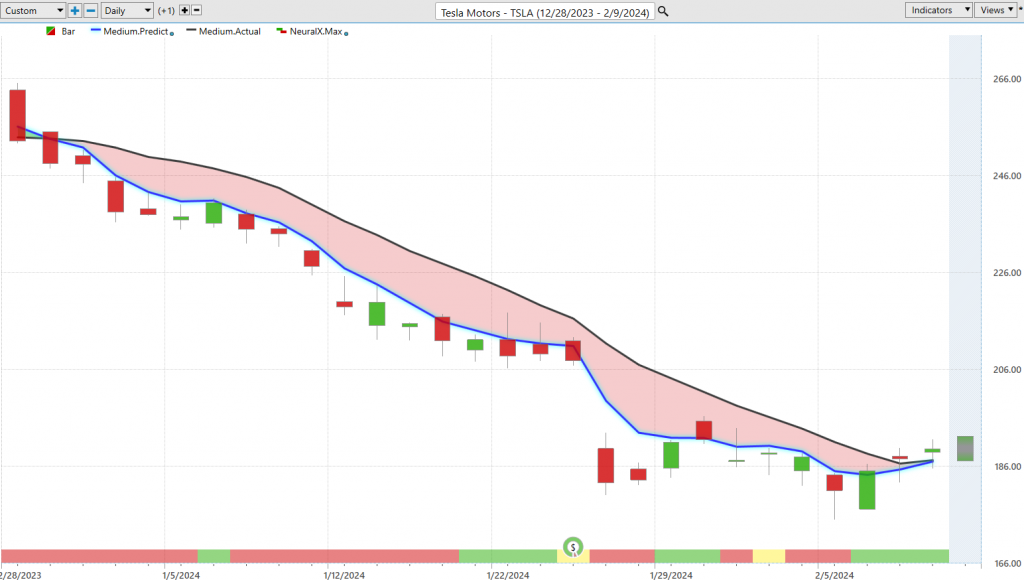
And lastly, you know, let’s go ahead and stop here on Tesla. So, you know, this is one of these stocks, actually, along with Apple, and think about this when we look at all of these different opportunities, right? There are so many different opportunities where the markets are doing well, the markets are moving higher, and some people get, you know, a lot of attention around these big tech stocks, and that’s been a great thing as Nvidia and Microsoft, some of these stocks are doing extremely well, Meta, right? But some of them aren’t. And so, in this period where certain stocks have been doing extremely well, the last thing you want to do is be focused on the wrong things. And so, here we see Tesla, you know, this is really going straight through the beginning of the year, right? This has been the entire year. Tesla’s been in this downtrend, and you see very recently we’ve gotten very close to that crossover but still not quite there. So, even in a week like this, there’s been better opportunities spread out through all these markets that are in strong uptrend with those short-term tools in your favor. And if we start seeing things turn around and you want to trade Tesla, well, at least you got that roadmap and the tools are actually bullish here. Um, but certainly a pretty dangerous scenario here for Tesla shareholders, down 25, 26% in a market that’s been doing very well. So, this is exactly this point of, you don’t want to take these hits when you have a lot of these markets, you know, really performing extremely well and having, you know, a lot of positive effects coming through their earnings reports.
So, we’ll go ahead and leave it there, but once again, this has been our Hot Stocks Outlook for February 9th, 2024. Hope you all are having a great week out there in the financial markets. Thanks again, and bye for now.


