


The A.I. stock spotlight this week is Northrop Grumman ($NOC)
Let’s start with Northrop Grummans’s ($NOC) life story, because every stock has one, and most of them read like a business school case study written by someone who fell asleep halfway through it. Northrop Grumman’s story is a little more interesting. It began with aircraft pioneer Jack Northrop in the 1930s building experimental flying machines that looked like something out of Buck Rogers. The company evolved through decades of mergers, defense contracts, and Cold War engineering projects that kept the Pentagon very busy and the shareholders reasonably happy. Major turning points came during the defense industry consolidation of the 1990s when Northrop merged with Grumman and later absorbed other aerospace and defense businesses. Today the company is a global defense contractor with tens of billions in annual revenue, tens of thousands of employees, and programs that include stealth bombers, missile defense systems, and space hardware. And the reason it still matters to markets is simple: when governments start worrying about national security, companies like this tend to receive extremely large checks.
Northrop Grumman is a defense contractor. What this company does is design, build, and maintain some of the most sophisticated military hardware on Earth.
The business model is straightforward, even if the technology is not. Governments need advanced aircraft, missiles, radar systems, satellites, and cyber defense capabilities. Northrop Grumman builds them. The company operates through several major segments that revolve around aeronautics, defense systems, mission systems, and space. Those segments produce everything from stealth bombers and surveillance drones to missile defense networks and military satellites.
The single biggest revenue driver is the United States government. The Pentagon is the primary customer and happens to be the largest military spender in the world by a country mile. That means Northrop Grumman’s business tends to follow federal defense budgets the way a golden retriever follows a tennis ball.
The company is headquartered in Falls Church, Virginia, which places it conveniently close to the people who approve large defense contracts. Leadership is headed by CEO Kathy Warden, and the workforce numbers roughly ninety thousand employees worldwide. Competitors include the other big defense giants such as Lockheed Martin, Boeing’s defense division, Raytheon, and General Dynamics. The competitive landscape looks less like a free market and more like a small club where a handful of companies rotate through massive government programs.
Financially, the company is a steady machine. Revenue has been trending higher over the past several years, largely because global defense spending has been climbing. Margins are respectable for an industrial contractor, generally landing in the mid-teens depending on the program mix. Cash flow is solid because many of these programs involve long-term government contracts that stretch over several years.
The balance sheet carries debt, but not the kind that keeps traders awake at night. Defense contractors operate in a capital-intensive world where research, development, and manufacturing facilities require serious investment. The difference is that their largest customer is the U.S. government, which historically pays its bills.
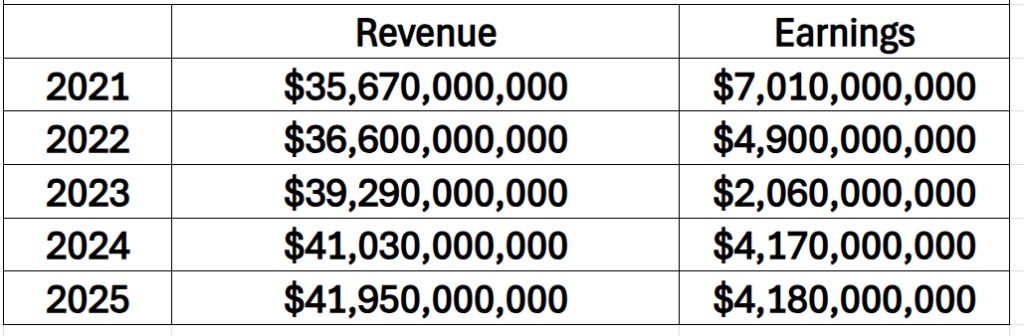
When you look at the numbers for Northrop Grumman, you get one of those classic Wall Street riddles that makes traders scratch their heads. Revenue climbs from about $35.7 billion in 2021 to nearly $42 billion in 2025, which looks steady and respectable, the kind of growth that usually earns polite applause from analysts on earnings calls. But earnings tell a different story. Profit falls from roughly $7 billion to about $4.2 billion over the same stretch. Technically, if you cherry pick the low point in 2023, you can say earnings recovered about 18% since then, which sounds nice in a press release. But if you zoom out and look at the full five-year picture, profits are still down roughly 40%. In most industries, that kind of math would send long-term investors running for the exits so fast you could measure the skid marks on the trading desk. The reason the market tolerates it here is simple. This is a defense contractor with the largest and most reliable customer on the planet, the U.S. government, which means investors tend to assume the revenue pipeline will keep flowing even when profitability looks like it took a wrong turn somewhere over the Pacific.
One thing traders often misunderstand about companies like this is the difference between growth and backlog. The market sometimes focuses on quarterly earnings when the real story is the enormous backlog of government contracts. These programs can run for a decade or more, meaning the company often knows where a large portion of its revenue will come from years in advance.
That stability is both a blessing and a curse. It creates predictable revenue streams, but it also means growth tends to arrive in large chunks whenever a new program is approved.
Right now, traders are asking a handful of questions that matter far more than accounting theory.
The first question is whether defense spending will continue rising. With geopolitical tensions simmering in multiple regions and military modernization underway across several major countries, the odds currently favor continued spending.
The second is how large the B-21 Raider bomber program could become. This next-generation stealth aircraft is one of the most important programs in the company’s history and could generate revenue for decades.
The third is whether space will become an even larger profit center. Northrop Grumman has been expanding its space systems business, which includes satellites and launch systems. As governments and commercial players increase activity in orbit, this segment could become more important. Defense contracts are lucrative, but they are also tightly managed by government agencies that monitor costs carefully. Investors want to know whether the company can maintain or expand margins as programs scale.
Over the past thirty days the news has been supportive but not shocking. Defense spending headlines, geopolitical tensions, and program updates have kept the narrative intact. None of these developments came out of nowhere. Much of it was already anticipated by investors.
What may be less appreciated is how long these programs can last once they get underway. Defense procurement moves slowly, but once a system enters production it can generate revenue for decades through upgrades, maintenance, and replacement parts.
Wall Street sometimes underestimates this durability. The defense business is not like consumer technology where products become obsolete in a year. Military systems often remain in service for generations.
Now let’s talk about the stock itself, because traders care about price movement more than corporate biographies.
The shares have been moving higher over the past several months for a few straightforward reasons. Defense spending expectations have increased. Global tensions have reinforced the need for advanced military capabilities. And institutional investors have been rotating capital toward industrial and defense names that benefit from those trends.
Compared to its sector ETF, the stock has been performing strongly. Defense contractors as a group have been gaining attention as investors shift away from sectors that dominated the previous cycle.
Over the past 90 days the rally has been fueled by a combination of contract visibility, geopolitical headlines, and investor appetite for companies tied to government spending. Year to date the narrative has only strengthened as defense budgets continue expanding.
Analysts generally agree that the company is well positioned within the defense sector, and on that point, they are probably right. However, analysts have historically been overly confident about forecasting the pace of government procurement cycles. Defense spending tends to move in waves, and those waves can last longer than anyone expects.
On the opportunity side of the ledger, several things could go right. Continued increases in defense spending could expand the company’s backlog even further. The B-21 bomber program could scale larger than expected. And the company’s growing presence in space systems could open new revenue streams.
There is also the possibility that geopolitical tensions remain elevated for years. That scenario would likely keep defense contractors firmly in favor with investors.
But there are risks as well. Government contracts come with strict cost controls and performance requirements. If a major program runs into delays or budget overruns, it can affect margins and investor sentiment quickly.
Another risk is political change. Defense budgets are ultimately determined by elected officials, and shifts in political priorities can alter spending patterns.
The single biggest upside-surprise would likely come from an expansion of major programs like the B-21 or new large-scale missile defense initiatives.
The biggest blind spot traders should respect is the possibility that defense spending growth slows unexpectedly. When government budgets tighten, defense stocks can lose momentum quickly.
Now let’s get to the bottom line, because traders do not have time for long speeches.
This is the kind of stock that tends to appeal to trend-following traders who like companies with strong institutional sponsorship and durable demand drivers. Defense contractors often move in long, steady trends rather than explosive bursts.
For the rally to continue, two things must remain true. Defense spending needs to stay elevated, and the company must keep executing its major programs without costly delays.
The early warning signal would be a combination of slowing contract awards and weakening technical momentum in the stock chart.
Right now, the chart tells a simple story. The shares have climbed roughly 50% over the past year, forming a steady pattern of higher highs and higher lows as investors piled into defense contractors. The breakout above the $700 area signaled strong institutional buying, and recent pullbacks have looked more like routine consolidation than structural weakness. As long as the stock holds above that former breakout zone, the trend remains intact. Lose that level and traders should start paying attention. Until then, the market is treating Northrop Grumman less like a speculative trade and more like a defense contractor with a very long government credit card attached to it.
In this weekly stock study, we will look at an analysis of the following indicators and metrics which are our guidelines which dictate our behavior in deciding whether to buy, sell or stand aside on a particular stock.
- Wall Street Analysts Ratings and Forecasts
- 52 Week High and Low Boundaries
- Best-Case/Worst-Case Analysis
- Vantagepoint A.I. Predictive Blue Line
- Neural Network Forecast (Machine Learning)
- VantagePoint A.I. Daily Range Forecast
- Intermarket Analysis
- VantagePoint A.I. Seasonal Analysis
- Our Suggestion
While our decisions are ultimately guided by artificial intelligence forecasts, we still take a brief look at the fundamentals to understand the financial landscape in which $NOC is operating under.
Wall Street Analysts Forecasts
Now let’s interpret what Wall Street is really saying.
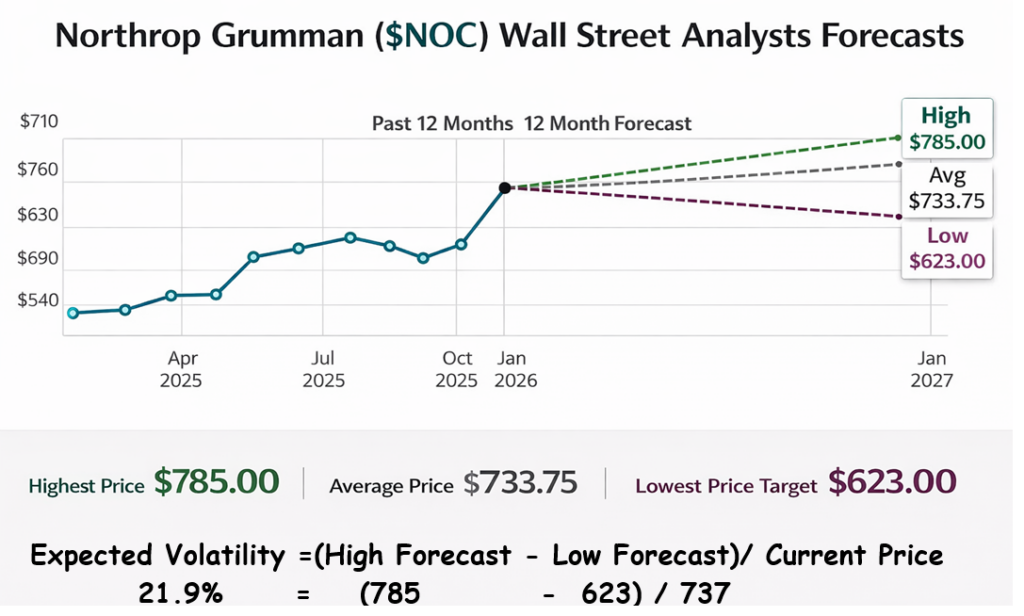
Sixteen analysts covering Northrop Grumman have essentially drawn a big circle around the current price and said, “Yeah… somewhere around here.” The average target of $733.75 is
basically sitting on top of the current price of $737. In other words, the consensus opinion from Wall Street is that the stock is roughly where it should be right now. No screaming bargain. No obvious disaster. Just a big shrug wrapped in a spreadsheet.
But when you peel back the average and look at the range, things get more interesting. The lowest forecast is $623 while the highest is $785. That creates a 162-point spread, or about a 22% disagreement between analysts. That tells you something important. Wall Street doesn’t have a crystal-clear read on how far this defense contractor can run. Some analysts think the rally has gone too far and could drop about 15%. Others believe the trend still has a modest 6% to 7% of upside left. When analysts disagree this much, it usually means the stock is in the middle of a narrative transition.
Here’s the bottom-line takeaway a trader should care about. Analysts are not forecasting a moonshot. They’re forecasting a range-bound battle. The risk-to-reward skew in their targets leans slightly negative because the downside forecast is larger than the upside forecast. But the real signal here isn’t the average target. It’s uncertainty. A 22% forecast dispersion tells you volatility is still on the table. And when institutions are still debating a stock’s true value, that’s exactly when trends tend to stretch further than anyone expects.
52 Week High and Low Boundaries
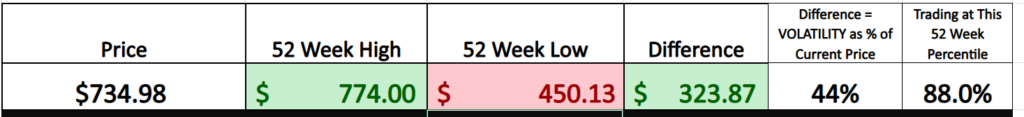
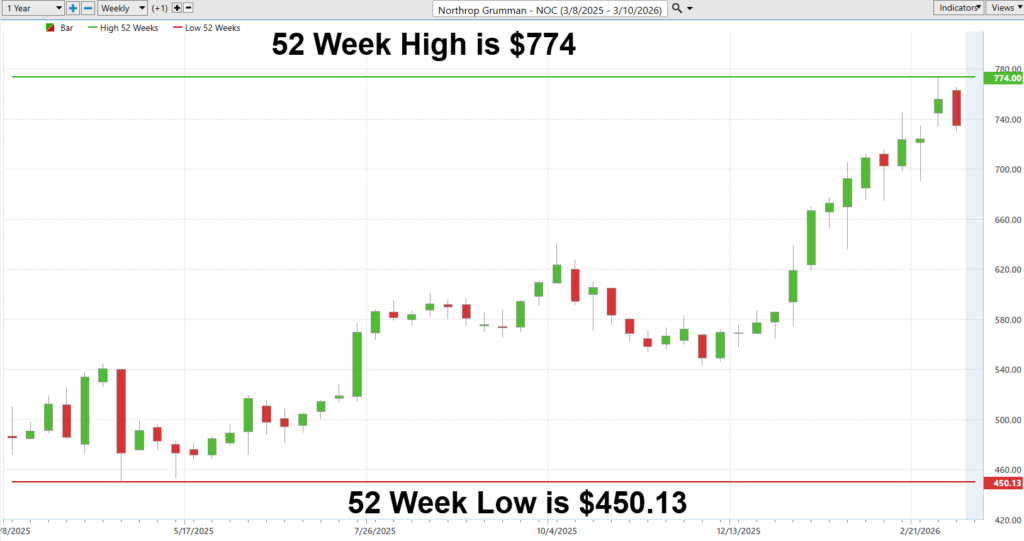
Look closely at the spread between the high and the low. Over the past year the stock traveled from $450.13 to $774.00. That is a $323.87 move. Put another way, the market demonstrated a trading range equal to 44% of the current price. That is not a sleepy stock drifting along. That is a market capable of big swings, fast repricing, and serious opportunity for traders who understand volatility.
Now compare that reality with what the analysts are predicting. Wall Street’s consensus volatility forecast sits around 21.9%. In plain English, the people publishing price targets are expecting a market that moves about half as much as it did over the last 12 months. When the real world delivers twice the volatility that analysts expect, it tells you something important. Analysts are assuming stability. The market has been delivering turbulence.
And here is the punchline traders should pay attention to. When expectations underestimate volatility this dramatically, the odds increase that price moves will surprise people again. Options get mispriced. Risk models get comfortable. Forecasts become fragile. Meanwhile the trader who understands the real historical behavior of the stock recognizes something different. This is not a quiet market. It is a stock with a proven habit of moving far more than the experts expect.
Best-Case/Worst-Case Scenario
Let’s step back and look at these charts the way a professional trader would but explain it in simple terms.
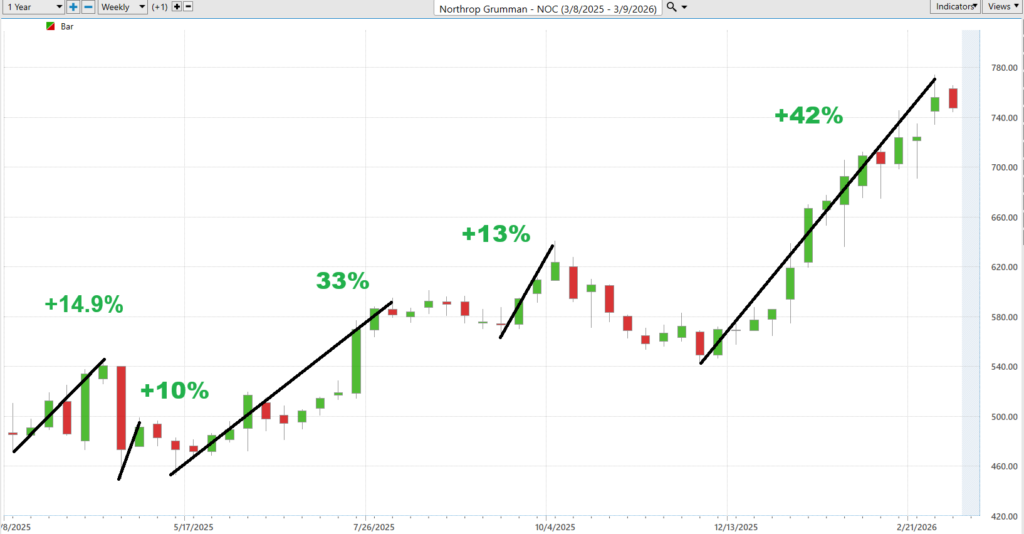
First, look at the strongest uninterrupted rallies, the green moves on the chart. These are the moments when buyers were in control and the stock marched higher without much interruption. Over the past year, Northrop Grumman produced several powerful advances. Early in the year the stock climbed about 14.9%, followed by another 10% rally. The next major advance pushed roughly 33%, then another move carried the stock 13% higher. But the biggest run came late in the year when the stock exploded upward by about 42%. That last rally is important. It tells us that when momentum shows up in this stock, it can move very far and very fast.
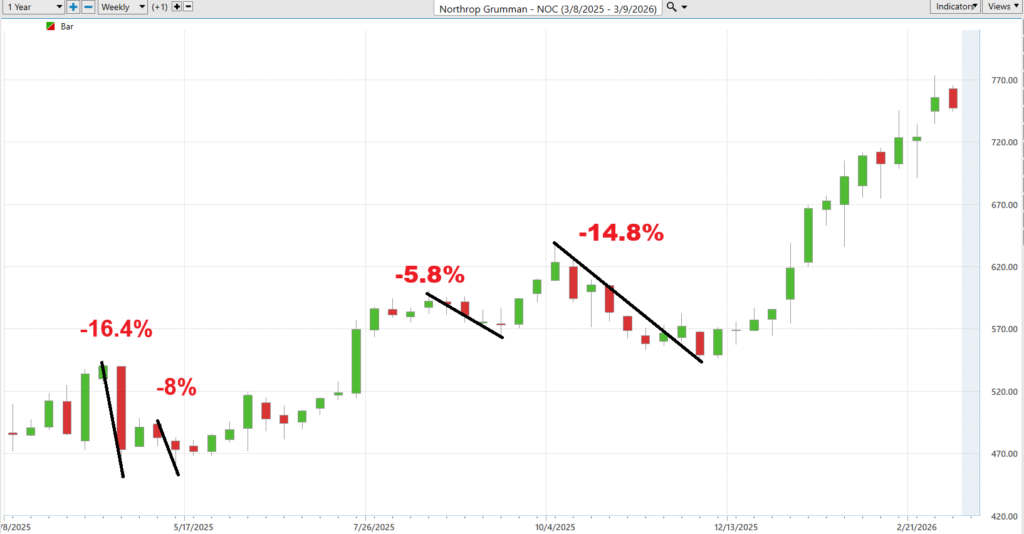
Now look at the strongest uninterrupted declines, the red moves. These represent periods when sellers took control. The largest drop in this period was about -16.4%. Another decline reached roughly -14.8%, while smaller pullbacks came in around -8% and -5.8%. In other words, even though the stock is trending higher overall, it regularly experiences corrections between 5% and 16%.
Now connect this to the numbers we discussed earlier.
Over the past year, Northrop Grumman’s actual trading volatility has been about 43.9%, based on the distance between its 52-week high and low. By comparison, Wall Street analysts are currently expecting only about 22% volatility based on their price forecasts. In other words, the stock has historically moved roughly twice as much as analysts are projecting, which suggests that the real-world price swings in $NOC may end up being much larger than the consensus expectations imply.
When you compare those statistics with the actual chart behavior, something interesting appears. The largest rallies (33% to 42%) are far bigger than what analysts are forecasting, while the largest declines (-14% to -16%) are almost exactly in line with analyst downside expectations. That tells you analysts may be underestimating the upside potential while recognizing the downside risk fairly well.
This leads to an important lesson every great trader eventually learns.
If you decide to trade a volatile asset, you must give it room to move. Stocks do not rise in a straight line. They surge, pause, and sometimes drop sharply before continuing higher. If you panic every time the price moves against you by a few percent, you will often get shaken out right before the real move begins.
But that same volatility that creates opportunity also creates risk. A stock capable of rising 40% in a rally is also capable of falling 15% in a correction. That is the price of admission. The most practical way to understand this is exactly what these charts show. Study the 52-week chart, identify the largest uninterrupted rallies, and identify the largest uninterrupted declines. Those moves give you a realistic picture of what the stock can do.
For Northrop Grumman, the historical pattern suggests something simple: a reasonable upside burst could be 30% to 40%, while a normal correction could easily reach 10% to 15%. When traders understand that range before entering a trade, they are far less likely to panic during normal volatility and far more likely to position themselves for the moves that actually matter.
Next, we compare the performance of $NOC to the broader stock market averages.
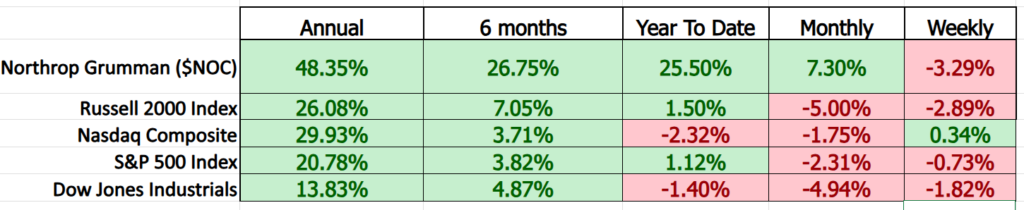
Look at the scoreboard and the story is obvious. Northrop Grumman isn’t just beating the market, it’s lapping it. Over the past year the stock is up 48%, while the S&P 500 is up about 21%, the Nasdaq roughly 30%, and the Russell 2000 about 26%. Same thing over six months and year-to-date. While the indexes are barely moving the needle this year, Northrop Grumman is up 25.5%. That tells you exactly where the big money has been hiding. Institutions have been piling into defense while most of the market has been grinding sideways.
Now look closer and the leadership becomes even clearer. Over the past month, the stock is up 7.3% while nearly every major index is down between 2% and 5%. That’s not luck. That’s capital rotation. Money is leaving broad indexes and flowing into sectors tied to real-world demand like defense spending. The only weak spot is the weekly pullback of about 3%, but after a monster run that’s normal digestion, not a breakdown. When a stock beats the market over the annual, six-month, YTD, and monthly timeframes, traders call that what it is: a leader. And leaders are exactly where serious traders focus their attention.
VantagePoint A.I. Predictive Blue Line
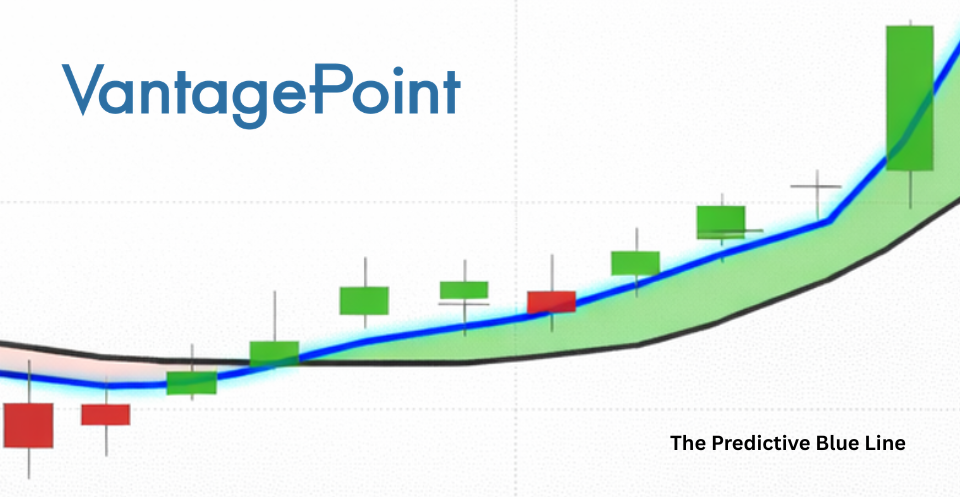
At first glance, the chart tells a familiar story of momentum. But look closer and two lines quietly explain most of the action. The black line is nothing fancy. It is simply a 10-day moving average, a backward-looking measure that shows where price has already been. It is useful, but it is also a bit like driving a car while looking only in the rearview mirror. The predictive blue line, by contrast, attempts to lean slightly into the future. When that blue line rises above the moving average, it creates what traders call an up forecast, a signal that the short-term trend and the probabilities now favor higher prices. In a chart like this one, you can see how those signals line up with the moments when momentum begins to accelerate.
But the real insight is not just in the crossover. It is in the slope. As long as the predictive blue line continues to angle upward, the market is quietly telling you that strength remains intact. Momentum is not just present, it is expanding. However, when the blue line begins to flatten or curl lower, the tone changes. That subtle shift often appears before price itself fully reacts. It does not always mean the trend is over, but it does signal that the market may be entering a phase of consolidation or short-term digestion. In other words, the predictive signal is starting to lose some of its forward push.
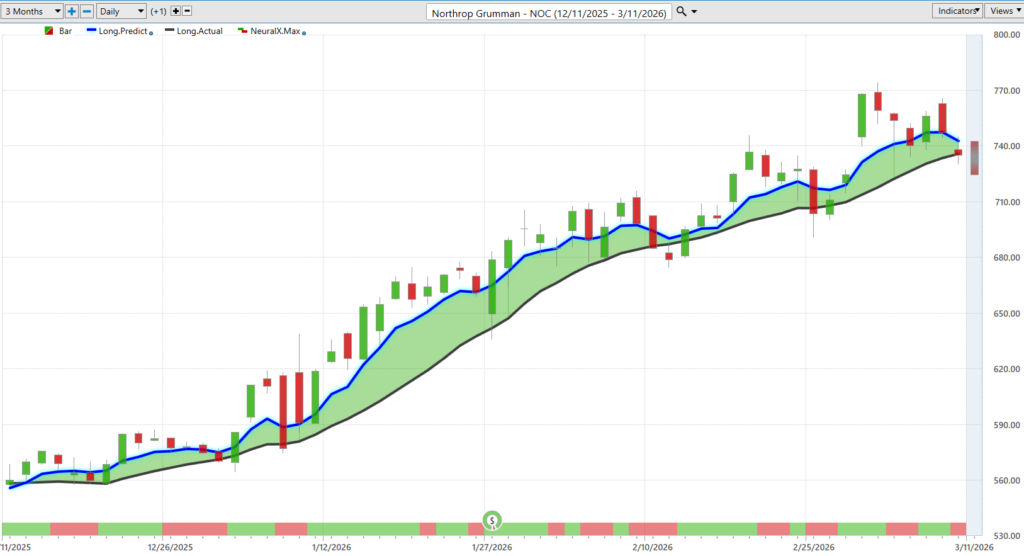
That dynamic leads to one of the most practical positioning strategies traders use with this indicator. The strongest opportunities often appear not when price is racing higher, but when temporary pullbacks drift back toward levels beneath the predictive blue line. These moments create a brief tension between short-term weakness and longer-term upward probability. When the broader slope of the blue line remains positive, those pullbacks frequently become areas where buyers step back in. It is a simple idea, but a powerful one: in a rising forecast, weakness often turns out to be the market offering a second chance to participate in the trend.
VantagePoint A.I. Neural Index (Machine Learning)
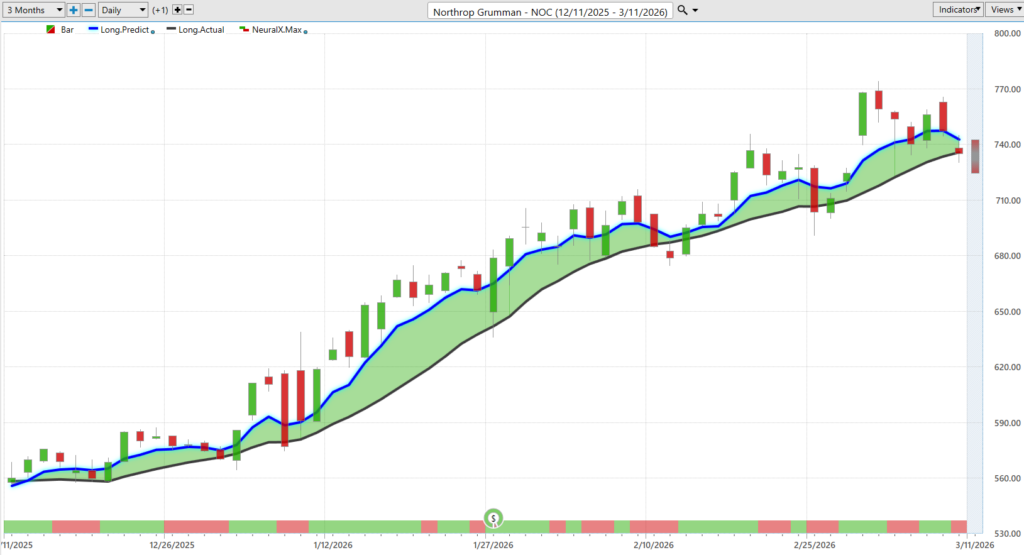
Look at the bottom of this chart and you’ll notice a small row of green and red bars. That signal is called a neural index, and it’s powered by a neural network. Now, a neural network might sound like something out of a science fiction movie, but the idea is simple. It’s a mathematical model designed to mimic how the human brain learns patterns. Engineers feed it huge amounts of historical market data. The network then builds layers of relationships between price, momentum, volatility, and intermarket forces. Over time it “learns” what conditions tend to lead to rising prices and what conditions tend to lead to short-term pullbacks.
The purpose of the neural network is not to predict the exact future price. No system can do that. Instead, it helps traders measure probability. When the neural index turns green, it suggests market conditions favor higher prices over the next couple of days. When it flips red, the model signals that the odds favor a short-term pullback. The forecast window for this signal is typically 48 to 72 hours, which makes it particularly useful for traders who want to manage short-term entries and exits within a larger trend.
In a strong trend like the one shown in Northrop Grumman, those red signals don’t necessarily mean the market is collapsing. More often they signal temporary reversion. In other words, the stock may drift lower for a short period before the larger trend resumes. And in many cases, those pullbacks tend to move back toward or slightly below the predictive blue line, where buyers often step in again. When traders combine the neural index with the predictive blue line and the longer-term trend, they gain something incredibly valuable: a way to separate normal short-term noise from meaningful shifts in momentum, helping them make calmer, more informed trading decisions.
VantagePoint A.I. Daily Range Forecast
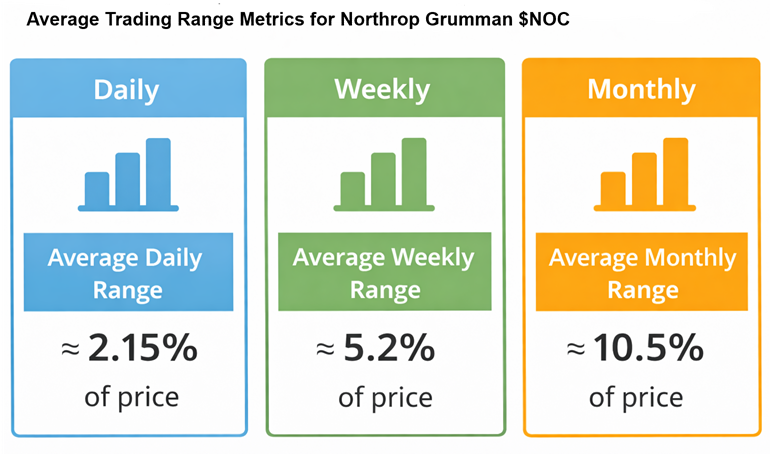
Every trader should start with a simple question: How much does this asset normally move? The first graphic answers that immediately. Northrop Grumman moves about 2.15% per day, roughly 5.2% per week, and around 10.5% per month. Those numbers are important because they tell you what “normal” looks like. If you don’t know the typical range of an asset, you can’t properly measure risk. A trader expecting a tiny move in a stock that regularly swings two percent a day is setting themselves up for trouble. Understanding the average range gives you a realistic expectation of how far price can travel in each timeframe.
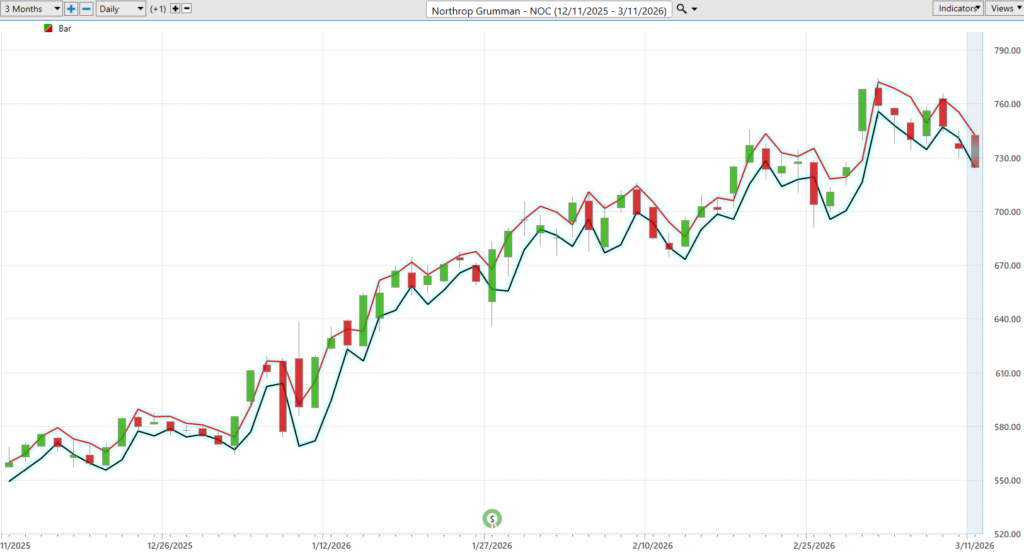
But knowing the average range is only the starting point. Traders don’t make money from statistics about the past. They make money by making better decisions today. That’s where the VantagePoint A.I. Daily Range Forecast comes in. Instead of simply telling you what the stock has historically done, it provides a probabilistic expectation for the current trading session, helping traders understand where price is most likely to move within the day.
Now look at the chart. Notice how clearly the forecasted range surrounds each trading bar as the trend unfolds. The market stops looking random and starts looking organized. You can see where price is traveling inside the expected daily movement while the broader trend continues higher. This combination of trend direction and daily range expectation helps traders quickly identify where risk is lowest and where the highest probability opportunities exist. That’s the real value of the VantagePoint A.I. Daily Range Forecast. It turns average volatility into actionable daily decision-making.
Intermarket Analysis
Intermarket analysis is the market’s way of reminding traders that nothing lives in isolation. A stock may look like it’s marching along under its own power, but in reality, it’s more like a canoe floating in a river. The current, the wind, the rocks under the surface, and the guy paddling behind you are all influencing where that canoe goes. In the financial world those forces are things like interest rates, currencies, commodities, government policy, and other stocks in the same industry. Think of it like a school lunch table. One kid sneezes and soon half the table is sniffling. Markets behave the same way. When one part of the financial system moves, the others tend to catch the cold.
Northrop Grumman sits right in the middle of one of the most obvious forces in the world economy: government defense spending. The U.S. government is its biggest customer, and when Congress decides to spend more money on national defense, companies like Northrop Grumman suddenly find themselves very popular. New aircraft programs, missile systems, and space defense projects don’t come cheap, and that steady flow of government contracts gives the company a backlog of work that stretches years into the future. Throw in a little global tension here and there and suddenly politicians start writing even bigger checks. When countries start feeling nervous, defense contractors tend to get busy.
Interest rates, inflation, and currencies also have a say in the matter, though they play more of a supporting role. Higher interest rates make money more expensive, which can make investors a bit less enthusiastic about future profits. Inflation raises the cost of materials and labor needed to build all those sophisticated machines. But compared with many companies, Northrop Grumman has a cushion because governments don’t usually cancel defense programs just because the economy has a bad quarter.
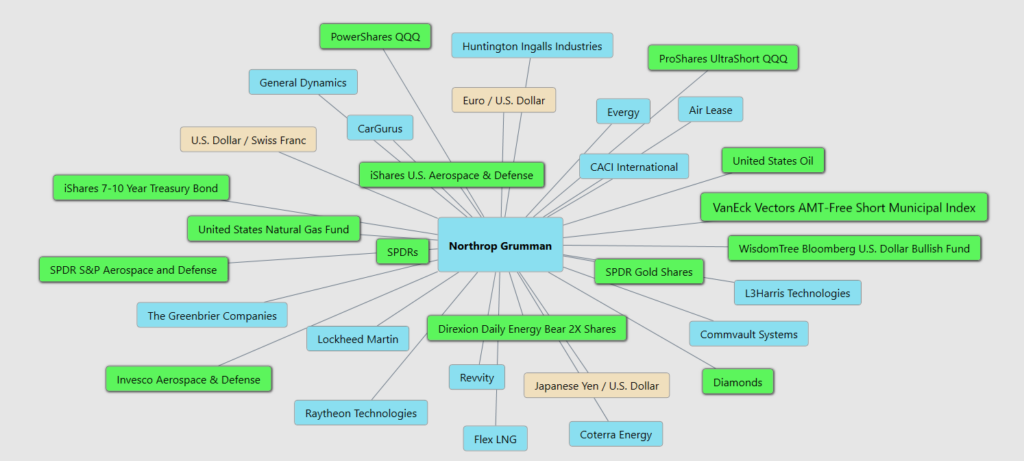
That’s where intermarket analysis comes in. The VantagePoint A.I. intermarket Analysis graphic shows 31 different markets connected to Northrop Grumman like spokes on a wheel. Defense ETFs, energy prices, currencies, bond funds, and competitors like Lockheed Martin and Raytheon all tug on the stock in one way or another. Each of those markets sends a small signal about where money is flowing and how investors are thinking about risk, government spending, and global stability. When traders study those connections instead of staring at one lonely chart, they start to see the bigger picture. And in markets, as in politics, the bigger picture is usually where the real story is hiding.
Our Suggestion
If you listen to the last two earnings calls from Northrop Grumman, the tone from management can best be described as calm, confident, and very aware that they are sitting in one of the more durable businesses on the planet. Governments do not usually cancel national defense because the economy had a bad quarter. Management sounded comfortable with their execution, spoke about program progress across their major platforms, and generally conveyed the sense that the company is doing what it said it would do. In plain English, they look like a contractor showing up on time, with the tools, and finishing the job.
That does not mean the business is risk free. Defense contractors live in a world where their largest customer is the government, and the government occasionally behaves like a committee of sleep deprived accountants arguing over a very large checkbook. Budget fights in Congress, shifting political priorities, and delays in funding programs can create turbulence. Supply chain issues and the complexity of building cutting edge military systems also mean projects can run into delays or cost pressures. When you build technology that looks like it belongs in a science fiction movie, things occasionally get complicated.
The main takeaway from the calls is that demand for advanced defense technology is not going away anytime soon. Global tensions remain elevated, allied nations are spending more on security, and long-term programs continue to move forward. Management appears focused on execution and backlog visibility remains strong. Translation for traders is simple. This is a company operating in a sector that tends to stay busy when the rest of the world starts getting nervous.
So, here is the practical takeaway. Put Northrop Grumman on your trading radar and watchlist. Stocks with strong trends and strong institutional interest often create a steady stream of short-term trading opportunities. Just remember that even good stocks move around a lot. Position-sizing matters. Good money management matters even more. The goal is not to be a hero in one trade. The goal is to still be standing when the next opportunity comes along.
It’s not magic.
It’s machine learning.
Disclaimer: THERE IS A HIGH DEGREE OF RISK INVOLVED IN TRADING. IT IS NOT PRUDENT OR ADVISABLE TO MAKE TRADING DECISIONS THAT ARE BEYOND YOUR FINANCIAL MEANS OR INVOLVE TRADING CAPITAL THAT YOU ARE NOT WILLING AND CAPABLE OF LOSING.
VANTAGEPOINT’S MARKETING CAMPAIGNS, OF ANY KIND, DO NOT CONSTITUTE TRADING ADVICE OR AN ENDORSEMENT OR RECOMMENDATION BY VANTAGEPOINT AI OR ANY ASSOCIATED AFFILIATES OF ANY TRADING METHODS, PROGRAMS, SYSTEMS OR ROUTINES. VANTAGEPOINT’S PERSONNEL ARE NOT LICENSED BROKERS OR ADVISORS AND DO NOT OFFER TRADING ADVICE.


